

All Quiet on the Regional Front?: Markets Moving on from Regional Banking Stress
In the span of a few weeks, markets are back to “normal.” After a stressful March, equities rallied by 5%, financial conditions loosened, credit spreads tightened, and Treasury yields rebounded.
The bond market is back to pricing in a 25-basis points hike for May and even a possibility for a hike in June, after discounting a series of rate cuts to start as early as July when bank crisis fears were running high. Economic data continue to show mixed signals, with areas of relative resilience (hard data like unemployment and consumer spending) and weakness (survey and sentiment data).
Based on current market pricing, financial markets seem to be signaling that the collapse of Silicon Valley Bank and regional banking stress may not be repeated, or have broad economic implications. The Federal Reserve expressed confidence the banking system is “sound and resilient”, even though officials acknowledged that it may take time before the true effects of the crisis show up in credit and lending. Without acute financial stability issues, the Fed continues to emphasize inflation-fighting as its primary goal, with multiple Fed members signaling that there is “more work to be done” in order to confidently quell inflation.
It is likely far too early to judge the ultimate impact of March’s banking stress on the economy, with key indicators to monitor the impact, such as loan growth, being notably lagging of other economic trends. And so, the lagged effect of the banking crisis could keep the U.S. economy stronger than expected in the near term, thus further emboldening the Fed to continue its string of interest rate increases, as some Fed officials have indicated.
Even with the stabilization recent data to monitor banking stress (deposit growth, loan growth, and usage of the Fed’s lending facilities), banks’ balance sheets do remain vulnerable to a further increase in rates because of large holdings of long-maturity securities (though this risk has been mitigated by the Fed’s opening of its discount window to allow banks to borrow against underwater assets at par).
Rising interest rates could also spur more deposits flight as customers seek higher yielding alternatives such as money market funds. Regional banks that provided 1Q23 earning updates this week attempted to deliver a message of stability in regard to deposits, with manageable outflows in the wake of SVB and even some inflows in the first weeks of the second quarter.
Looking forward, an important lesson learned from the SVB crisis is that in the modern, digital economy, deposits can be withdrawn quickly and with little friction through an app. The speed of withdrawals that caused the run on SVB showed that the time people want to hold money on deposit at a bank has dramatically shortened, mostly in times of uncertainty.
Through this tightening cycle, banks have been slower to adjust deposit rates in response to the rise in the Fed Funds rate as the NY Fed research shows. But banks, mostly smaller regional banks, could face increasing pressure to raise deposit rates in order to keep deposits from continuing their flight (this applies to big banks too, with Goldman announcing a 4.15% savings account in partnership with Apple).
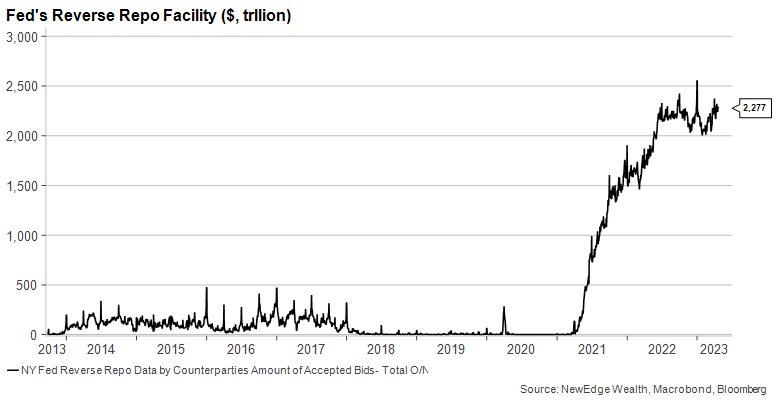
The competitive alternatives, such as higher yielding individual Treasury bonds/bills and money market funds, can continue to put pressure on bank deposits. As a sign of this process continuing is the Fed’s Reverse Repo facility which is predominately used by money market funds that deposit cash at the Fed in return for interest that matches interest paid on T-bills. The facility reached a new high since 2021 and is the clearest indication of the underlying flow of deposits moving into money market funds.
In other signs of stress remaining elevated, the Fed’s emergency liquidity facilities such as the bank term lending and discount window showed a slight uptick in usage as seen from the Fed’s weekly balance sheet data. The bank earnings have come in relatively better than expected but the banks announced provisioning for potential future loan losses that were higher than the prior quarter and prior year. In the meantime, the WSJ reported that the Federal Reserve is considering restricting capital rules for regional banks by changing accounting treatment of securities holdings.
Between the upward pressure on deposit yields in order to attract and retain deposits (pressure net interest margins), and new rules around capital, we could see bank profitability be dented in coming years.
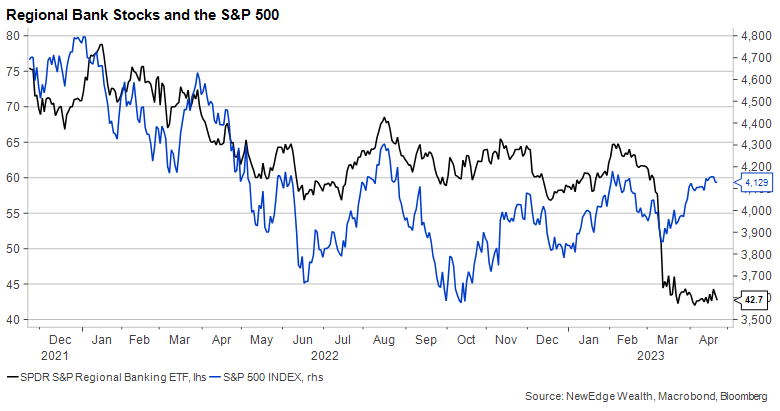
When we look at the broad market rebound in recent weeks, as both equities and credit seem to be breathing a sigh of relief that banking issues are not causing acute pain, we note one conspicuous group of stocks that are not participating in this rebound: the regional banks themselves. The KRE Regional Bank ETF remains near the SVB lows, continuing its underperformance of the market, and potentially signaling that at least for regional bank investors, it may be too early to call the “all clear”.
Top Points of the Week
By Cameron Dawson, CFA®
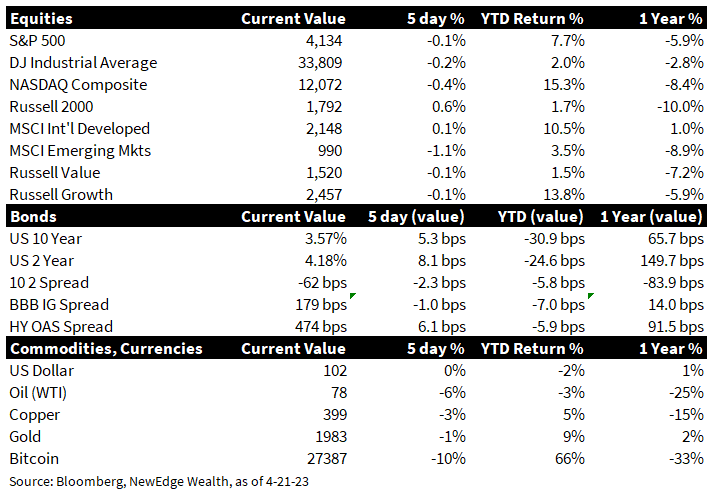
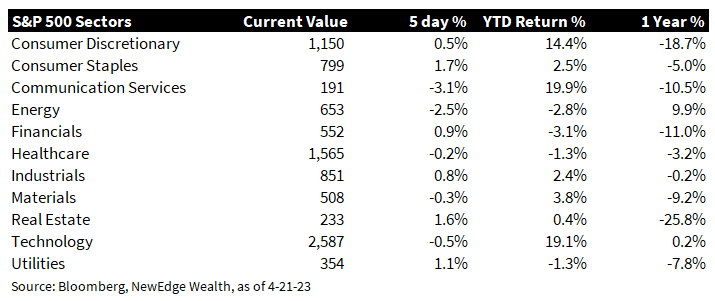
- Equites Mixed: U.S. large cap equities (S&P 500, NASDAQ, Dow) ended the week slightly lower, while small caps (Russell 2000) ended the week slightly higher. Growth slightly underperformed Value (Russell 1000 indices), helped by a rebound in Financials, which are a large weighting in the Value index. From a sector perspective, the week was led by the most defensive sectors like Consumer Staples and Utilities, while Technology and Communication Services underperformed (possibly due to the yield a liquidity sensitivity of these companies; when yields are falling and liquidity is expanding, these sectors have often outperformed).
- Yields Higher with Hawkish Fed Speak: U.S. Treasury yields rose on the week, driven by bets that the Fed can and will raise rates more than expected a few weeks ago. Relatively resilient economic data and stabilization in banking data (such as deposit levels stabilizing, loan growth ticking higher, and banks’ use of the Fed’s lending facilities slowing) provided some calm that March’s banking issues have not yet caused significant economic weakness. Fed speakers during the week (Barkin, Williams, Waller, Mester) signaled that they think there is still work to be done on inflation and that interest rate cuts were not immediately forthcoming. This led to the bond market pricing in a higher probability for rate hikes in May and June, a slower start to interest rate cuts in 2H23, and fewer cuts through the remainder of the year.
- Oil Drops: WTI Crude oil dropped back below $80/barrel to $77.80, which has reversed a large portion of the jump in prices following OPEC+’s surprise output cut in early April ($75 the day before the output cut). Global growth fears continue to weigh on oil prices, while the reopening of China has been disappointing for incremental oil demand. U.S. crude stockpiles falling on the week was not enough to spur higher prices. Analysts will look to forecasts for the upcoming summer driving season for the health of oil demand.
- Earnings Season Kicks into High Gear: 1Q23 earnings season continued with 86 of the S&P 500 names now reporting. According to Bloomberg, 54% of companies have beat sales forecasts, with an aggregate beat of 2%, while 76% of companies have beat earnings forecasts, with an aggregate beat of 5% (FactSet calculates the 5-year average EPS beat rate at 77%). The reception to these earnings has been positive, with the 1-day price reaction +0.89%, with only Communication Services and Energy having negative reactions.
- Large Bank Earnings Takeaways: There continues to be a clear divergence between large and small bank performance. Large banks mostly beat earnings estimates (driven by strong net interest income made possible by higher interest rates) and reported stable deposit and loan volume trends. Banks did increase loan loss reserves in the quarter, reflecting concerns about future economic growth and credit quality (including in commercial real estate). Investment banking activity remains weak given lackluster capital market activity, while trading profits were mixed, with some firms navigating the volatility in fixed income markets in the quarter better (MS) than others (GS).
- Regional Bank Earnings: Regional bank stocks continue to languish, with an anemic bounce off of the post-SVB lows. Some of the larger regional banks reported stable deposits (FITB/Fifth Third, and TFC/Truist), but for the case of TFC, it was not enough to drive a recovery in the stock, as earnings guidance was softer than expected driven by weaker net interest income. WAL/Western Alliance shares rebounded after it reported a bounce back in deposits at the start of the second quarter, while ZION/Zions Bancorp shares retreated, despite management’s message of stability, as concerns about large commercial real estate exposure remain.
- Other Notable Earnings: Tesla (TSLA) shares fell over -9% on Thursday after the company reported weaker than expected margins due to multiple price cuts on its most popular vehicles. The company signaled more price cuts to come, stoking fears that TSLA’s industry leading margins could come under further pressure.
- Some Signs of Labor Market Weakness Emerge: Initial Jobless Claims ticked higher to 245k (vs. 240k consensus), while Continuing Claims rose to 1.865m (vs. 1.804m prior). This rise in Continuing Claims now represents a 40% increase from the 12-month low in claims, which is consistent with past recessionary periods, though some post-pandemic distortions in the data should be noted. Many of the layoffs that were announced in 1Q23 have begun to be enacted (this week DIS and META enacted their layoffs).
- Next Week in Data: Next week a flood of housing data is released including house prices, mortgage applications, and new home sales. Dallas, Chicago, Philadelphia, and Richmond report manufacturing and services activity data. An initial read on 1Q23 GDP is released Thursday (consensus 2%), alongside Initial and Continuing Jobless Claims (a much-watched data point for signs of emerging labor market stress). The week ends with Friday’s March PCE inflation data, the Fed’s preferred metric (consensus +4.1% Headline, +4.5% Core).
- Next Week in Earnings: Next week is the heaviest week for earnings releases, with 178 S&P 500 companies reporting. All eyes are on big tech next week with the behemoths GOOGL, MSFT, META, and AMZN all releasing results. Analysts will continue to track banking results closely, with regional banks such as First Republic providing updates. There will also be reads on the industrial and energy sectors with companies such as CAT, BA, GE, MMM, XOM, and CVX reporting.
IMPORTANT DISCLOSURES
Abbreviations:
Barkin: Thomas Barkin, President of the Federal Reserve Bank of Richmond; Mester: Loretta Mester, President of the Federal Reserve Bank of Cleveland; OPEC+: a group of 23 oil-exporting countries which meets regularly to decide how much crude oil to sell on the world market; PCE: personal consumption expenditures; Waller: Christopher Waller, member of the Federal Reserve Board of Governors; West Texas Intermediate (WTI) Crude: refers to a grade or a mix of crude oil, and/or the spot price, the futures price, or the assessed price for that oil; colloquially WTI usually refers to the price of the New York Mercantile Exchange WTI Crude Oil futures contract or the contract itself; Williams: John Williams, President of the Federal Reserve Bank of New York.
Index Information: All returns represent total return for stated period. S&P 500 is a total return index that reflects both changes in the prices of stocks in the S&P 500 Index as well as the reinvestment of the dividend income from its underlying stocks. Dow Jones Industrial Average (DJ Industrial Average) is a price-weighted average of 30 actively traded blue-chip stocks trading New York Stock Exchange and Nasdaq. The NASDAQ Composite Index measures all NASDAQ domestic and international based common type stocks listed on the Nasdaq Stock Market. Russell 2000 is an index that measures the performance of the small-cap segment of the U.S. equity universe. MSCI International Developed measures equity market performance of large, developed markets not including the U.S. MSCI Emerging Markets (MSCI Emerging Mkts) measures equity market performance of emerging markets. Russell 1000 Growth Index measures the performance of the large- cap growth segment of the US equity universe. It includes those Russell 1000 companies with relatively higher price-to-book ratios, higher I/B/E/S forecast medium term (2 year) growth and higher sales per share historical growth (5 years). The Russell 1000 Value Index measures the performance of the large cap value segment of the US equity universe. It includes those Russell 1000 companies with relatively lower price-to-book ratios, lower I/B/E/S forecast medium term (2 year) growth and lower sales per share historical growth (5 years). The BBB IG Spread is the Bloomberg Baa Corporate Index that measures the spread of BBB/Baa U.S. corporate bond yields over Treasuries. The HY OAS is the High Yield Option Adjusted Spread index measuring the spread of high yield bonds over Treasuries.
The views and opinions included in these materials belong to their author and do not necessarily reflect the views and opinions of NewEdge Wealth, LLC.
This information is general in nature and has been prepared solely for informational and educational purposes and does not constitute an offer or a recommendation to buy or sell any particular security or to adopt any specific investment strategy.
NewEdge and its affiliates do not render advice on legal, tax and/or tax accounting matters. You should consult your personal tax and/or legal advisor to learn about any potential tax or other implications that may result from acting on a particular recommendation.
The trademarks and service marks contained herein are the property of their respective owners. Unless otherwise specifically indicated, all information with respect to any third party not affiliated with NewEdge has been provided by, and is the sole responsibility of, such third party and has not been independently verified by NewEdge, its affiliates or any other independent third party. No representation is given with respect to its accuracy or completeness, and such information and opinions may change without notice.
The views and opinions included in these materials belong to their author and do not necessarily reflect the views and opinions of NewEdge Capital Group, LLC.
This information is general in nature and has been prepared solely for informational and educational purposes and does not constitute an offer or a recommendation to buy or sell any particular security or to adopt any specific investment strategy.
NewEdge and its affiliates do not render advice on legal, tax and/or tax accounting matters. You should consult your personal tax and/or legal advisor to learn about any potential tax or other implications that may result from acting on a particular recommendation.
The trademarks and service marks contained herein are the property of their respective owners. Unless otherwise specifically indicated, all information with respect to any third party not affiliated with NewEdge has been provided by, and is the sole responsibility of, such third party and has not been independently verified by NewEdge, its affiliates or any other independent third party. No representation is given with respect to its accuracy or completeness, and such information and opinions may change without notice.
Investing involves risk, including possible loss of principal. Past performance is no guarantee of future results.
Any forward-looking statements or forecasts are based on assumptions and actual results are expected to vary from any such statements or forecasts. No assurance can be given that investment objectives or target returns will be achieved. Future returns may be higher or lower than the estimates presented herein.
An investment cannot be made directly in an index. Indices are unmanaged and have no fees or expenses. You can obtain information about many indices online at a variety of sources including: https://www.sec.gov/fast-answers/answersindiceshtm.html.
All data is subject to change without notice.
© 2024 NewEdge Capital Group, LLC


