Weekly Summary: January 17 – 21, 2022
Key Observations:
- Considering the contemporaneous easy monetary policies of the world’s major central banks that, in conjunction with COVID-19 trends and infections, resulted in many surprise developments and outcomes, we anticipate also many surprises as monetary tightening policies begin.
- The contemporaneous nature of central bank policies both in terms of easing and now the beginning of tightening phases is unprecedented. “Excess” liquidity was provided during the “easy” monetary phase of the pandemic and now the draining of liquidity from financial markets is about to begin. It is virtually axiomatic that excess liquidity leads to higher asset prices.
- For policymakers, perhaps the most surprising aspect of their own looser monetary policies was the extent of increases in inflation and the inflation’s persistent nature. It is very doubtful that many policymakers anticipated the extent of the services demand shift to an increased demand for goods. The extent of supply-chain disruptions and shortages, including commodity shortages, were also most likely surprises to them as well.
- Historical data emphasizes the importance of Purchasing Managers’ Index (PMI) levels and their relevance to changes in the trajectories of equity prices during tightening cycles.
The Upshot: The swiftness and the severity of the increase in bond yields and the equity market downturns, accompanied by rotation into Value stocks in lieu of Growth stocks and starting at the very outset of January was very much like we expected. We understand that the trajectory of equity markets in general during and after the beginning of the Federal Reserve’s (Fed) tightening of monetary policies phase should be greatly determined by whether the tightening is into a still robust economy. We view PMI levels as the best indication of the strength of the economy, and we anticipate a continuing robust global economy for at least the majority of this year. Given the current vagaries of financial markets, it seems that a barbell approach of quality big-cap Growth stocks along with Value and Cyclical type stocks could be the preferred portfolio for many long-term investors.
Pandemic Helped Bring Us “All Together Now”
The virtually non-stop repetition of the Beatle’s lyrics “All Together Now” should be a reminder to us all that not only is the whole world “together” in dealing with the pandemic, but the world’s major central banks have been acting in concert as well, for the most part. The concerted action was most evident during the monetary “easing” stage towards the beginning of the pandemic. Although a number of central bankers in emerging markets (EMs) have already raised their key interest rates, the Fed appears to be taking the lead now in tightening monetary policy in an effort to combat elevated inflation levels. Although higher-than-“normal” inflation is now apparent almost everywhere globally, each country or region has its own idiosyncrasies, so the timing and the extent of monetary tightening is bound to differ. China’s central bank — the People’s Bank of China (PBOC) — is the principal major central bank that is not “together” with these more “hawkish” policies. In fact, the PBOC is currently easing its monetary stance.
Similar Policies of Major Central Banks
It is very rare that the world’s major central banks act to adopt essentially similar policies at the same time. No one seemed to mind when easy monetary policies were adopted “together.” Many of the world’s governments helped enhance prospects to strengthen economies and financial markets with exaggerated fiscal stimulus as well. Investors and policymakers are now starting to experience the less pleasant tightening policies. The mere mention of tight policies are already negatively impacting many financial markets before they are implemented. It was a lot easier advocating easy policies. However, the resolve of policymakers in fighting inflation will be tested soon.

Source: J.P. Morgan, US MARKET INTELLIGENCE: MORNING BRIEFING (1/21/2022)
Policies Plus COVID-19 Equal Surprises
The combination of easy policies and the unexpected developments of COVID-19 and its variants led to many surprises. Perhaps the biggest surprise to many policymakers was the extent of increasing inflation rates that were closely tied to supply chain disruptions and labor shortages. We surmise that very few investors and governmental entities foresaw the huge demand shifts from services to goods consumption, and the build-up of private savings. The latter presumably exacerbated many companies’ pricing power so that they were able to maintain, and even enhance their profit margins. As we have expressed in many of our prior commentaries, all of the above factor interactions have led to structural changes that, in our opinion, have set the stage for many aspects of currently elevated inflation levels to remain more persistent and more elevated than the consensus estimates.
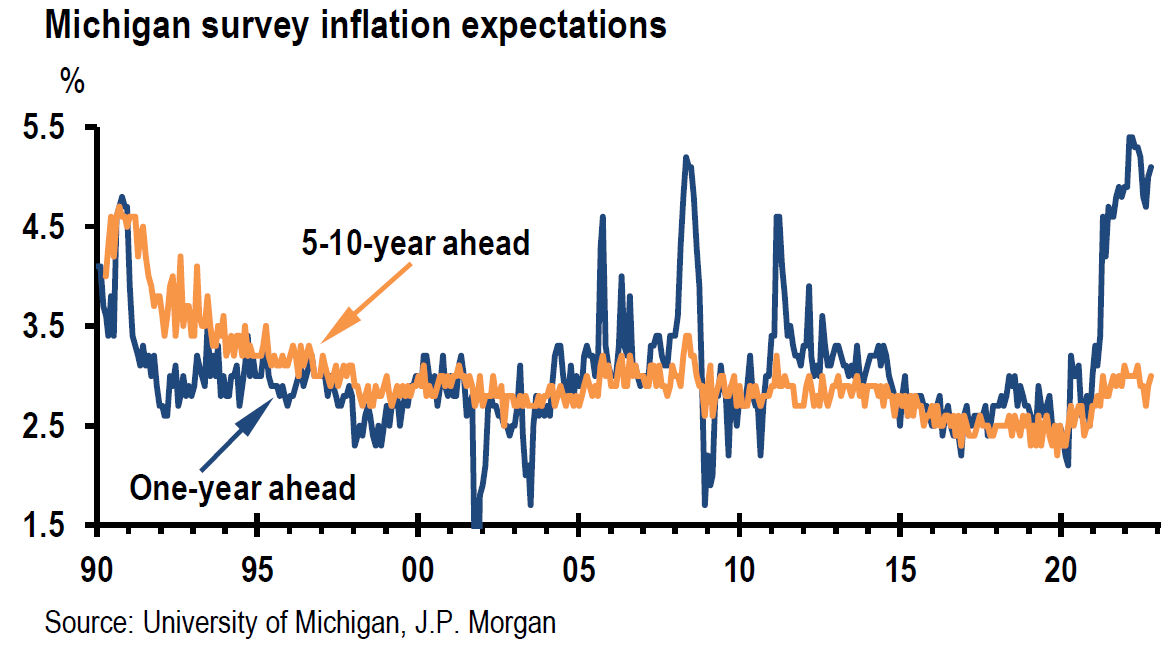
Easy monetary policies have resulted in large increases in money supply, thereby increasing liquidity. It is almost axiomatic that “excess” liquidity will enhance asset prices. In fact, that is exactly what policymakers intended. Unfortunately, in many instances, these price increases became “excessive.” Many central bankers, including the Fed, are particularly wary of inflation expectations becoming “entrenched.” We suppose that the Fed has tremendous resolve to fight elevated inflation because they now believe that it is the best path to a growing and sustainable economic recovery. Fed chair Powell’s resolve on tightening policies in December of 2018 was tested when U.S equities plummeted about 20%. He relented at that time. We trust that it would take a similar market reaction to test the Fed’s resolve again. But we understand that this time it would be much more difficult for the Fed to abandon its more hawkish monetary stance. We conclude that even if such a market arises, it would merely slow the pace of the Fed’s intention to tighten its policies.
AHE: Average Hourly Earnings per Worker

LFPR: Labor Force Participation Rate
Source: Citi, Global Commodities: Wildcards 2022: A Year When the Unexpected Should Reign (1/20/2022)
Unprecedented Central Bank Coordinated Policies (Loosely)
We are unaware of any historical precedent when the world’s major central banks were acting and/or intended to act “together” to tighten their monetary policies. We expected this to be a very difficult and volatile transition. We conceived that financial markets’ reactions would be swift and severe and be evident even from the very beginning of January. The timing and severity of market reactions were much like we expected. We became even more confident in our expectations when we realized that the consensus appeared to be that U.S. equities would begin with a strong uptrend in January before correcting. As we anticipated, the downturn of U.S. equities and the rotation into Value stocks continued this week. Please see the attached Appendix. The more it has become evident to many financial market participants that many central banks intend to implement more restrictive policies, the more quick and severe the reactions have become. The anticipation of the “draining” of liquidity on a global scale is unprecedented. We conclude that no one should be very confident of predicting the timing and the path of the of financial markets outcome this year. Just as there were many surprises when the world was “loosening” policies, we merely assume that there will also be many surprises during the “tightening” phase.
Key Data to Focus On
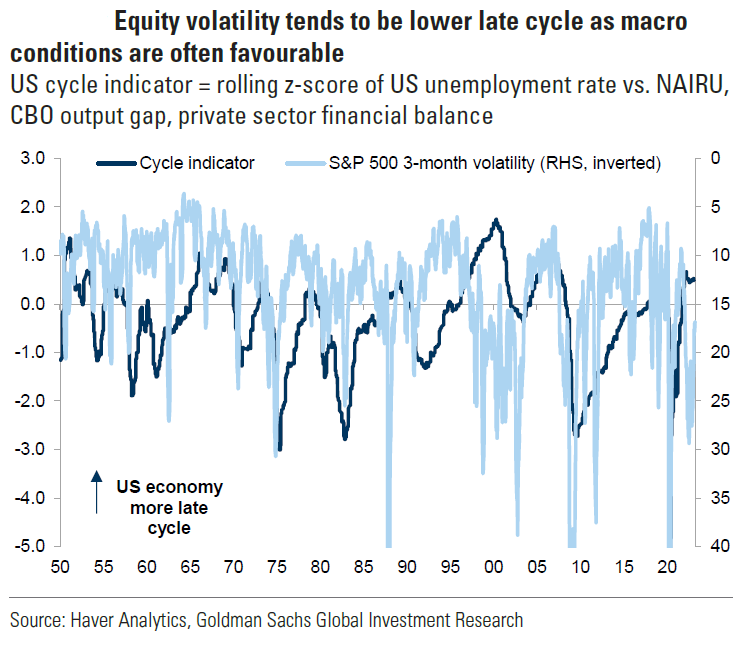
Faced with the current circumstances, the question confronting us is what data points we should monitor and focus on in particular. We continue to maintain our view of above consensus estimates for 2022 global economic growth and inflation levels. Any data points that would change our views on our assumptions will be scrutinized very carefully — tightness of labor markets, supply chain disruptions, transportation bottlenecks, shelter costs, commodity prices, commodity shortages, consumers’ confidence levels and inflation expectations, geopolitical events, etc. But perhaps the single most important data-points will revolve around PMI levels. PMIs are indexes of the prevailing directions of economic trends in the manufacturing and services sectors. According to a Goldman Sachs report of January 19, 2022, which focuses on the Fed’s tightening cycles, equity returns tend to be lower and volatility increases as PMI levels fall near or below the 50 level. PMI levels below 50 indicate contractions in the associated economic trends. Right now, most global PMIs are comfortably above 50. Most PMIs have rebounded from the downturns during the summer months when the Delta variant was predominant and almost all PMIs remained above 50 during that period.
Short-Term Economic Weakening Before Rebound
The most recent data points from late December into January of this year indicate another short-term economic downturn — but this time tied to the Omicron variant. At this point, we are confident that most, if not all PMIs of developed market (DM) economies will remain comfortably above 50 through at least the majority of this year. Given the less virulent and highly transmissible characteristics of this latest Covid-19 variant, we are assuming a quick global economic rebound. Furthermore, we are accepting that the ensuing global economic rebound will become more widespread and more concentrated in terms of timing. We are encouraged by China’s latest easing of its policies to help maintain suitable economic growth rates. During this week alone, the PBOC cut certain key rates on two separate days and held a news conference to reiterate their commitment for additional easier policy measures to come.
Historically Relevant Financial Market Trends During Fed Tightening
In its January 19 report, Goldman Sachs concluded that historically — since the 1990’s, U.S. equities “corrected” over the three months after the start of a Fed tightening cycle, but that the S&P 500 then generally achieved strong returns in the ensuing 12-to-24-month time frame after the initial tightening phase. Along with Value and Cyclical types of equities, International equities and commodities, tended to outperform, at least during the initial stages of Fed tightening. But the critical element, seemed to be that the economy was still resilient during this period. In other words, precedent has shown that for equities to do well after the Fed started a tightening phase, the Fed had to have been tightening into a resilient economy. We believe this to be the case at present. But if it turns out the Fed is implementing more hawkish policies quickly into an economy where PMIs are falling close to or near 50, then it is more problematic for positive equity returns in general.
Source: Goldman Sachs, GOAL Post: Fed tightening cycles and duration frustration (1/19/2022)
Considering Sometimes Inconsistent Economic Data — Examples
The above historical trends should not be considered as entirely dispositive of the current environment. Again, we wish to reiterate that given the global nature of (at least loosely) correlated tightening central bank policies, we are convinced that many surprises are looming in the future. We are therefore not at all surprised by seemingly contradictory economic data points recently. Some of these seeming contradictions might simply relate to the timing of economic effects — many of which could be merely correlated to infection rates spikes from the Omicron variant.
For example, the Empire State Manufacturing Survey, based on data collected from January 3-to-10, showed that business activity leveled off unexpectedly and abruptly. Despite decreasing somewhat, prices paid and received remained elevated. Nevertheless, firms remained optimistic that business conditions would improve over the next six months. Based on responses collected in the first full week of January, the Business Leaders Survey from The Federal Reserve Bank of New York, showed a business climate that firms perceived as worse than normal for this time of year. However, the future business climate index rose to its highest level in several months. Surveyed business leaders expect strong gains in employment and wages, as well as prices paid and received. Furthermore, capex plans remained solid.
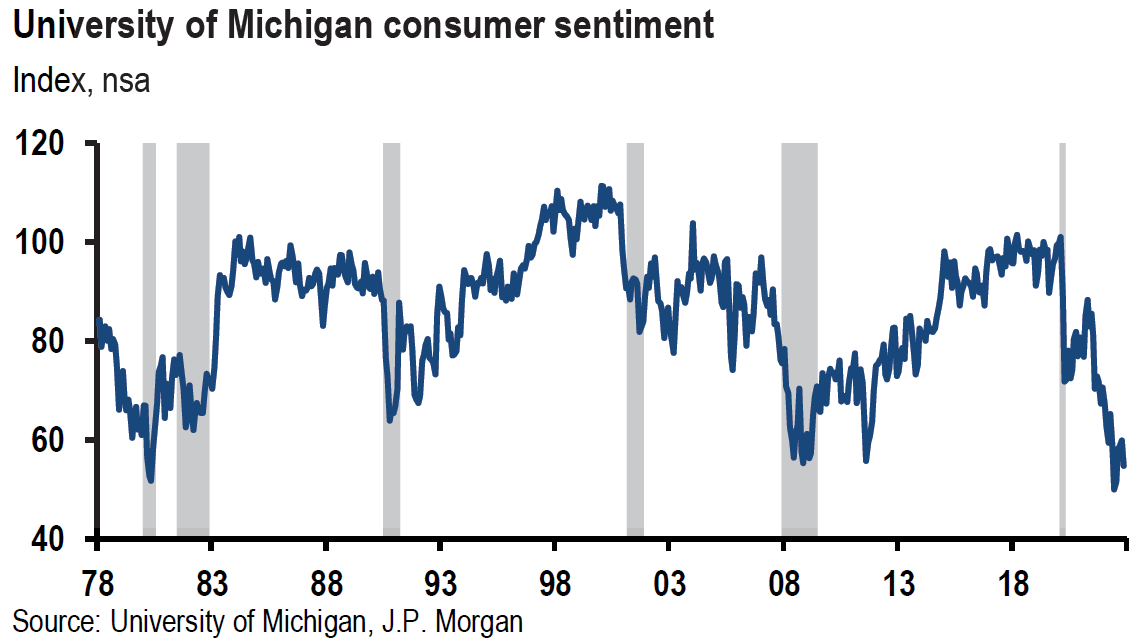
In contrast, the Philadelphia Fed’s Manufacturing Survey, based on responses collected from January 10 to January 18 and released later this week, showed an unexpected rise in business activity after an unexpectedly large fall in the prior month. But these respondents also shared the optimism of their New York counterparts for economic growth over the next six months. We have seen this pattern repeated in survey after survey over the past few months – irrespective of their perceived current business conditions. Firms retained generally their optimism in regard to future business conditions. At least so far, it appears that consumers and businesses seem willing and able to look past the ill effects of the various COVID-19 variants. We are encouraged that this optimism will eventually translate into solid economic growth. We are also convinced that failure to rein in inflation will begin to erode this optimism of the future. We are already seeing this erosion in the latest consumer sentiment surveys.
At the beginning of this week, China announced a better-than-expected GDP growth rate for Q4, 2021, as well as better-than-expected industrial production growth for December. But December retail sales were well below expectations. In contrast, U.S. industrial production for December disappointed and was the slowest since March 2021. Supply chain disruptions and shortages of raw materials were blamed for the shortfall. U.S. motor vehicle and parts production were below expectations, confirming persistent supply issues. But why so different from China in December? Like China, U.S. December retail sales also disappointed.
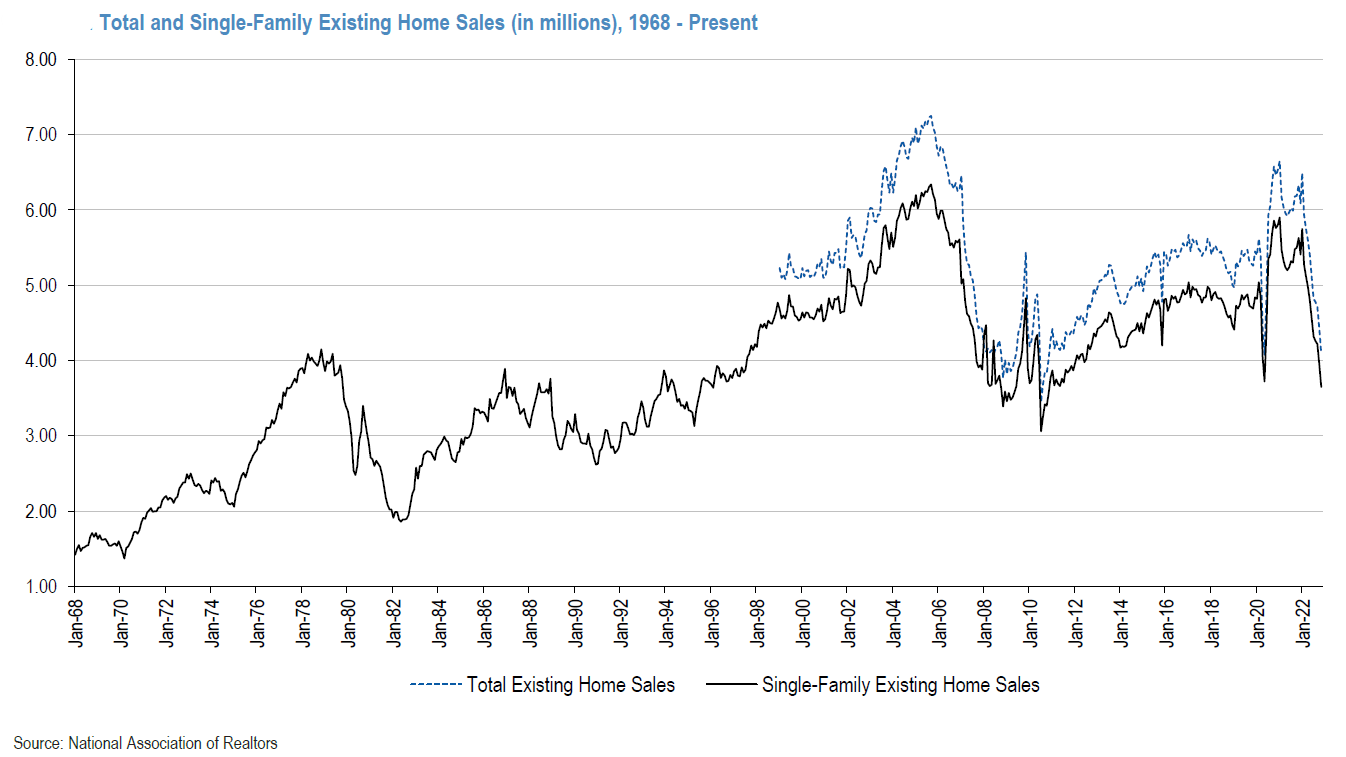
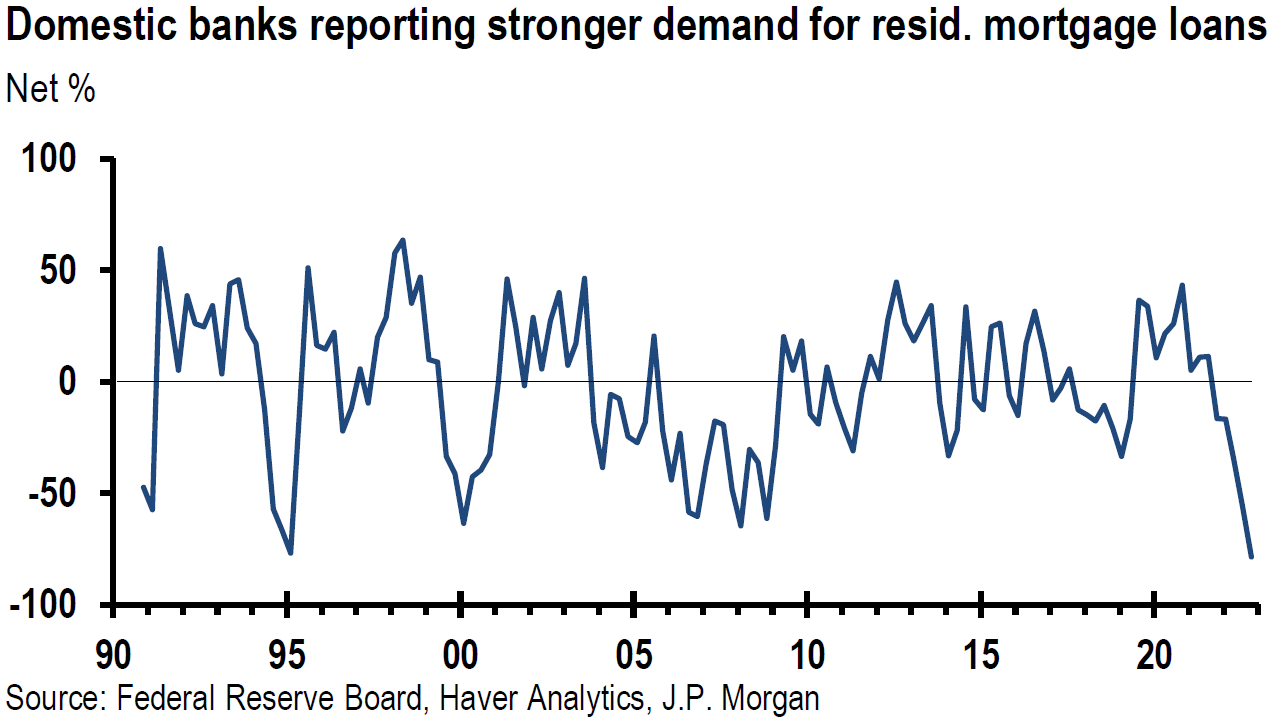
U.S. housing starts were reported midweek by the Census Bureau. Housing starts unexpectedly rose as building permits also surged. Unusually warm weather in December undoubtedly helped bolster these results. The much more volatile component of the housing data – multi-family homes – accounted for the surprise upside versus the much larger single-family component of the data. In contrast, the National Association of Realtors reported on January 20 that U.S. existing home sales were much lower than expected in December. Lower inventory levels probably played a big role in these disappointing results. The end of December inventory level of 910,000 unsold existing homes was at an all-time low. This represented a 1.8-month-of-supply of existing homes at the current sales pace. This was the lowest such statistic since January of 1999. Given the low levels of inventory it is unclear to what extent the recent rise in 30-year fixed mortgages will play. CNBC reported on January 20, that the average rate of such mortgages rose by about 60 basis points from the October-November period to the present. Most of the December sales contracts were signed during these previous two months. Recently quoted 30 –year fixed mortgage rates were at 3.56%.
Interpreting Economic Data
As can be seen from recent economic data points summarized above, some of which appear to be somewhat contradictory, we are convinced that the interpretation of economic data will become increasingly difficult. It seems that the myriad of factors one must consider continues to grow exponentially. The interconnections of numerous factors are very complicated and changing constantly. Often, many interpretations of the data are plausible. We can only hope that our interpretations will at least be the most plausible and highly predictive.
Bottom Line
The unprecedented anticipated contemporaneous tightening cycle of almost all of the world’s central banks virtually ensured that financial markets would experience heightened volatility during this transition period. However, the less virulent but more transmissible nature of the Omicron variant encourages our relatively optimistic view for the global economy. In fact, the Omicron variant could act as a vaccine, especially in EMs that typically have low vaccination rates, and so further promulgate a more coordinated global economic rebound. This is our current assumption.
Just as there were many surprises during the global easy monetary phase, we trust that there will be many surprises that will typify the tightening cycle. Nevertheless, we continue to assume inflation levels elevated above consensus expectations and accompanied by above-consensus global economic growth rates. Although there are many recent indications of supply chains easing, we look for irregular improvements in that area. Our current view is that we will be able to make a better assessment of supply chains and bottlenecks at mid-year.
Our perspective at present is that global growth as reflected by PMI levels will be sufficiently robust so that an equity rebound should be anticipated at some point. In such an environment, we suppose a favorable risk-reward profile for Value/Cyclical types of stocks, as well as for international equities and commodities. To withstand the current vagaries of financial markets, many long-term investors should consider a more diversified portfolio which could include high quality big-cap Growth stocks.
Source: Citi, Global Commodities: What happens to metals when rates rise? And we dive into why ex-China aluminium deficits loom large in 2022 (1/19/2022)


Appendix
All as of 1/20/22 close
S&P 500 — down 1.10% on the day to close at 4,482.71
YTD — lower by 5.95%, from high reached on 1/3/22 — lower by 6.54%, from high to low reversal on 1/20/22 – 2.70%
Dow Jones Industrial Average – down 0.89% on the day to close at 34,715.39
YTD – lower by 4.47%, from high reached on 1/4/22 – lower by 5.66%, from high to low reversal on 1/20/22 – 2.31%
Nasdaq – down 1.30% on the day to close at 14,154.02
YTD – lower by 9.53%, from high reached on 11/19/21 – lower by 11.85%, from high to low reversal on 1/20/22 – 3.42%
Russell 2000 – down 1.88% on the day to close at 2,024.04
YTD — lower by 9.86%, from high reached on 11/8/21 – lower by 17.14%, from high to low reversal on 1/20/22 – 3.92
Definitions
S&P 500 Index– The S&P 500 Index, or the Standard & Poor’s 500 Index, is a market-capitalization-weighted index of the 500 largest publicly-traded companies in the U.S.
DJIA Index – The Dow Jones Industrial Average (DJIA) is a price-weighted index that tracks 30 large, publicly-owned companies trading on the New York Stock Exchange (NYSE) and the Nasdaq
NASDAQ – The Nasdaq Composite Index is the market capitalization-weighted index of over 2,500 common equities listed on the Nasdaq stock exchange.
Russell 2000 Index – The Russell 2000 Index is a small-cap stock market index that makes up the smallest 2,000 stocks in the Russell 3000 Index.
VIX Index – The Cboe Volatility Index (VIX) is a real-time index that represents the market’s expectations for the relative strength of near-term price changes of the S&P 500 index (SPX). Because it is derived from the prices of SPX index options with near-term expiration dates, it generates a 30-day forward projection of volatility.
MOVE Index – The Merrill Lynch Option Volatility Estimate (MOVE) Index is a well-recognized measure of U.S. interest rate volatility that tracks the movement in U.S. Treasury yield volatility implied by current prices of one-month over-the-counter options on 2-year, 5-year, 10-year and 30-year Treasuries.
Developed Market Economy (DM) – A developed economy is typically characteristic of a developed country with a relatively high level of economic growth and security. Standard criteria for evaluating a country’s level of development are income per capita or per capita gross domestic product, the level of industrialization, the general standard of living, and the amount of technological infrastructure.
Emerging Market Economy (EM) – An emerging market economy is the economy of a developing nation that is becoming more engaged with global markets as it grows. Countries classified as emerging market economies are those with some, but not all, of the characteristics of a developed market.
The Purchasing Managers’ Index (PMI) – The Purchasing Managers’ Index (PMI) is an index of the prevailing direction of economic trends in the manufacturing and service sectors. It consists of a diffusion index that summarizes whether market conditions, as viewed by purchasing managers, are expanding, staying the same, or contracting. The purpose of the PMI is to provide information about current and future business conditions to company decision makers, analysts, and investors.
Average Hourly Earnings – The average amount employees make per hour in the United States in a given month. It is calculated by the Bureau of Labor Statistics each month
Labor Force Participation Rate – The labor force participation rate is the percentage of the civilian noninstitutional population 16 years and older that is working or actively looking for work. It is measured by the Bureau of Labor Statistics and is an important labor market measure because it represents the relative amount of labor resources available for the production of goods and services.
IMPORTANT DISCLOSURES
The views and opinions included in these materials belong to their author and do not necessarily reflect the views and opinions of NewEdge Capital Group, LLC.
This information is general in nature and has been prepared solely for informational and educational purposes and does not constitute an offer or a recommendation to buy or sell any particular security or to adopt any specific investment strategy.
NewEdge and its affiliates do not render advice on legal, tax and/or tax accounting matters. You should consult your personal tax and/or legal advisor to learn about any potential tax or other implications that may result from acting on a particular recommendation.
The trademarks and service marks contained herein are the property of their respective owners. Unless otherwise specifically indicated, all information with respect to any third party not affiliated with NewEdge has been provided by, and is the sole responsibility of, such third party and has not been independently verified by NewEdge, its affiliates or any other independent third party. No representation is given with respect to its accuracy or completeness, and such information and opinions may change without notice.
Investing involves risk, including possible loss of principal. Past performance is no guarantee of future results.
Any forward-looking statements or forecasts are based on assumptions and actual results are expected to vary from any such statements or forecasts. No assurance can be given that investment objectives or target returns will be achieved. Future returns may be higher or lower than the estimates presented herein.
An investment cannot be made directly in an index. Indices are unmanaged and have no fees or expenses. You can obtain information about many indices online at a variety of sources including: https://www.sec.gov/fast-answers/answersindiceshtm.html or http://www.nasdaq.com/reference/index-descriptions.aspx.
All data is subject to change without notice.
© 2024 NewEdge Capital Group, LLC


