

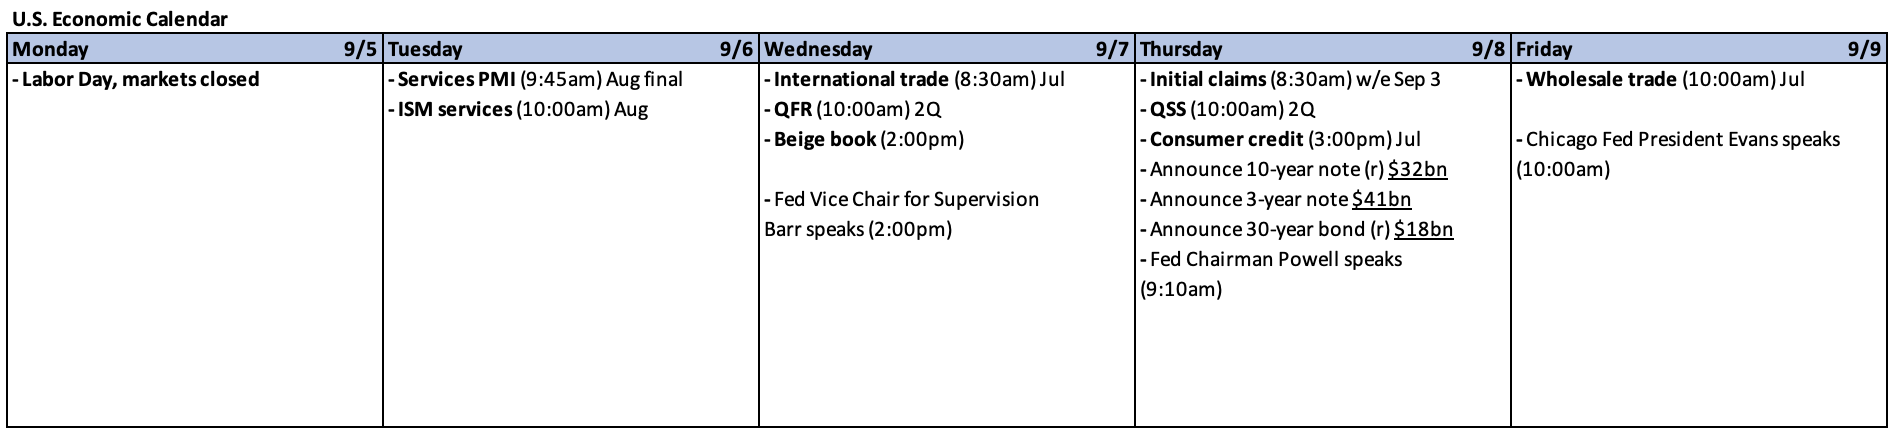
Weekly Summary: August 29 – September 2, 2022
Key Observations:
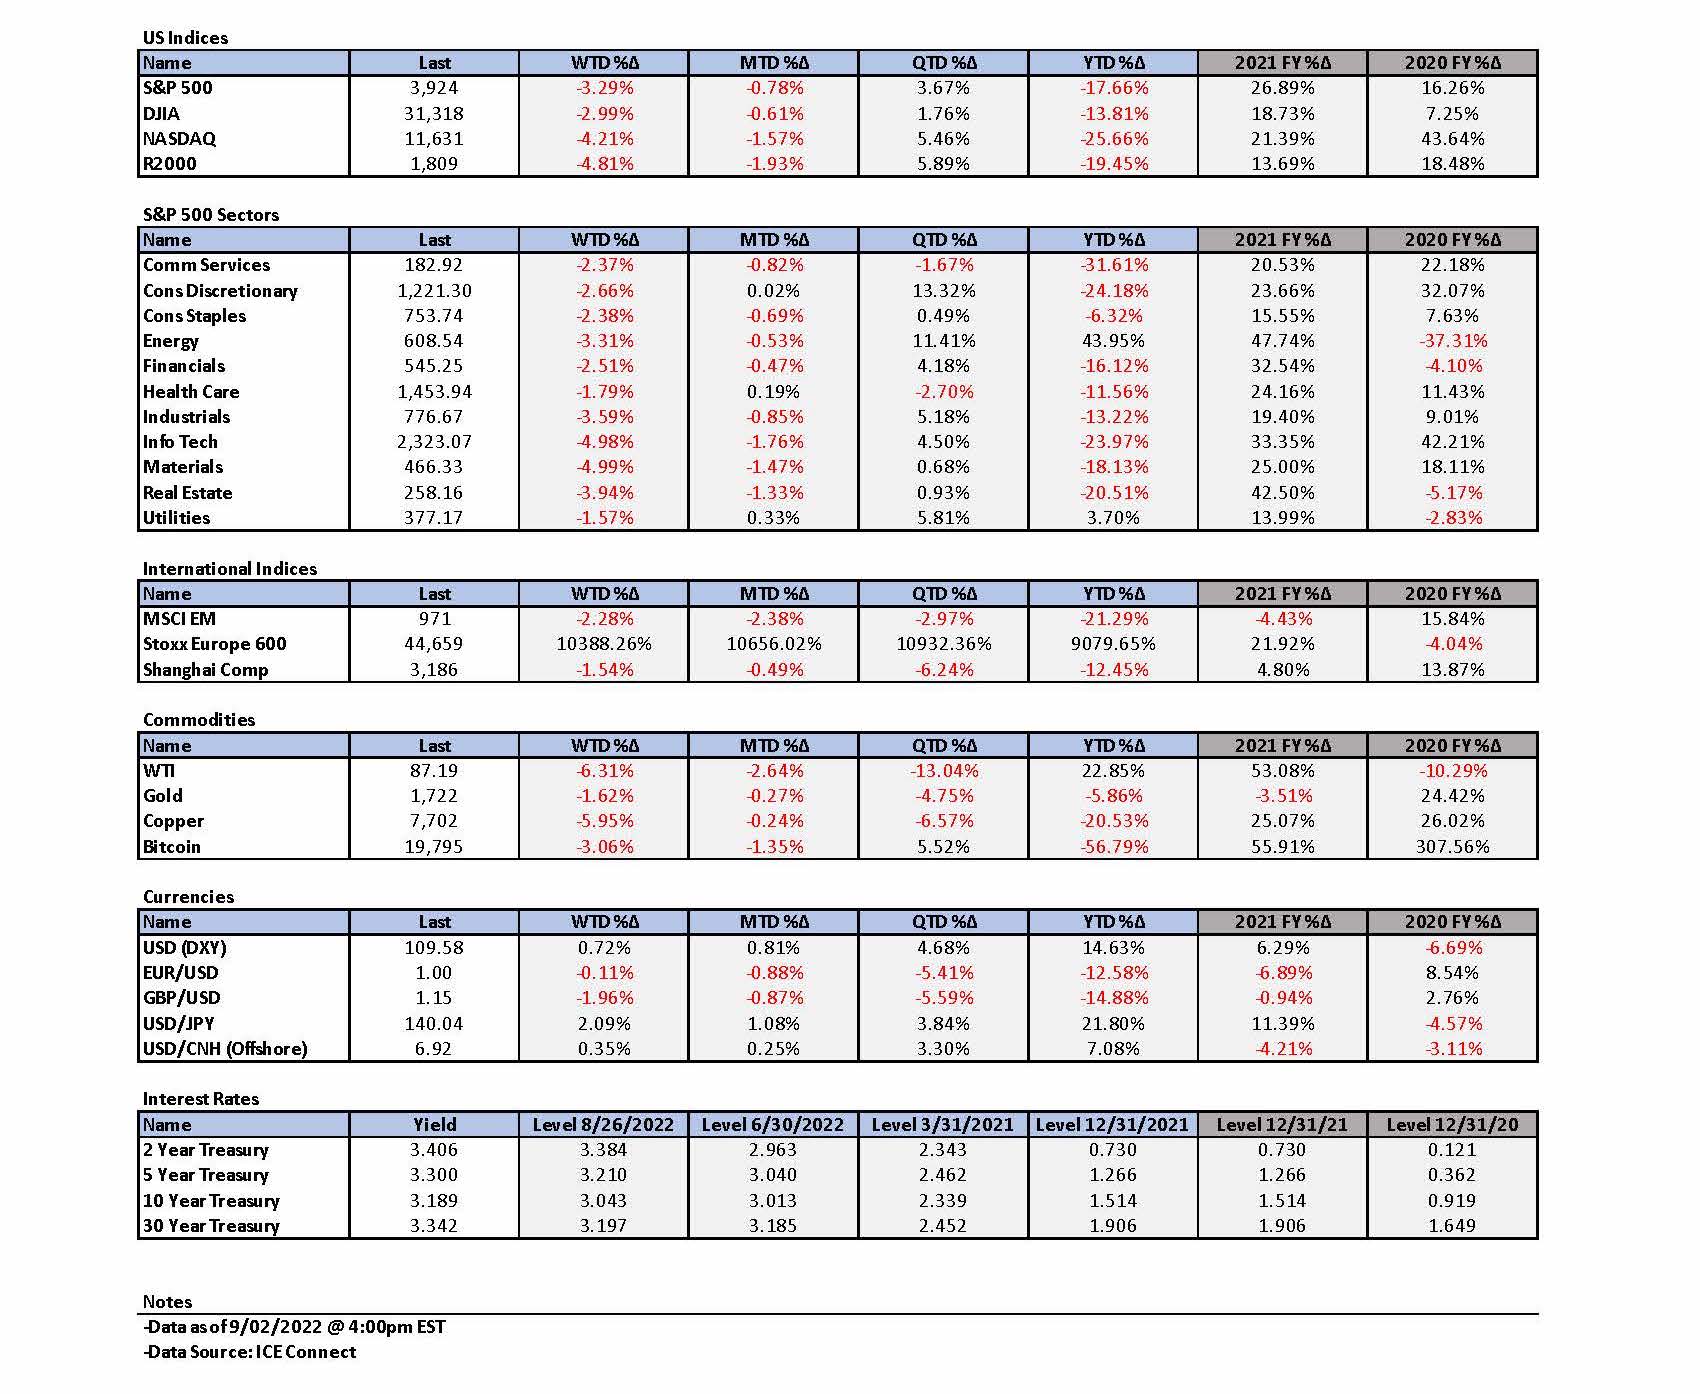
- The August Bureau of Labor Statistics (BLS) establishment measure of U.S. nonfarm employment was announced on Friday. It rose by a slightly better than expected 315,000 additional jobs. But the average hourly earnings rose by a less than expected 0.3% month-over-month rate, and the labor force participation rate rose 0.3% to 62.4%. An increase in the participation rate is an indication that the labor market might be beginning to be “less tight.” Although encouraging, this is still 1% below the February 2020 pre-pandemic level of 63.4%. The unemployment rate unexpectedly rose to 3.7% from July’s level of 3.5% — yet another sign of a loosening labor market.
- We, along with the financial markets, interpreted the overall U.S. August employment data as perhaps providing the Federal Reserve (Fed) a path of a slightly less aggressive trajectory of federal funds rate hikes. Both the 2-year and 10-year Treasury yields dropped, but the 2-year yield dropped more than the 10-year yield. Although still inverted, the 2-10-year Treasury yield curve had steepened further to a lower 20 basis points (bps) level of inversion during the late morning of Friday. We interpret the steepening trend of the past few days as an indication that the Fed hikes will not diminish economic growth to the extent feared by many analysts. U.S. equities rose generally on the Friday payroll data and the U.S. dollar declined. We continue to expect a 50 bps September hike in the federal funds rate and at worst a “mild” U.S. recession.
- In our opinion, most of the economic data presented this week continues to point to weakening global and U.S. economies and to lessening inflationary pressures.
- This week was characterized by extreme volatility across many financial markets in reaction to the latest economic data and the market’s interpretation of what effect such data would have on Fed tightening policies. We anticipate continuing volatility. The pace of shrinking the Fed’s balance sheet will double in September to a total of $95 billion per month. This is generally referred to as quantitative tightening (QT). This should lessen liquidity in financial markets even further. This most likely could exacerbate market volatility.
The Upshot: Our general investment approach remains the same as depicted in last week’s commentary. We maintain our preference for big cap high quality stocks with good balance sheets, relatively stable cash flows and stable margins. This past week was an excellent illustration for the need of a well-diversified portfolio. Best and worst sectors seemed to change on an almost daily basis. We maintain our preference for high quality growth stocks along with selected energy stocks. This includes big cap tech stocks, financial and health care stocks. Our July 8 weekly commentary highlighted our preference for selected health care and biotech stocks. Our August 12 commentary focused on the attractiveness of bank stocks, provided we could avoid a severe recession. That week’s commentary also focused on the increasing unattractiveness of certain stocks on a risk/reward basis at elevated stock prices at that time. Since that time, we have become more convinced that if the U.S. enters into a recession in the next twelve months, that it will most likely be only a mild recession. Although we anticipate credit markets to weaken somewhat over the next year, we believe that selected bank stocks are still attractively priced on a risk/reward basis. We continue to view selected big cap tech stocks along with energy stocks as an attractive hedge for one another.
While recognizing the Fed’s reluctance to rely on only one month’s economic data, we are also very cognizant of the volatility that might be caused by even one data point. This is why a longer-term perspective is important in this environment. We also recognize, however, that rapidity of change has become almost commonplace since the start of the pandemic.
We continue to foresee financial market volatility and we maintain our conviction that equities should only be purchased on market downturns. We surmise that selective stock picking will continue to play a critical role in outperformance. We accept that low liquidity and one-sided positioning will continue to play a significant role in financial markets as these factors probably will exacerbate market volatility. Seasonal factors may also play a role in market volatility. Historically, September is the worst performing month of the year in this century. September and October typically also have high levels of volatility. But the good news is that U.S. mid-term election years have a strong finish and that typically Q4’s are the strongest quarters of the year.
Recent Rise in Treasury Yields Through Powell’s Speech
As we highlighted in our August 12 weekly, we became convinced that interest rates were about to accelerate to the upside after their reaction on the days when CPI and PPI were announced during that week(CPI day and PPI day). On both days – but especially on PPI day – there was an upward interest rate reversal. Interest rates had been steadily declining since mid-June into that week. We have observed many financial markets that have reversed their most recent trend when they exhibited this type of volatility and reversal. The fact that it happened on two consecutive days, made it even more convincing. At that time, we also expressed our concern that on a risk-and-reward basis, many stock price levels were beginning to look unattractive. Our view is also that a rise in the 10-year Treasury yield is more detrimental to stock valuations than a rise in the two-year Treasury yield. That is true particularly in regard to growth stocks. On Monday of the week that ended August 12, the two-year yield closed at 3.31% and the 10-year yield at 2.77%. The closing yields for that week on August 12, were 3.25% and 2.84%, respectively. On both of these days, the two-year-to-10-year Treasury yield curve was inverted by more than 40 basis points (bps). An inversion occurs when the longer-duration bond yields less than the shorter-duration bond. From their August 12 closing yields until their closing yields on August 25, the two-year Treasury yield rose 10 bps to 3.35% and the 10-year yield 19 bps to 3.03%. Although still inverted, the two-year-to-10-year yield curve had steepened to a less-inverted level. August 25 was the day before Fed chair Powell’s Jackson Hole speech as discussed in last week’s commentary. After Powell’s speech the closing yields were virtually unchanged – the two-year yield rose two bps and the 10-year by only one bps. Evidently, the bond markets looked like they anticipated the Fed’s more “hawkish” stance. Instead, the impact of Powell’s speech was much more impactful on other financial markets – especially U.S. equities.
Fed’s “Soft” Pivot
Many equity market participants apparently were pricing in a Fed pivot – a cut in the federal funds rate early in 2023. We never subscribed to that view. Instead, we envisioned a “soft” Fed pivot where the Fed stops raising rates once they were in a restrictive range – or even somewhat above that range – and that the Fed would hold or pause at that level “for quite some time.” In fact, Powell did just that. We thought that given our views of slowing U.S. and global economic growth rates, as well as slowing U.S. inflation, would be sufficient to contain better the downside levels for U.S. equity levels. Moreover, under these assumptions, we anticipated that long-term investors might feel more “comfortable” in taking a longer-term perspective and concentrate more on stock selectivity as they would “ride out” the expected volatility.
Indications of Tight U.S. Labor Markets Propel Interest Rates Higher
One focal point of Powell’s speech was the extremely tight U.S. labor market. The almost one million more-than-expected job openings revealed on Tuesday in the Job Openings and Labor Turnover Survey (JOLTS) data, and the fewer-than-expected initial unemployment insurance claims revealed Thursday, propelled dramatic increases in interest rates – especially on Thursday. It seems that financial markets were interpreting these stronger-than-anticipated labor market indicators as a signal that the Fed will need to be more aggressive on its interest hike trajectories. We admit that the higher 10-year rate should put increasing pressure on U.S. equity valuations. However, although the yield curve is still inverted, we view a steepening of the curve as a positive sign that the Fed will not need to raise rates to such an extent that will not “overly diminish” economic growth. To the extent that the yield curve does not again become more inverted, we are encouraged that any recession which lies ahead for the U.S. will be relatively “mild”. Unfortunately, we continue to foresee volatile financial markets. As of September 1, the two-year Treasury yield closed at 3.516% (+0.66% for the day) and the 10-year Treasury yield closed at 3.267% (+0.135% for the day), which puts the inversion spread just under 25 bps. The jump in Treasury yields catapulted the U.S. Dollar Index (DXY) – a measure of USD relative to a basket of six currencies of significant U.S. trading partners – up 0.92% to a new multiyear high of 109.70.
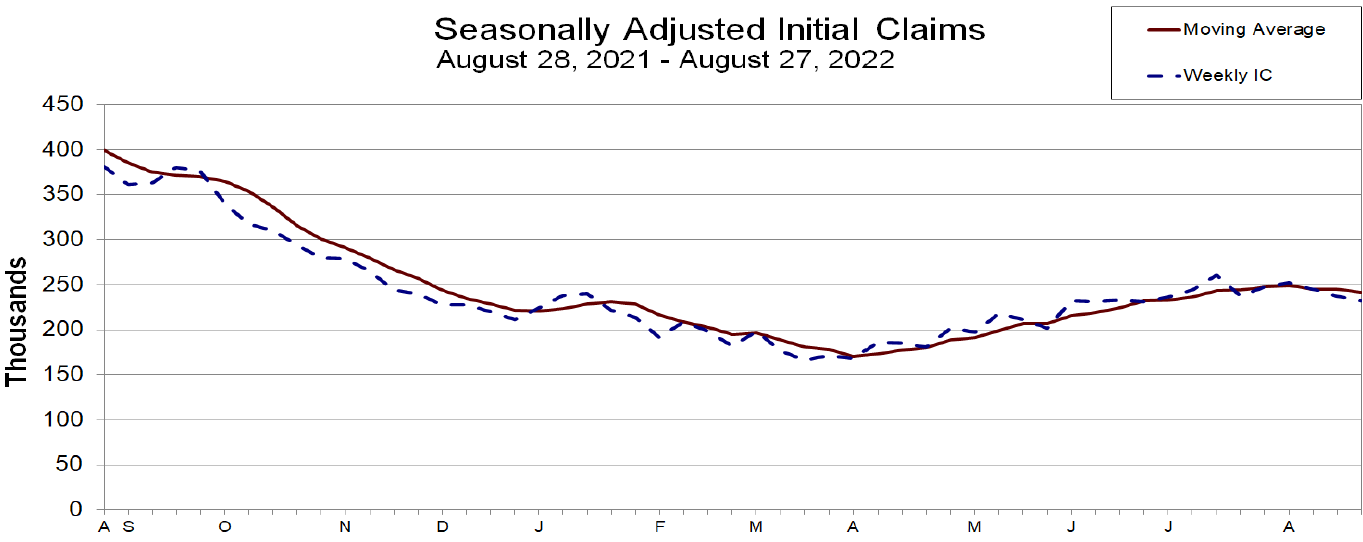
Source: United States Department of Labor, Unemployment Insurance Weekly Claims (9-1-2022)
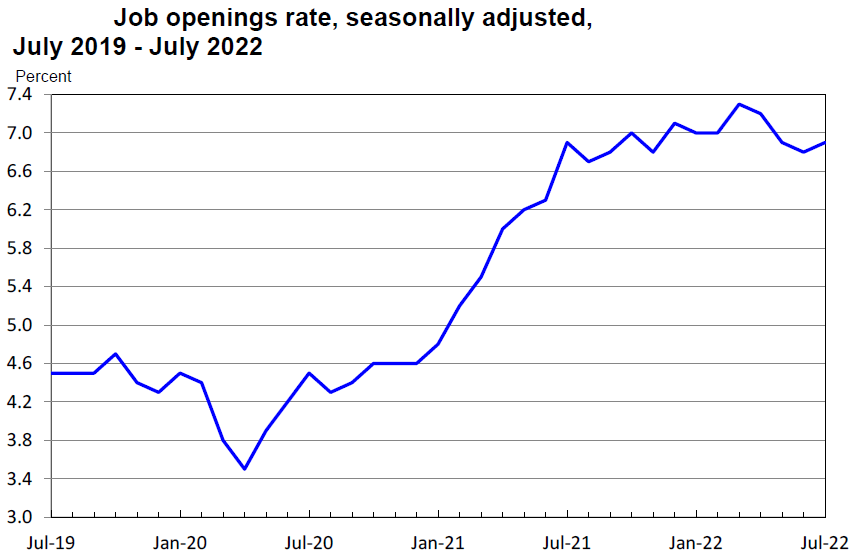
Source: United States Department of Labor, Job Openings and Labor Turnover (8-29-2022)
“Not the Same As It Was”
We have stressed repeatedly that since the pandemic began, and even more so after Russia’s invasion of Ukraine on February 24, we should not be surprised by the rapidity of constant and unexpected changes. In the beginning of the pandemic, many of us felt rather isolated. With its accompanying many lockdowns and mass testing, China’s continued zero-COVID-19 policy continues to place many of its citizens in that very unwelcome state. We are reminded of Harry Styles’ recent song ”As It Was” when we think of the world’s current and rapidly evolving state. “In this world, it’s just us; You know it’s not the same as it was.” At this juncture, we know “it’s not the same as it was,” but the issue is we don’t quite know what the world will be. We are all guessing, along with the Fed and many others, as to what the future has in store for all of us. Our base case, remains that we will be able to avoid a severe recession and at worst experience only a mild recession in the U.S.
Key Labor Market Related Data
In our opinion, the key financial market moving data was labor-market or jobs-related data. The two most relevant data points prior to the BLS nonfarm U.S. August payrolls report to be released on Friday were the JOLTS survey and the initial U.S. unemployment claims report. BLS reported the JOLTS data for July on Tuesday. The most significant number of this report was that U.S. job openings increased about 200,000 from the upwardly revised openings of 11.04 million in June to about 11.24 million. The original June job openings was estimated at 10.7 million. FacSet had estimated July openings at 10.3 million. The U.S. Department of Labor released the weekly unemployment insurance claims on Thursday. For the week ending August 27, the seasonally adjusted initial claims were an unexpectedly low 232,000. This was a decrease of 5,000 from the previous week’s figure, which was revised lower by 6,000 to 237,000. This latest week’s total was the lowest level of initial claims since late June. Both of these jobs-related data points indicated a tightening labor market, which is hardly what the Fed was seeking.
ISM August Manufacturing PMI
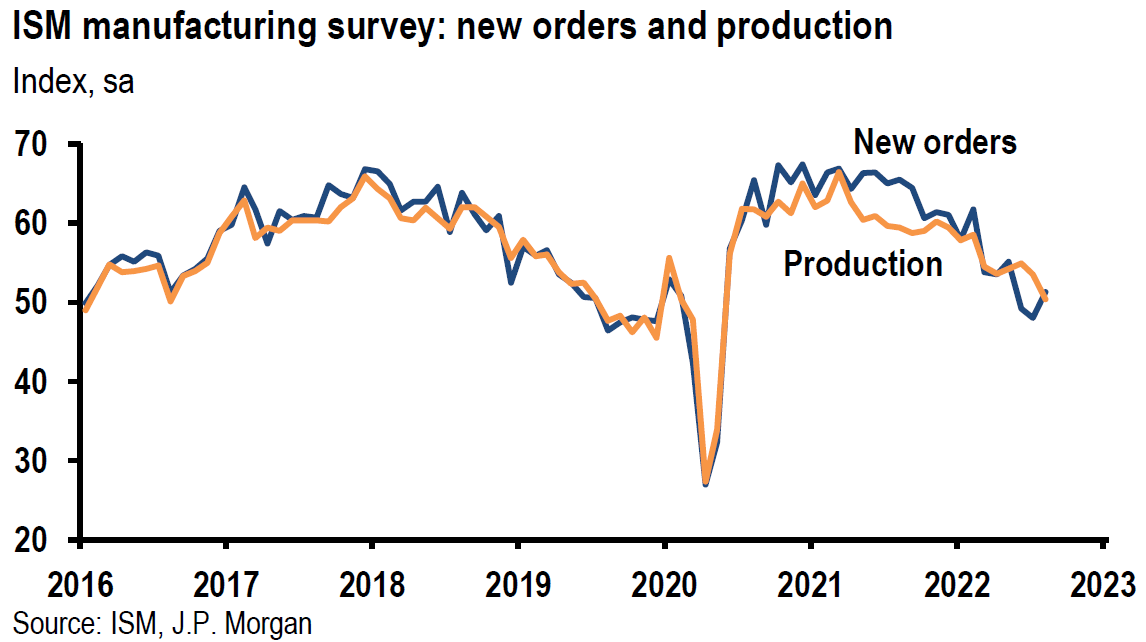
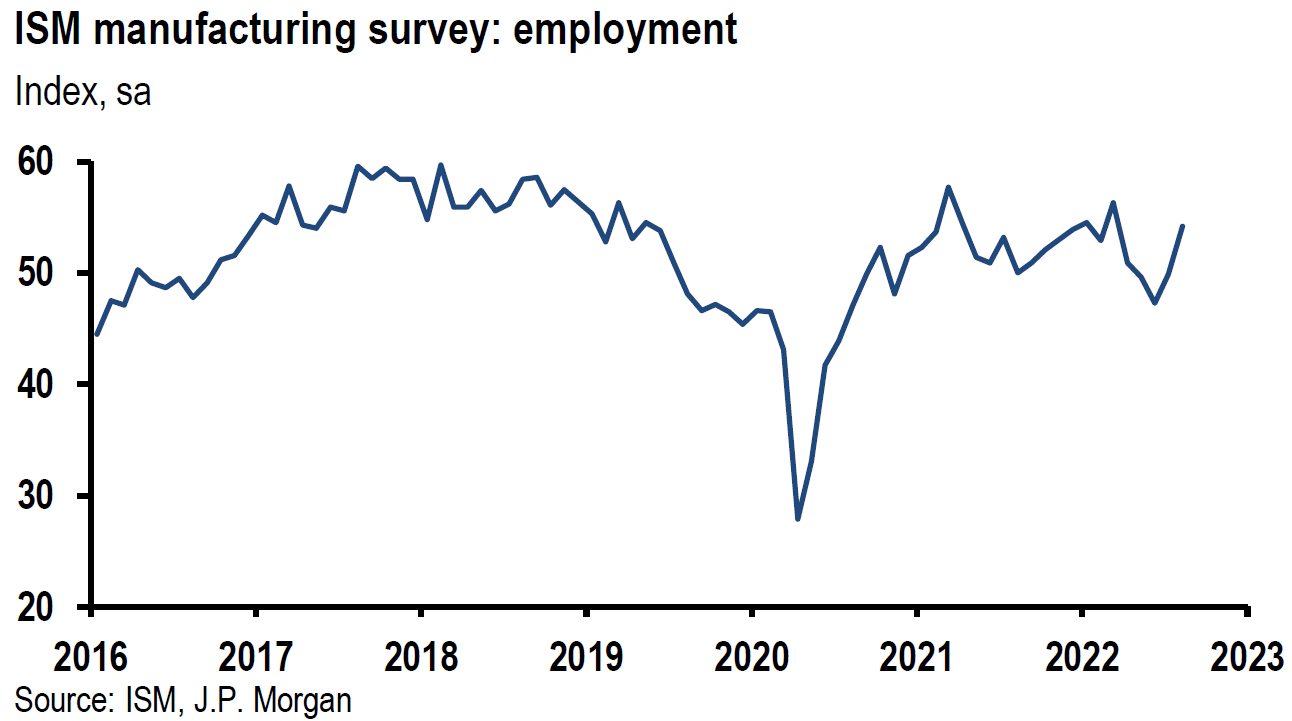
The S&P Global’s U.S. manufacturing Purchasing Managers’ Index (PMI) and Institute of Supply Management’s (ISM) manufacturing PMI for August were both announced on Thursday as well. They both generally depicted a slowing but still expanding U.S. economy. The ISM’s manufacturing headline was unchanged from July at a higher-than-expected 52.8 in August. This headline measure reflected the slowest factory growth since June 2020. The average over the past three months was 52.9, down from an average 56.2 for the three-month period prior to that and still lower versus an average 57.8 for Q1 2022. The weakening trend appeared to remain intact. The underlying components of this August report were considered generally to be mixed. The production measure continued lower (-3.1 points to 50.4), while the new orders index (+3.3 points to 51.3) and the employment index (+4.3 points to 54.2) rose from contractionary July levels. The prices paid index fell 7.5 points to 52.5, which was its lowest level since June 2020. The decline in prices paid was most likely a reflection of declining energy prices. We expect further weakness in ISM manufacturing PMI readings in the months ahead.
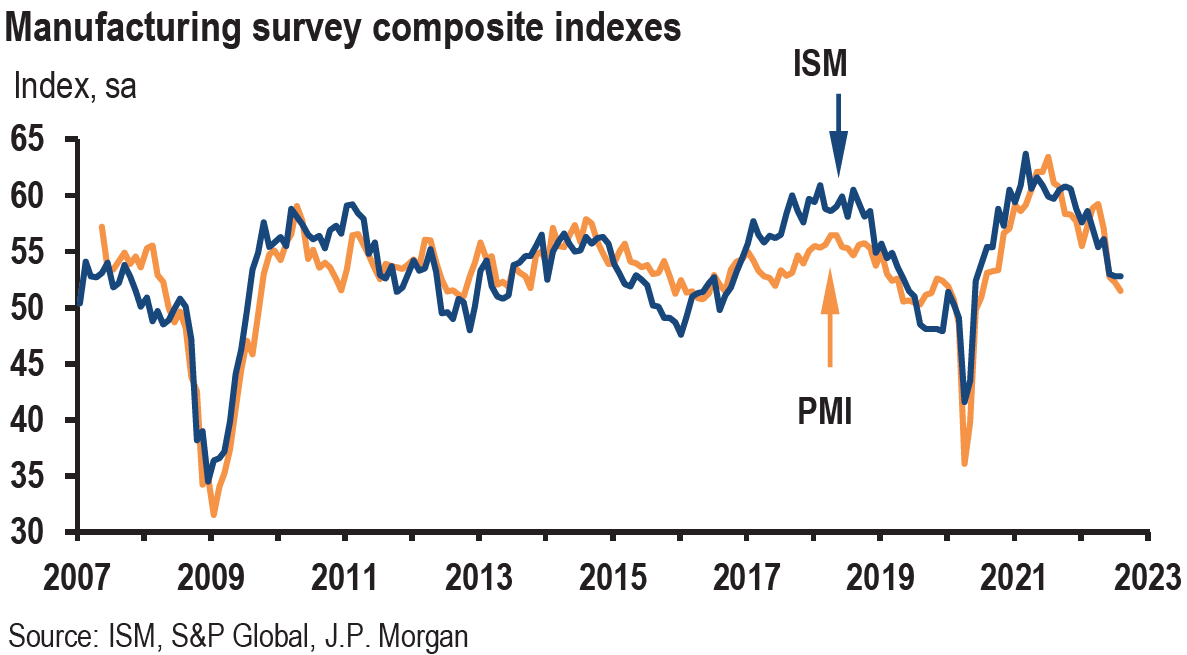
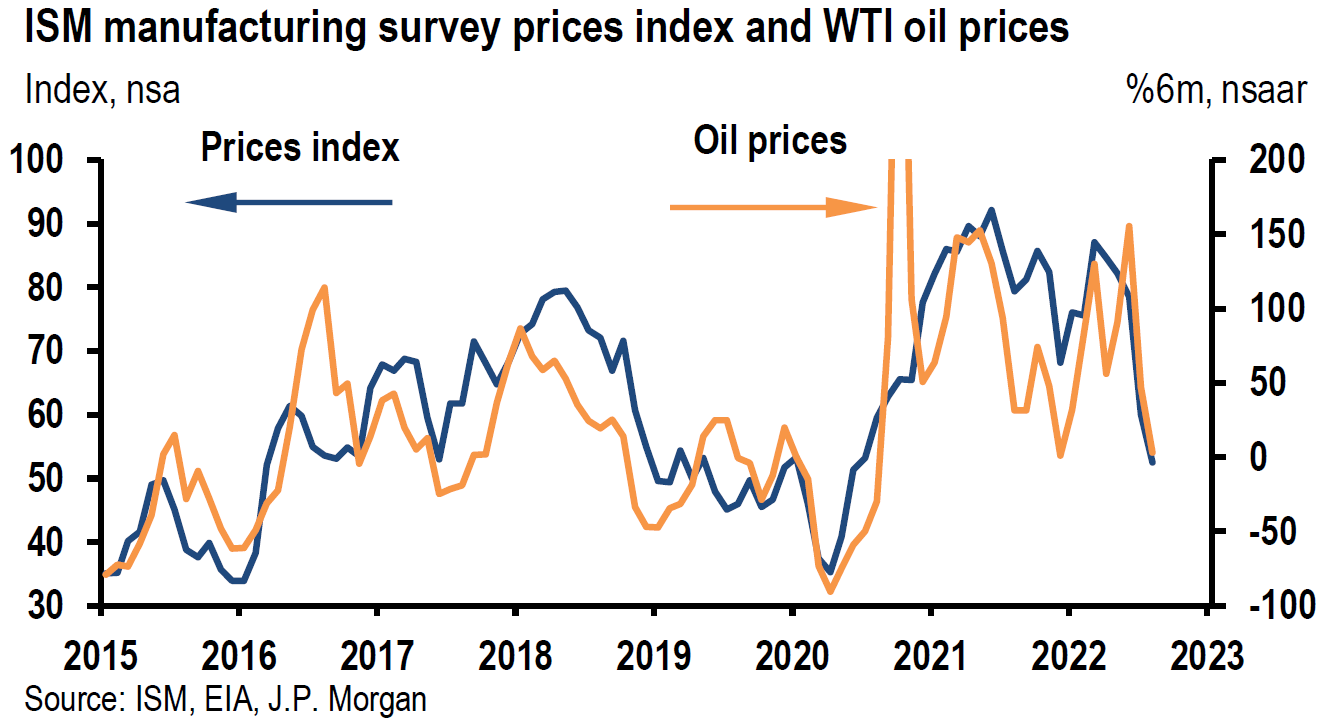
Source: JP Morgan, US: ISM manufacturing survey holds steady in August (9-1-2022)
S&P Global U.S. August Manufacturing PMI
Similarly, S&P Global U.S. manufacturing PMI dropped from its 52.2 July level to 51.5 in August. This was its lowest level since July 2020. Input costs also slowed to their slowest pace of increases since January 2021. The pace of inflation for prices received was the slowest in 18 months, “as some companies passed through savings to their customers in an effort to remain competitive.” As reflected by delivery delays being the least extensive since October 2020, supply chain constraints eased. We would characterize some of the underlying components of this survey as somewhat weaker than the ISM survey. Output contracted for the second consecutive month, while new orders fell for the third straight month. New export orders fell at the second sharpest pace in 27 months. Employment rose at the second slowest rate in over two years. Although output expectations reached a three-month high, they remained below the series average.
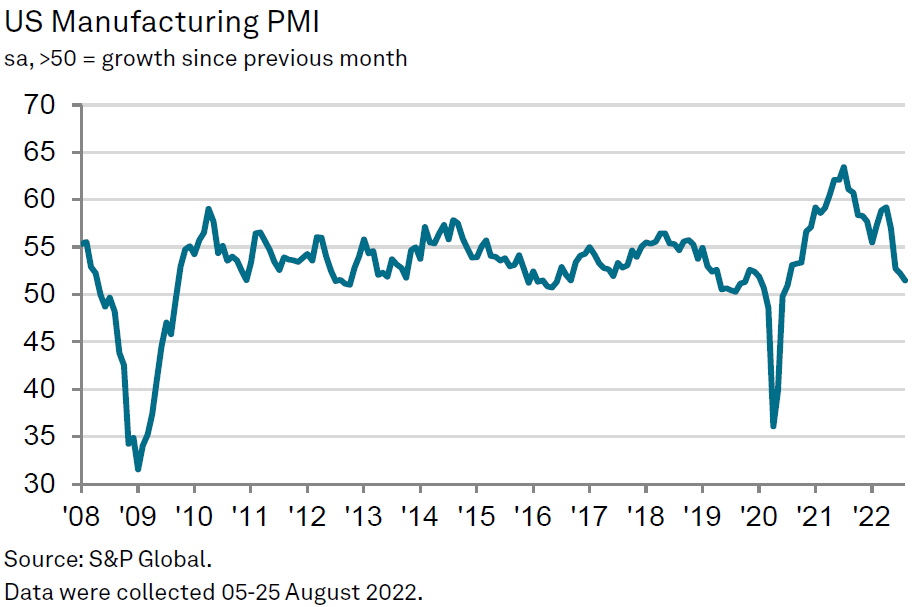
Source: S&P Global, S&P Global US Manufacturing PMI (9-1-2022)
Eurozone August Manufacturing PMIs
S&P Global Manufacturing PMIs continued to contract for the second consecutive month in August with a headline reading of 49.6, which was a 26-month low and slightly beneath July’s 49.8 level. The Eurozone manufacturing output index remained at a low level of 46.5 – only slightly better than July’s 46.3 reading but contracting for a third consecutive month. New orders declined sharply again. Pricing pressures continued to diminish as input prices gained at their slowest pace in 19 months and prices charged increased at the slowest pace in 16 months. New export sales fell at the fastest pace since June 2020. The strain on suppliers continued to ease along with falling input demand. This is what the Fed hopes to achieve – slower demand due to tightening monetary policies.
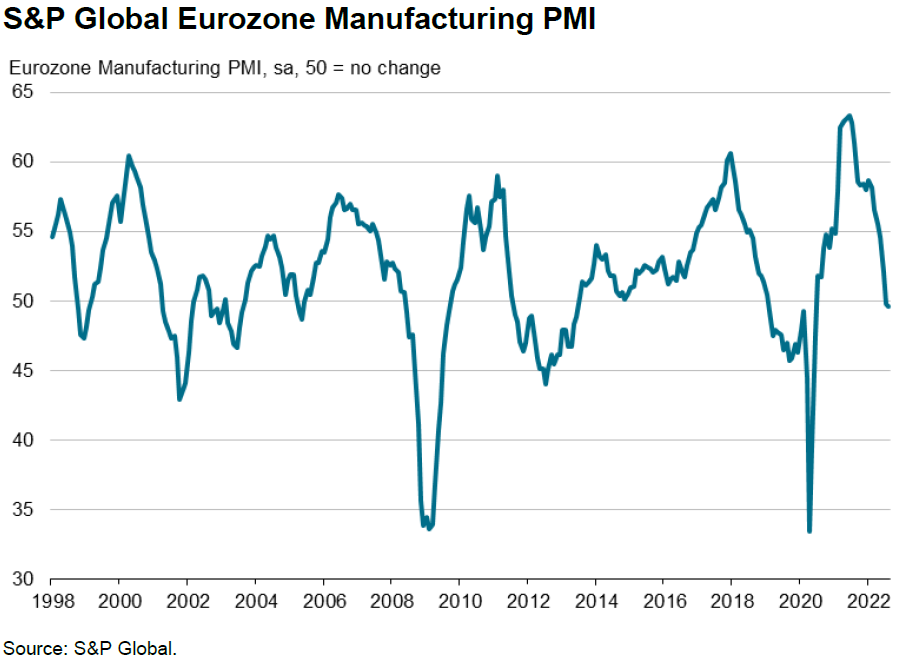
Source: S&P Global, S&P Global Eurozone Manufacturing PMI (9-1-2022)
Housing Market Continues to Weaken
The Case-Shiller and the Federal Housing Finance Agency (FHFA) single family home price indexes for June were released this week. Taken together, these two indexes showed a rather sharp deceleration of home price appreciation in June. The June appreciation rates showed the slowest pace in two years on a month-to-month (m/m) basis. The Case-Shiller 20-city home price index increased 0.4% m/m versus a median expectation of a 0.9% gain compared to a revised gain of 1.2% in May. The June year-over-year (y/y) increase was 18.6%, which was a 1.9 points lower gain than the May y/y increase. The FHFA price appreciation was even lower. This m/m increase was only 0.1% versus a median forecast of +0.8%, and compared to revised gain of 1.3% m/m in May. The June y/y gain was 16.2%, which is 2.1 points less than the May y/y price increase.
According to CNBC on Wednesday, U.S. mortgage demand continued to fall last week. Mortgage applications to purchase a home were 2% lower than the prior week and 23% lower y/y. The average 30-year fixed rate mortgage was 5.80% last week versus 5.65% the previous week. These rates were back to their highest levels since mid-July, and were much higher than the 3.11% levels from one year ago. Purchase applications have now decreased in eight of the past nine weeks. CNBC also reported that home prices declined 0.77% in July m/m. This was the first monthly decline in nearly three years and the largest monthly decline since January 2011. The Fed’s tightening monetary policies were clearly impacting the U.S. housing market through financial conditions tightening from higher mortgage rates.
Consumer Confidence
The Conference Board’s Consumer Confidence Index for August jumped by a larger-than-expected 7.9 points to 103.2. This followed three consecutive months of lower readings. Although much improved, this level was still significantly lower than pre-pandemic levels, and was down from levels seen earlier in the pandemic. The Present Situations index increased to 145.4 versus July’s level of 139.7, which was the first monthly increase since March. The expectations index improved to 75.1 from July’s nine-year-low of 65.6. The Conference Board regarded a reading below 80 in expectations as a suggestion that recession risks continued. The Board’s report stated that “concerns about inflation continued their retreat but remained elevated.” The Conference Board’s confidence index is considered generally to be more closely aligned with U.S. labor market conditions when compared to the University of Michigan’s consumer sentiment readings. The latter’s recent improvement in consumer sentiment has been closely aligned to the drop in gasoline prices.
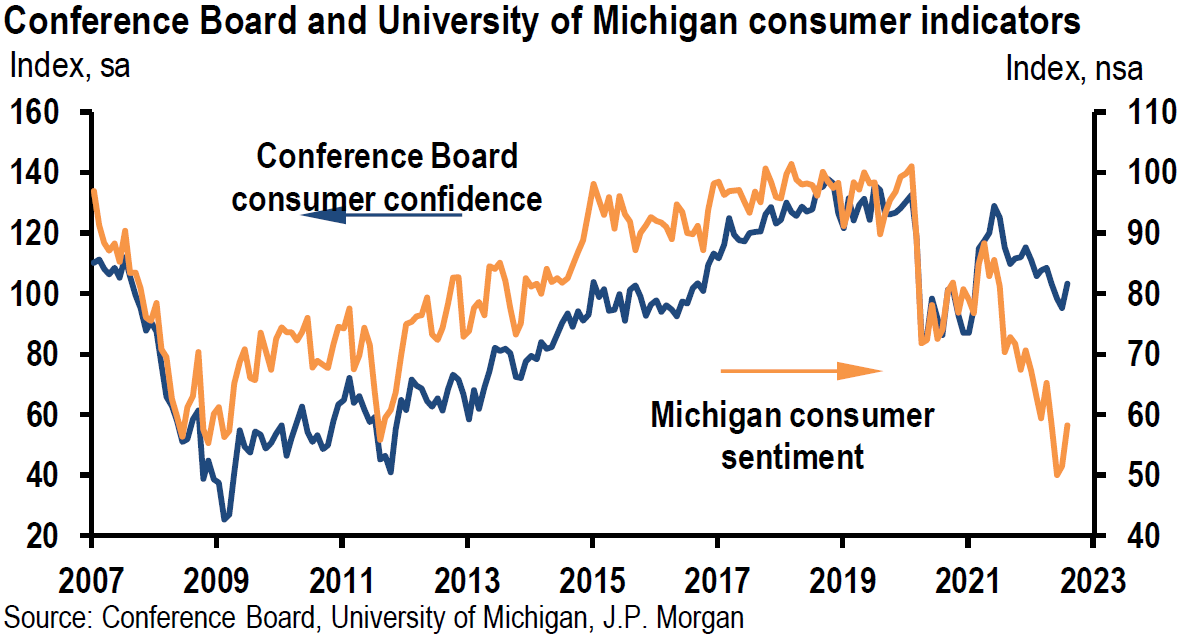
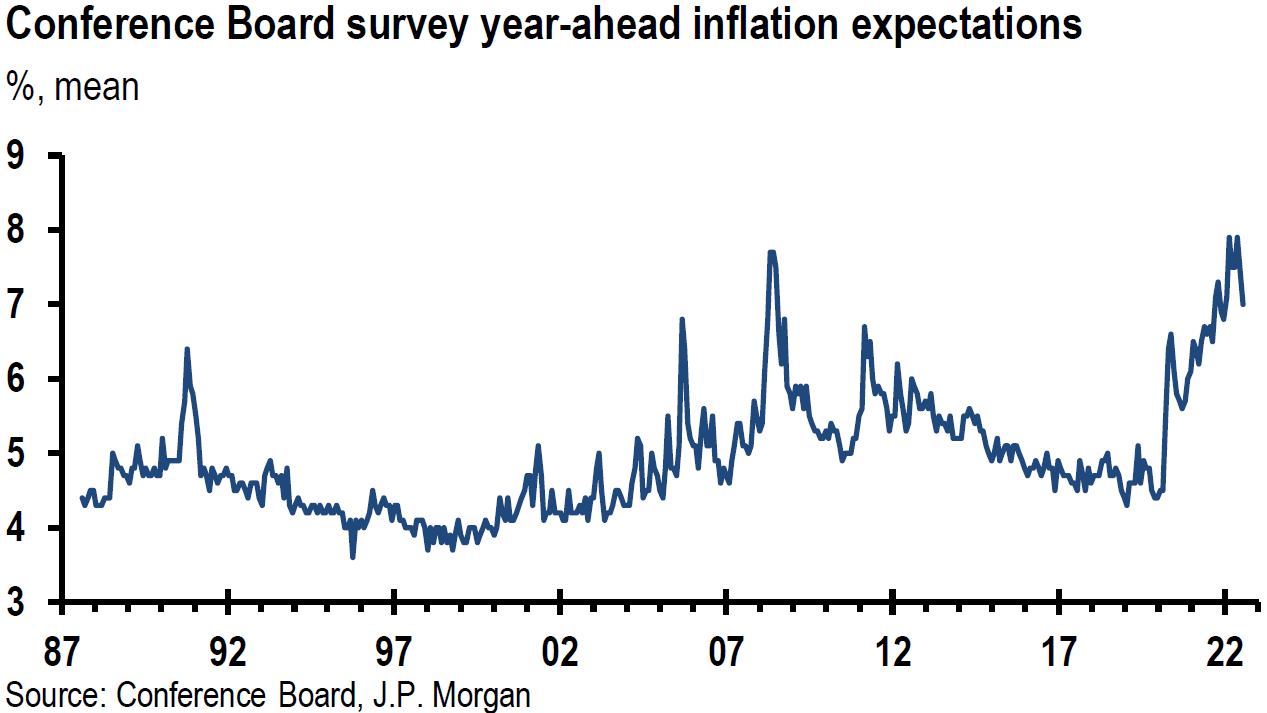
Source: JP Morgan, US: Consumer confidence picks up in August (8-30-2022)
Dallas Fed Surveys
Both the Texas manufacturing and services surveys of the Federal Reserve Bank of Dallas showed slowing rates of economic activity. New orders in the manufacturing survey were in negative territory for the third straight month, suggesting demand continued to decrease. Perceptions of broader business conditions continued to worsen. The company outlook index was negative for the sixth time. The outlook uncertainty declined but remained elevated. Employment growth was indicated as “robust” – not what the Fed wants to see – but was slightly lower. Price pressures continued to moderate even as they continued to rise along with wages.
The Texas services sector growth rate weakened in August as both the employment and hours worked index weakened. The hours worked index fell from 5.0 to 3.1, which was the lowest reading since early 2021. Perceptions of broader business conditions remained negative in August, but less so than in July. Input and prices received continued to moderate, along with wage increases moderating.
Geopolitical Risks
As of Wednesday, Russia’s state controlled Gazprom halted once again natural gas flows into Germany through the Nord Stream 1 pipeline for necessary “maintenance.” Gas flow was scheduled to flow once more after three days “provided that no malfunctions have been identified.” The flow of natural gas was to resume at the reduced rate of 20% of the pipeline’s capacity – the same level as in late July. Germany’s gas storage reportedly reached 83% of its capacity and it appeared likely that it could meet its stated goal of 90% storage capacity by November 1. On Tuesday, a large French utility was informed by Gazprom that natural gas supplies would be halted due to a contract dispute. But European natural gas prices mostly declined this week due to the better-than-expected gas storage levels achieved by Germany.
The southwestern Chinese city of Chengdu and its 21.2 million residents were “locked down” indefinitely on Thursday pursuant to China’s zero COVID-19 policy after 700 cases were discovered. This city has many manufacturing facilities and accounts for roughly 1.7% of China’s GDP. Once again, questions arise as to the supply chain effects of this lockdown.
According to Reuters on September 1, the U.S. government has imposed new restrictions preventing both Nvidia Corp (NVDA) and Advanced Micro Devices, Inc. (AMD) from selling certain computing chips for artificial intelligence (AI) that the U.S. government believes could be useful for China’s military. NVDA estimated that this could reduce revenues for the current quarter by $400 million. AMD thought these new restrictions would not be material. It is thought that these chips could be used to build modules that could be “useful for militaries in modeling bomb simulations and designing weapons.” NVDA planned to apply for licenses that would allow the sale of these chips to resume. Some have viewed this action as “an escalation of the U.S. crackdown on Beijing’s technological prowess.”
Taiwan will most likely remain an area of controversy between the U.S., and China for the foreseeable future.
According to an Associated Press story during late morning on Friday, September 2, a senior Russian diplomat “sternly” warned the U.S. “against supplying long-range weapons to Ukraine, noting that the U.S. is balancing on the edge of direct involvement in the conflict.” Deputy Minister Sergei Ryabkov then “pointed out that Russia’s military doctrine stipulates that it could use nuclear weapons in case of aggression against Russia and its allies involving mass destruction weapons, or an aggression involving conventional weapons that threatens the very existence of the Russian state.”
Fed-Speak
In an effort to reinforce Powell’s Jackson Hole speech, many Fed officials reiterated Powell’s hawkish rhetoric to ensure that financial conditions continue to tighten. We expect similar rhetoric to continue for “quite some time.” Among the Fed speakers this week was Cleveland Fed president Loretta Mester. She saw the federal funds rate rising above 4% early in 2023 and for the Fed to then hold that level “for some time.” She saw no rate cuts at least through 2023. Financial markets appear currently to be pricing in a 1-in-3 chance of the federal funds rate climbing above 4% next year. We agree with this low probability for 2023. Mester expects inflation to fall to a range of 5%-6% this year and closer to the Fed’s 2% target in subsequent years. New York Fed president John Williams echoed these views as well this week. He indicated that he expects higher interest rates and that they would remain at restrictive levels for “some time,” repeating Powell’s phrase from last week’s speech. “We need to have somewhat restrictive policy to slow demand, and we’re not there yet.” To the extent that Fed-speak can tighten financial conditions further, it could help lessen inflationary pressures so that the Fed might be less aggressive in its monetary tightening policies.
Bottom Line
For the time being, we are maintaining our basic investment approach as expressed in last week’s commentary. We will continue to favor high quality big-cap stocks that offer good balance sheets, as well as relatively stable cash flows and profit margins. For long-term investors who are prepared to tolerate volatility, we still maintain a preference for selected high quality big-cap growth stocks along with energy stocks in a well-diversified portfolio. Again, we would only add to positions on downturns. We assume continued volatility across virtually all financial markets. Much of this volatility seems to originate from the extreme volatility in fixed income markets. Many uncertainties remain. We continue to forecast rapid changes in economic trends, many of which could be “surprising.”
We foresee that the continuing weakening trends in the U.S. and global economies should reduce demand sufficiently so that inflation would be lowered. Tightening financial conditions are already having deleterious effects on economic growth. This is particularly true for interest rate sensitive sectors, such as the housing sector. The lag effects of tighter monetary policies can be unpredictable in terms of timing and magnitude. We believe that the Fed should show “patience” before assessing the effects of its policies. We have been waiting patiently for downward revisions in earnings and profit margin estimates. Although we have seen some downward revisions, we assume that more are coming.
Russia’s thinly veiled threat late Friday morning of using nuclear weapons under certain circumstances, perhaps is what sent U.S. equities lower and caused a USD rebound. There are many potential geopolitical risks currently. Unfortunately, it is rather difficult to construct an investment portfolio that might account for all possibilities. Diversification seems to be the most viable approach.
Definitions
Labor Force Participation Rate – The labor force participation rate is an estimate of an economy’s active workforce. The formula is the number of people ages 16 and older who are employed or actively seeking employment, divided by the total non-institutionalized, civilian working-age population.
Flattening Yield Curve – The flat yield curve is a yield curve in which there is little difference between short-term and long-term rates for bonds of the same credit quality. This type of yield curve flattening is often seen during transitions between normal and inverted curves.
Inverted Yield Curve – An inverted yield curve describes the unusual drop of yields on longer-term debt below yields on short-term debt of the same credit quality. Sometimes referred to as a negative yield curve, the inverted curve has proven in the past to be a relatively reliable lead indicator of a recession.
Steeper Yield Curve – If the yield curve steepens, this means that the spread between long- and short-term interest rates widens. It typically indicates stronger economic activity and rising inflation expectations, and thus, higher interest rates. When the yield curve is steep, banks are able to borrow money at lower interest rates and lend at higher interest rates.
U.S. Dollar Index (DXY) – The U.S. dollar index is a measure of the value of the U.S. dollar relative to a basket of foreign currencies.
Basis Points (bps) – A basis point is one hundredth of one percent, used chiefly in expressing differences of interest rates.
Federal Funds Rate – The term federal funds rate refers to the target interest rate set by the Federal Open Market Committee. This target is the rate at which commercial banks borrow and lend their excess reserves to each other overnight.
Fed Funds Terminal Rate – The terminal rate is defined as the peak spot where the benchmark interest rate, the federal funds rate, will come to rest before the central bank begins trimming it back.
Quantitative Tightening (QT) – Quantitative tightening refers to monetary policies that contract, or reduce, the Federal Reserve System’s balance sheet.
Growth Stock – A growth stock is any share in a company that is anticipated to grow at a rate significantly above the average growth for the market. These companies generally do not pay dividends, instead growth stocks tend to reinvest any earnings they accrue in order to accelerate growth in the short term.
Headline Consumer Price Index (Headline CPI) – Headline inflation is the raw inflation figure reported through the Consumer Price Index (CPI) that is released monthly by the Bureau of Labor Statistics (BLS). The CPI calculates the cost to purchase a fixed basket of goods to determine how much inflation is occurring in the broad economy. The CPI uses a base year and indexes the current year’s prices, according to the base year’s values.
Core Consumer Price Index (Core CPI) – Core inflation removes the CPI components that can exhibit large amounts of volatility from month to month, which can cause unwanted distortion to the headline figure. The most commonly removed factors are those relating to the costs of food and energy. Food prices can be affected by factors outside of those attributed to the economy, such as environmental shifts that cause issues in the growth of crops. Energy costs, such as oil production, can be affected by forces outside of traditional supply and demand, such as political dissent.
Producer Price Index (PPI) – The producer price index (PPI), published by the Bureau of Labor Statistics (BLS), is a group of indexes that calculates and represents the average movement in selling prices from domestic production over time. It is a measure of inflation based on input costs to producers.
Job Openings and Labor Turnover Survey (JOLTS) – The job openings and labor turnover survey are a monthly report by the Bureau of Labor Statistics (BLS) of the U.S. Department of Labor counting job vacancies and separations, including the number of workers voluntarily quitting employment.
Initial Unemployment Insurance Claims – Initial claims are new jobless claims filed by U.S. workers seeking unemployment compensation, included in the unemployment insurance weekly claims report.
ISM Manufacturing Index (PMI) – The ISM manufacturing index, also known as the purchasing managers’ index (PMI), is a monthly indicator of U.S. economic activity based on a survey of purchasing managers at more than 300 manufacturing firms. It is considered to be a key indicator of the state of the U.S. economy.
Manufacturing Purchasing Managers’ Index PMI – A manufacturing Purchasing Managers’ Index (PMI) is a survey-based economic indicator designed to provide a timely insight into changing business conditions in the goods-producing sector.
Services Purchasing Managers’ Index PMI – A services Purchasing Managers’ Index (PMI) is a survey designed to better understand changing business conditions in the wider economy. Coverage includes financial services, consumer services and all other business services.
Composite Purchasing Managers’ Index PMI – A composite Purchasing Managers’ Index (PMI) is the weighted average of manufacturing and service sector PMIs for a given geography or economy.
Federal Housing Finance Agency (FHFA) – The FHFA was established by the Housing and Economic Recovery Act of 2008 (HERA) and is responsible for the effective supervision, regulation, and housing mission oversight of Fannie Mae, Freddie Mac (the Enterprises) and the Federal Home Loan Bank System, which includes the 11 Federal Home Loan Banks (FHLBanks) and the Office of Finance. Since 2008, FHFA has also served as conservator of Fannie Mae and Freddie Mac.
Case-Shiller Home Price Index – The S&P CoreLogic Case-Shiller U.S. National Home Price Index (“the U.S. national index”) measures the value of single-family housing within the United States. The index is a composite of single-family home price indices for the nine U.S. Census divisions and is calculated monthly.
IMPORTANT DISCLOSURES
The views and opinions included in these materials belong to their author and do not necessarily reflect the views and opinions of NewEdge Capital Group, LLC.
This information is general in nature and has been prepared solely for informational and educational purposes and does not constitute an offer or a recommendation to buy or sell any particular security or to adopt any specific investment strategy.
NewEdge and its affiliates do not render advice on legal, tax and/or tax accounting matters. You should consult your personal tax and/or legal advisor to learn about any potential tax or other implications that may result from acting on a particular recommendation.
The trademarks and service marks contained herein are the property of their respective owners. Unless otherwise specifically indicated, all information with respect to any third party not affiliated with NewEdge has been provided by, and is the sole responsibility of, such third party and has not been independently verified by NewEdge, its affiliates or any other independent third party. No representation is given with respect to its accuracy or completeness, and such information and opinions may change without notice.
Investing involves risk, including possible loss of principal. Past performance is no guarantee of future results.
Any forward-looking statements or forecasts are based on assumptions and actual results are expected to vary from any such statements or forecasts. No assurance can be given that investment objectives or target returns will be achieved. Future returns may be higher or lower than the estimates presented herein.
An investment cannot be made directly in an index. Indices are unmanaged and have no fees or expenses. You can obtain information about many indices online at a variety of sources including: https://www.sec.gov/fast-answers/answersindiceshtm.html or http://www.nasdaq.com/reference/index-descriptions.aspx.
All data is subject to change without notice.
© 2024 NewEdge Capital Group, LLC


