

Weekly Summary: September 12 – September 16, 2022
Key Observations:
- The higher-than-expected U.S. August Consumer Price Index (CPI) released on Tuesday has changed the narrative of many investors’ expectations in regard to the extent and timing of the Federal Reserve’s (Fed) tightening monetary policies. Most investors now anticipate higher hikes in the federal funds rate in the upcoming Fed meetings, with a higher terminal rate in the 4.2% – 4.3% range, compared to an earlier 3.75% – 4.0% range.
- The 2-10-year Treasury yield curve inversion has more than doubled from a roughly 21 basis points (bps) inversion (10 -year Treasury yield 21 bps less than the 2-year yield) to an inversion of over 40 bps that reached as high as at least 46 bps this week. We interpret this more inverted yield curve as a signal that the bond market has become more concerned that the Fed will hike rates by more than is “required” to rein in inflation and thereby perhaps cause a more severe U.S. economic downturn. We remain hopeful that the Fed will stop short of raising rates to an “excessive” level. We maintain our forecast of a roughly 4% level in the terminal funds rate as we believe that the Fed will see sufficient progress in inflation rates softening and a less tight labor market so that it could pause in raising rates and maintain whatever the restrictive rate is for “some time.”
- Apart from the latest CPI data, most of the economic data we examined this week continues to point to weaker U.S. economic growth rates and softening prices. Supply chain constraints also appear to be diminishing. Easing supply chain constraints should diminish inflation and raise economic growth. Consumer inflation expectations continue to be “well-anchored,” with the greatest uncertainty surrounding one-year-ahead expectations.
- After the close of trading on Thursday, FedEx Corporation (FDX) unexpectedly announced that due to macroeconomic trends that “significantly worsened” globally and in the U.S. later this quarter, they were withdrawing their full year earnings guidance, as well as reporting their fiscal first quarter earnings results that were well below expectations. FDX commented on the “speed” at which conditions shifted. FDX’s stock price dropped by over 22% after this announcement. We have been highlighting the rapidity of change ever since the pandemic began. Companies continue to be caught “flat-footed.” Severe inventory mismatches at both Target Corporation and Walmart Inc. were prior examples of companies falling short of understanding the rapidity of change in business conditions. We continue to anticipate more downward revisions in company earnings and margin estimates.
The Upshot: Our general investment approach remains the same as depicted in last week’s commentary. We maintain our preference for big cap high quality stocks with good balance sheets, relatively stable cash flows and stable margins. Continued volatility among sectors this week is supportive of a well-diversified portfolio for long-term investors. In the “Bottom Line” of last week’s commentary we stated that “we do expect volatility that might even be extreme at times.” A surprisingly strong CPI reading was all it took in the current environment to provide such extreme volatility. U.S. equities had rallied into the CPI announcement, the 2-10-year Treasury yield inversion had diminished and investors were optimistic of a rather benign CPI reading. Low liquidity and wrong-sided positioning also played a role as the narrative for many investors changed abruptly.
Many investors now appear to be convinced that the Fed will tighten monetary conditions to such an extent so as to cause a more severe economic U.S. downturn. Although we are also concerned about this possibility, we maintain our more sanguine view that the U.S. labor market will become less tight and that inflation will slow due to tighter financial conditions. We believe that the Fed will show enough patience to enable them to pause at close to a 4% federal funds rate and to maintain that restrictive level for some time. We expect the Fed to raise the federal funds rate by 75 bps at its meeting next week and by 50 bps at its November meeting. Depending on incoming economic data, we still think that a 25bps hike in December is still possible, but we would not be surprised to see a 50 bps December hike.
We anticipate a continuation of volatility across all financial markets. Even though there have been some downward revisions of earnings and margins of many stocks over the past couple of months, we envision more downward revisions that could put more downward pressure on stock prices. We maintain our conviction that equities should only be purchased on market downturns. We surmise that selective stock picking will continue to play a critical role in outperformance. As mentioned in last week’s commentary, seasonal factors may also play a role in market volatility. This week’s market volatility seems to be following the seasonal script.
Financial Conditions Tighten Further
The higher-than-expected Consumer Price Index (CPI) for August announced early this week has had a profound impact on interest rates and equities in particular. Interest rates rose and equity prices traded lower generally. Financial markets also have priced in a higher terminal rate for federal funds from approximately the 4.0% level to roughly 4.3%. We view this rate as perhaps the most important single interest rate. The latest CPI data have ratcheted up many investors’ expectations of the Fed’s aggressive monetary tightening policies, which were intended to deal with the now higher rates for longer inflation expectations. Many analysts and investors now forecast higher hikes in the federal funds rate in upcoming Fed meetings. Higher interest rates and lower stock prices means that financial conditions tightened once again this week in cooperation with recently expressed very hawkish “Fed-speak.” If we could personify financial markets’ response to the Fed’s efforts to tighten financial conditions, we thought of Elvis Presley’s version of the Blues song “Baby What You Want Me to Do.” There was little doubt after the latest CPI announcement that financial markets this week were implementing the Fed’s idea of tighter financial conditions to rein in elevated rates of inflation. “You got me doin’ what you want me; Oh baby what you want me to do … We’re goin’ up, we’re goin’ down; We’re goin’ up, down down up; Any way you want to let it roll.”
Concerns Over Fed Tightening Too Much
As interest rates rose and stock prices retreated, our concern became focused increasingly on whether the Fed would push for a terminal rate that was too high relative to what was necessary to rein in inflation. In our opinion, the two-to-10-year inversion becoming more extreme this week and heading back to the more inverted levels of mid-August was one indication that the bond market was sharing our concern. We interpret that the lower the 10-year Treasury yield trades relative to the 2-year yield as an indication that the bond market thinks that the Fed pushing for too high, a terminal rate will diminish future economic growth more than might be “required.” Our concern is particularly heightened by the stubbornness of shelter inflation prices that we, along with most forecasters, expect it to remain elevated for many more months to come. As we have highlighted in several of our recent commentaries, many housing market metrics have begun to deteriorate in response to higher interest rates. We are confident that rents and owners’ equivalent measures will start declining eventually as well. But the “problem” is that there will be an additional lag before this will be reflected in the official inflation data on which the Fed relies. We hope that the Fed will not exceed a terminal funds rate of roughly 4% before it stops raising rates. We are hopeful that the Fed would show some “patience” at that point to allow sufficient time for tightening financial conditions to be better reflected in incoming economic data.
Shelter Costs
Recent private market data sources appear to confirm our optimism for slowing shelter costs in the months ahead. According to a September 14 Vox publication, national apartment vacancies dropped to a low of 4.1% last fall before increasing recently to 5.1%. A recent report from Apartment List found that the national rent index rose 0.5% m/m, slowing from a 1% increase in July, even as this week’s CPI data continued to show surging shelter costs. It is our understanding that the principal reason for the lagging effects in the official government figures is that the government data accounts for existing rents, while most private data typically includes only prices from new leases that are a better reflection of current market conditions.
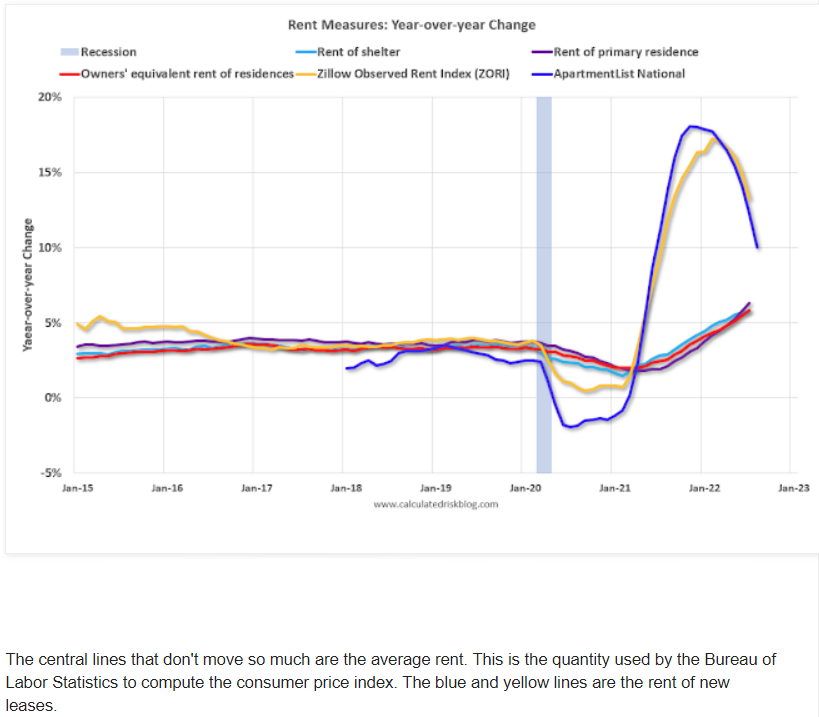
Source: John Cochrane’s Blog, The Grumpy Economist (9-15-2022)
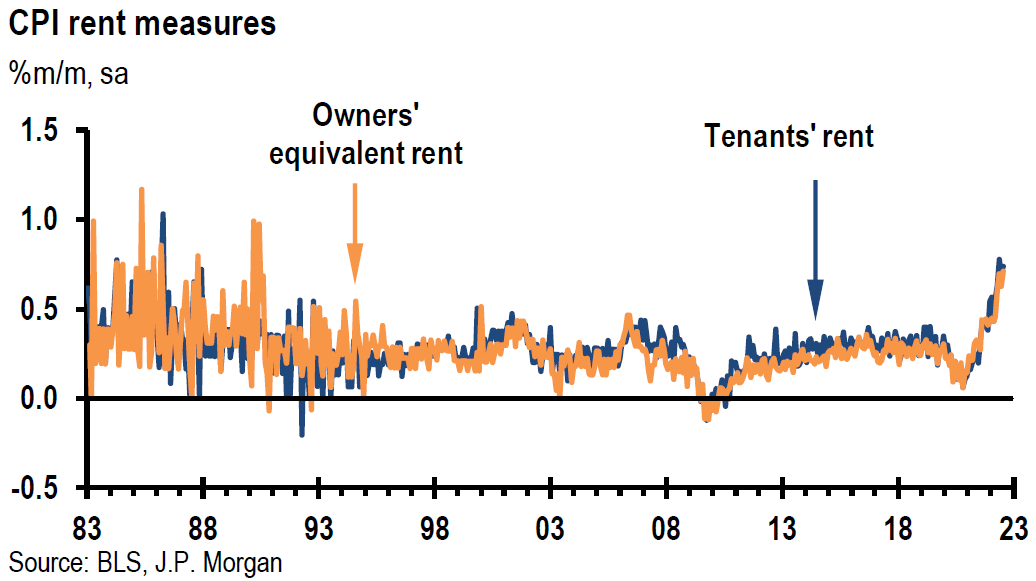
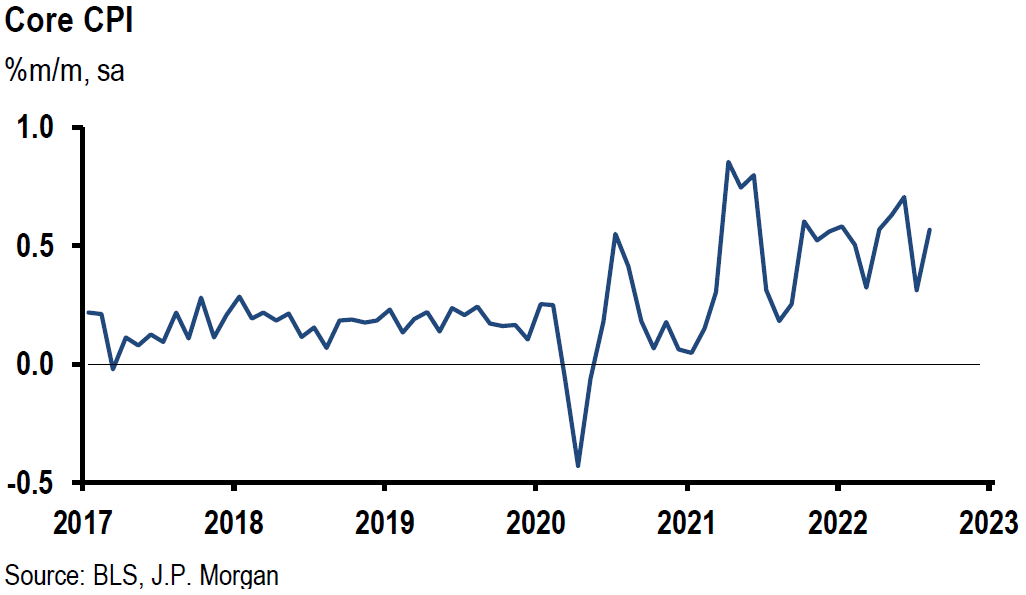
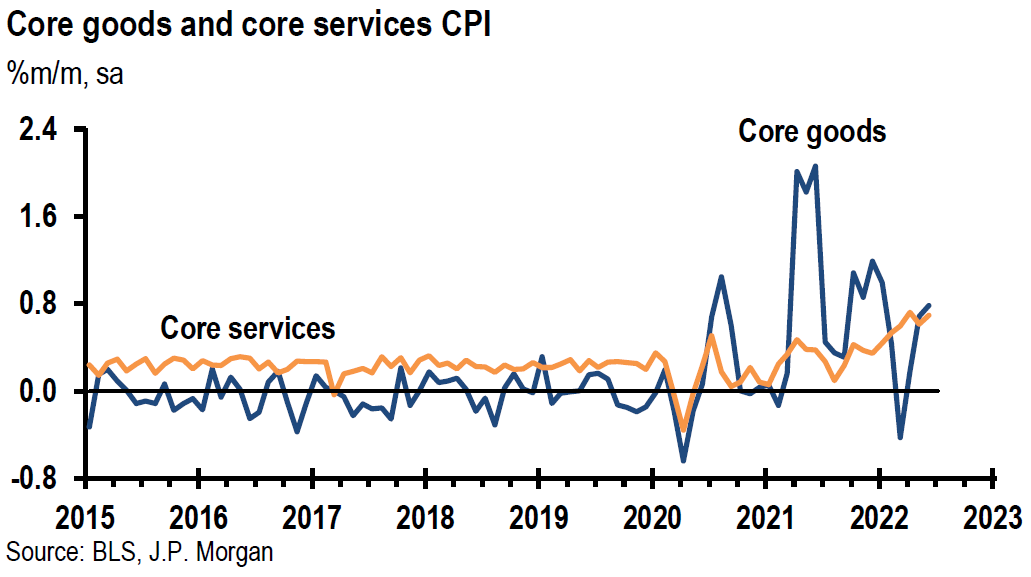
Source: US: JP Morgan, Core CPI is strong again (9-13-2022)
CPI
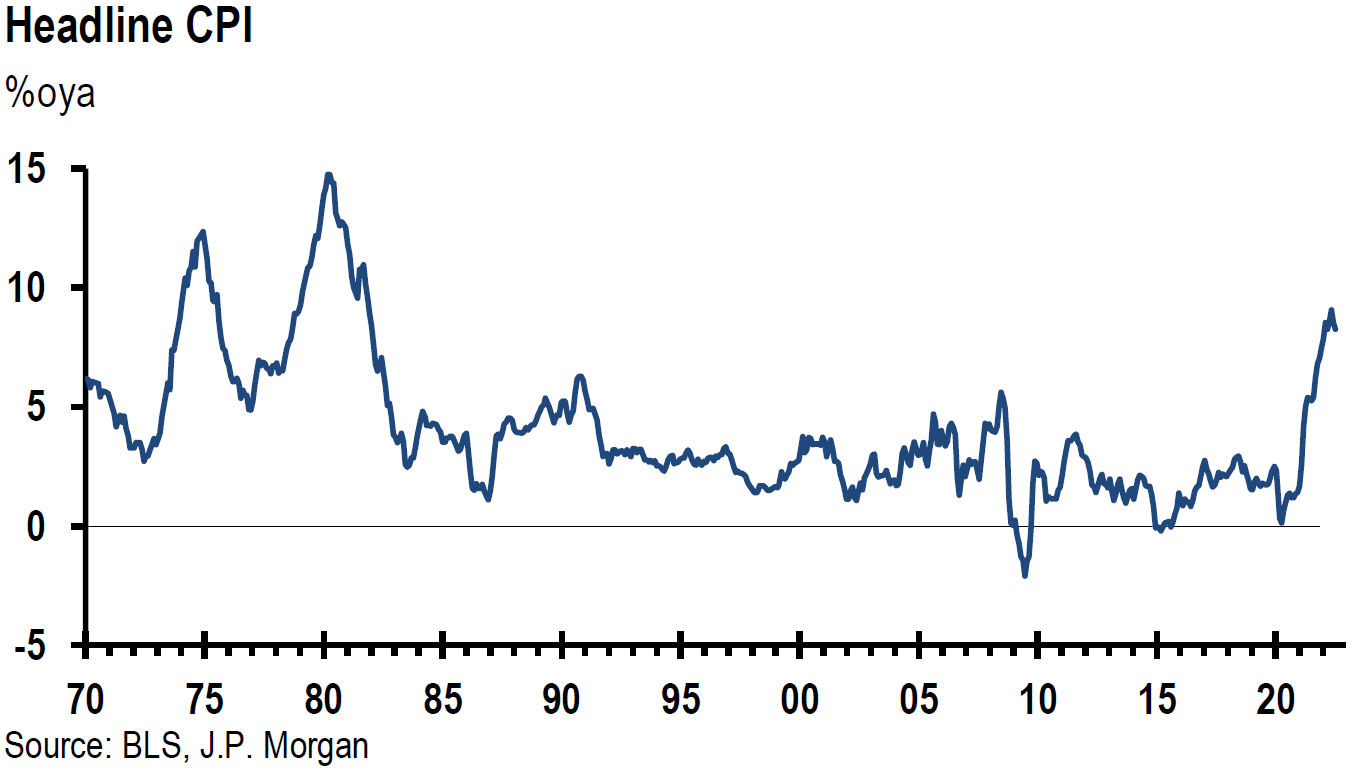
Headline CPI for August rose by 0.1% month-over-month (m/m) and 8.3% y/y versus expectations of -0.1% m/m and 8.1% y/y. Core CPI, which excludes food and energy, rose 0.6% m/m and 6.3% y/y, versus expected +0.3% and 6.1%. The continued rise in shelter costs were considered generally to be most worrisome. Shelter costs made up about 40% of core CPI and about 30% of headline CPI. Shelter costs are comprised of rental rates, +0.74%, and owners’ equivalent rent, +0.71%. Shelter costs rose 6.2% y/y. Inflation measures were rather broad based, as many other components of services inflation rose as well. Notable decreases in CPI components were the 5% drop m/m in energy prices, including a 10.6% drop m/m in gasoline prices, and a 4.6% m/m decline in airline fares. Food prices continued to show strong prices increases, at +0.8% m/m. Even so, the monthly rise in food prices was the slowest since December. Other notable gains in services were in wage sensitive areas of restaurants, medical care, education and personal care. New car prices rose 0.8% and used car prices decreased by a less-than-expected 0.1%. We expect larger decreases for used car prices in future months due to lower car auction prices recently. Car insurance rose 1.03% m/m, reflecting higher repair and replacement costs.
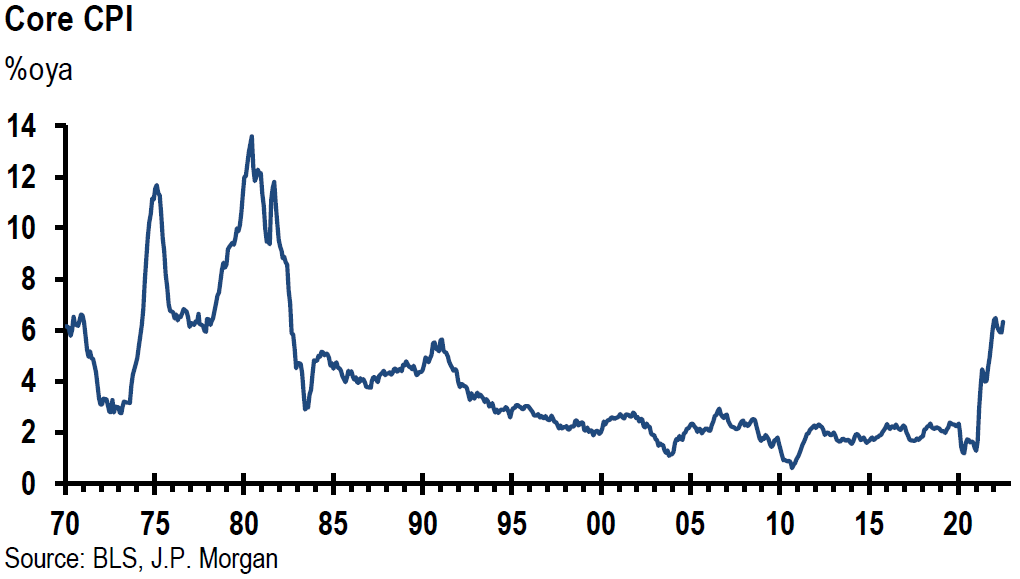
Source: US: JP Morgan, Core CPI is strong again (9-13-2022)
PPI
The August U.S. Producer Price Index (PPI), a gauge of wholesale prices, generally was close to expectations and was met mostly with a much more muted financial markets’ reaction. The headline PPI declined 0.1% m/m and rose 8.7% y/y, which is the lowest y/y increase since August 2021. Core PPI – excluding food and energy – rose 0.4% m/m and increased 7.3% y/y. Additionally, core PPI excluding food, energy and trade services increased +0.2% m/m and +5.6% y/y, which was the lowest annual increase since June 2021.
New York Fed Survey of Consumer Expectations
The New York Fed survey of consumer expectations for August showed a much more optimistic vantage point of consumer inflation expectations. This is an internet based nationwide survey of approximately 1,300 households. One-year-ahead inflation expectations dropped from the July’s 6.2% level to 5.7%. The difference of opinion in one year expectations, however, rose to a series high. Three-year inflation expectations dropped from 3.2% to 2.8% and five-years inflation expectations went from 2.3% in July to 2.0%. In contrast to one-year expectations, the level of disagreements over longer-dated expectations decreased. Expectations for home price appreciation dropped by 1.4% in August to 2.1%, which was the lowest reading since July 2020 and also below pre-pandemic levels. This compares to 6% home price appreciations expectations in April. Consumers also perceived that credit availability will be harder to get in one year. The preliminary September University of Michigan consumer sentiment survey released on Friday weas broadly consistent with this New York Fed survey. Both year-ahead and longer-term inflation expectations were indicated lower. Uncertainty over year ahead inflation expectations was the highest since 1982.
NFIB Small Business Optimism Index
Most of the remaining economic data analyzed this week did not dissuade us from our view that U.S. economic growth continued to soften. This was true even for those surveys that showed improvements in business activity and sentiment. One such survey was the National Federation of Independent Business (NFIB) small business optimism index that rose, but remained well below the 49-year average level for the eighth consecutive month. Small business owners’ expectations of business conditions over the next six months improved as did their expectations for increased sales. But these measures remained deeply in negative territory. The uncertainty index also increased. There were also some indications of slowing price increases.
Retail Sales
U.S. August retail sales presented a rather mixed picture to us. Although retail sales rose by a better-than-expected 0.3% m/m versus an expected decline of 0.1%, retail sales excluding autos decreased 0.3% versus an expected flat reading. Sales at motor vehicle and parts dealers rose 2.8% despite a decline in unit auto sales reported separately. Gasoline station sales dropped 4.2% m/m. Retail sales excluding autos and gasoline increased 0.3% versus an expected increase of 0.5% m/m. Food services sales increased 1.1% after a July decline. Other than that, retail sales were somewhat “sluggish.” We failed to find any hints of a trend in these retail figures.
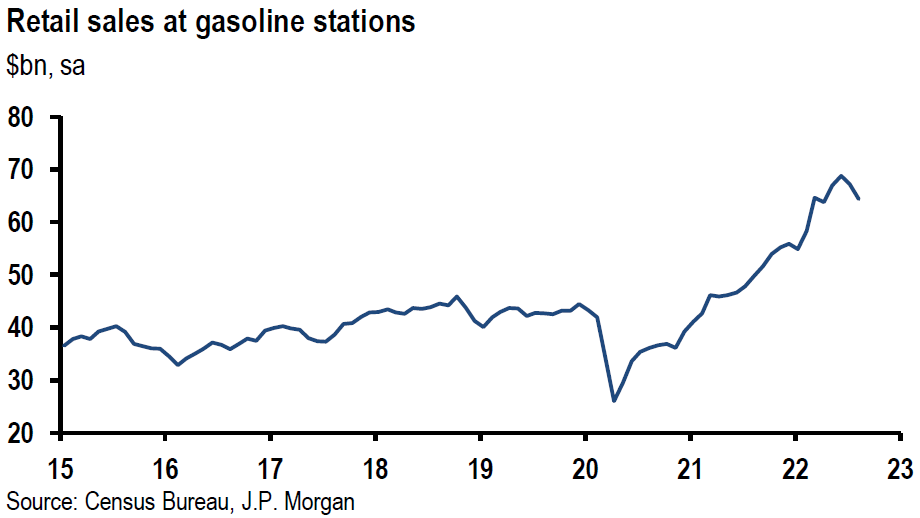
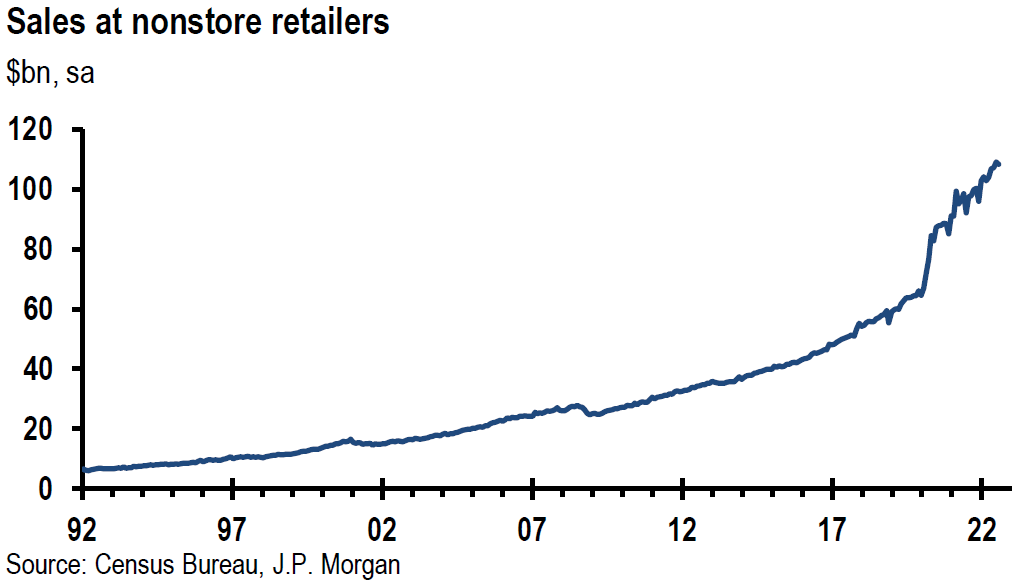
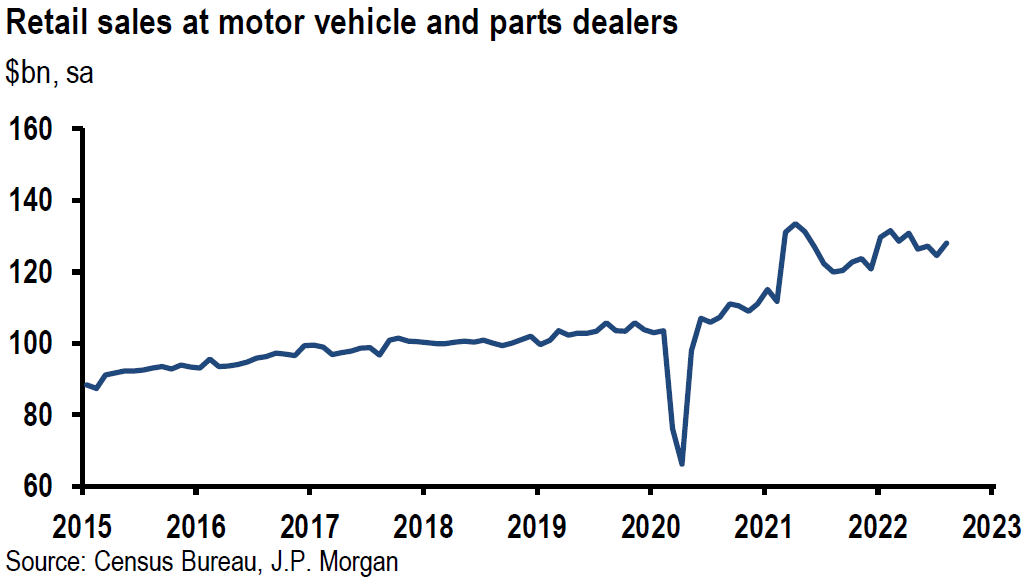
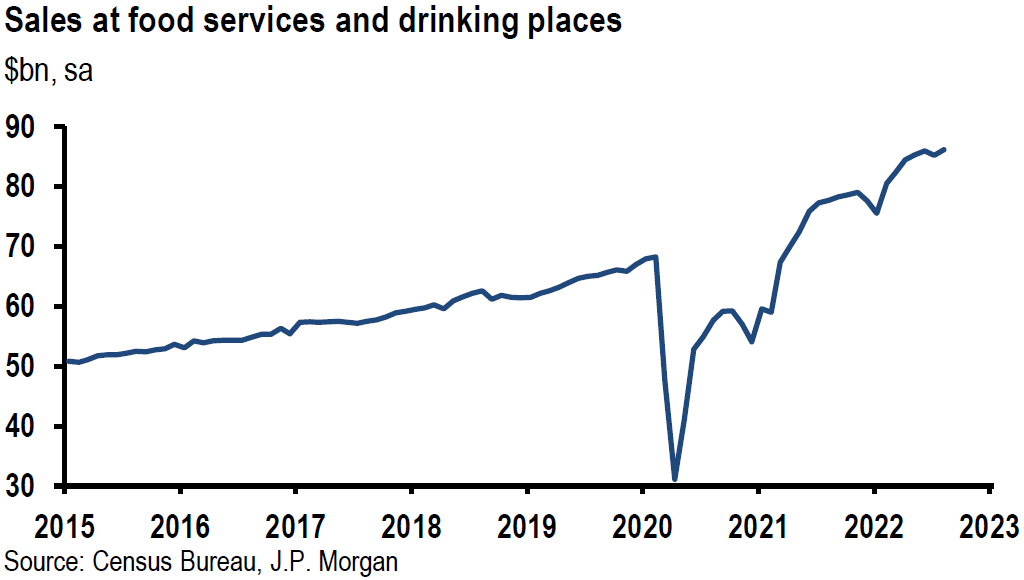
Source: US: JP Morgan, Retail sales up 0.3% in August, but control sales flat (9-15-2022)
Weaker Import Prices
We understand that the continued weakening of U.S. import prices should help contain U.S. inflationary pressures. Headline U.S. import prices decreased by a less-than-expected 1.0% m/m in August versus a revised decrease of 1.5% in July, but increased +7.8% y/y. This was the first consecutive monthly decline since early 2020. The annual increase was the smallest since March 2021. Import prices excluding petroleum decreased 0.2% m/m versus an expected decrease of 0.6% for the month, but marked a +3.9% increase y/y. Price declines for petroleum and petroleum products were 7.1% m/m.
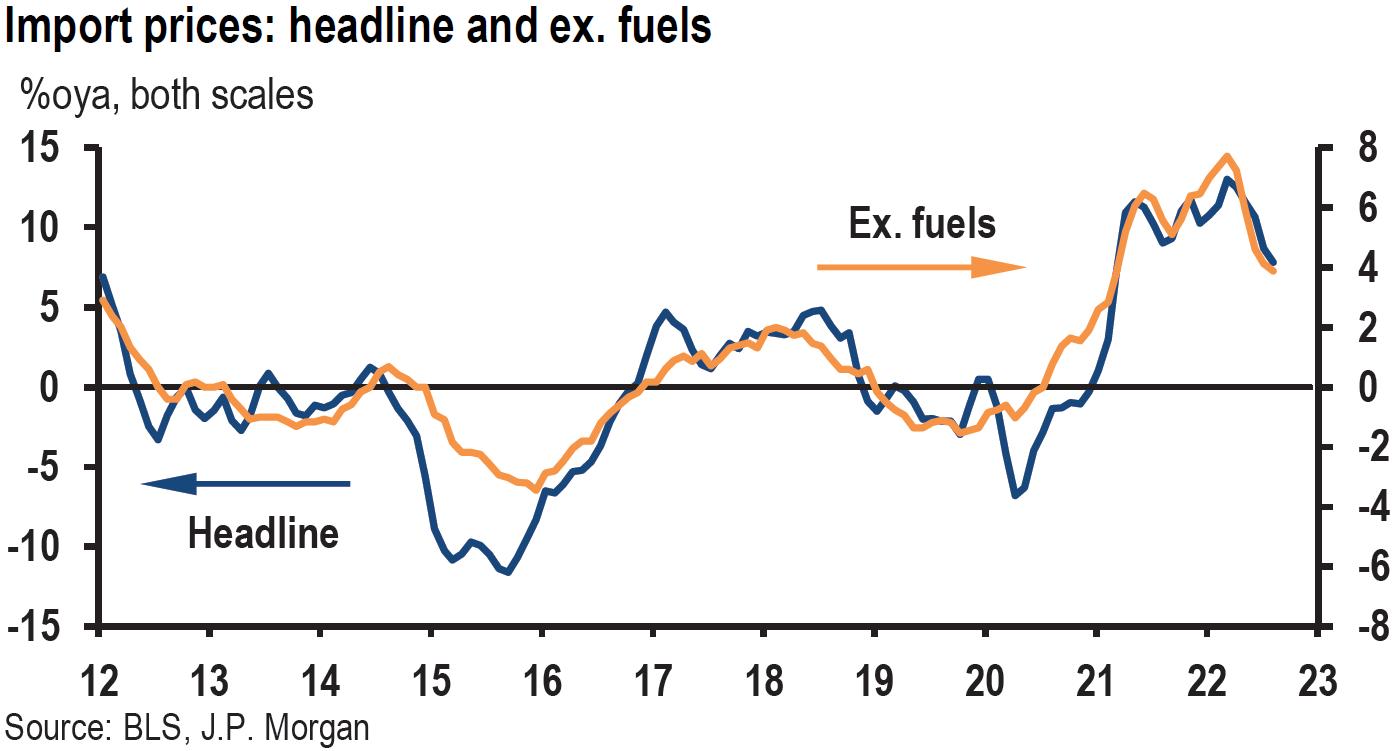
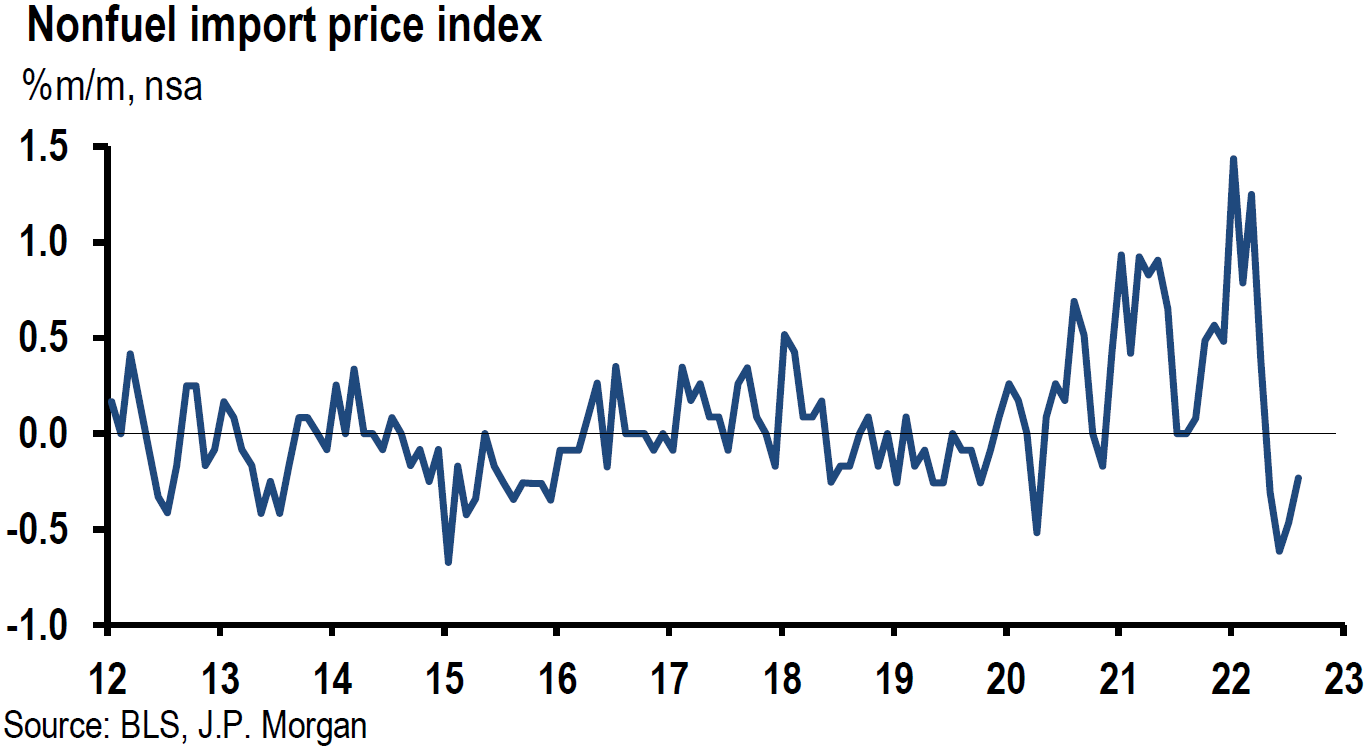
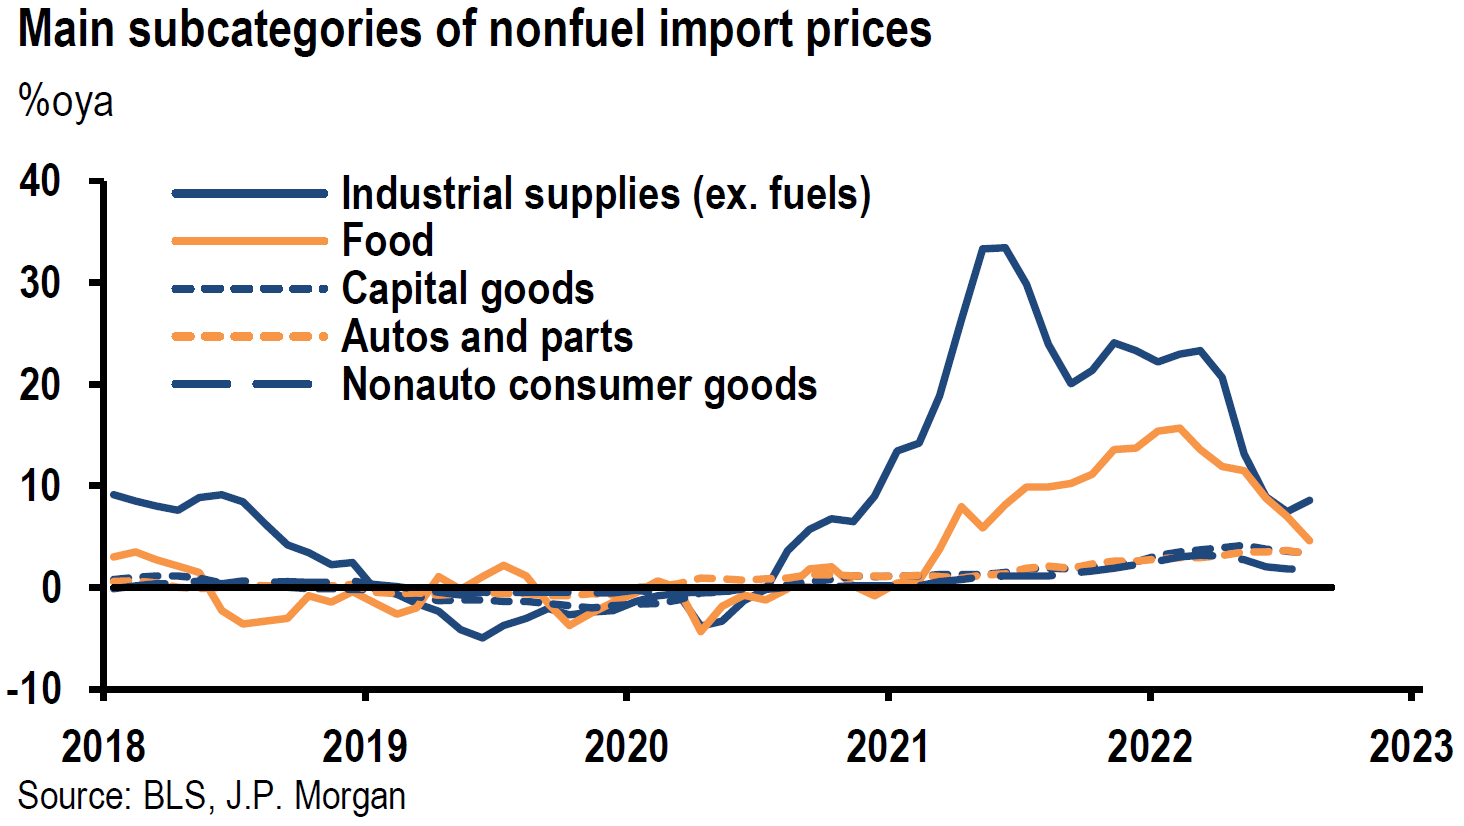
Source: JP Morgan, US: Import prices decline in August (9-15-2022)
Empire State Manufacturing Survey
The September manufacturing survey of the Philadelphia Fed and the New York Fed’s Empire State survey both ended the month in negative territory, but ended at their respective levels in dramatically different ways. The Empire State survey’s headline general business conditions index rose by a more-than-expected 30 points to a negative -1.5. New orders, shipments and employment measures all increased. Delivery times held steady and inventories expanded. There were notable price declines in this survey. The Empire prices paid measure declined 15.9 points to 39.6, its lowest level since December 2020, as it continued its downward trajectory of a cumulative 39 points decline over the past three months. Prices received dropped 9.1 points to 23.6, its lowest level since early 2021. Most firms were not very optimistic that business conditions would improve over the next six months. Nevertheless, manufacturing activity “held steady” in contrast to last month’s “sharp decline.” We were most encouraged by the sharp decline in prices in this report.
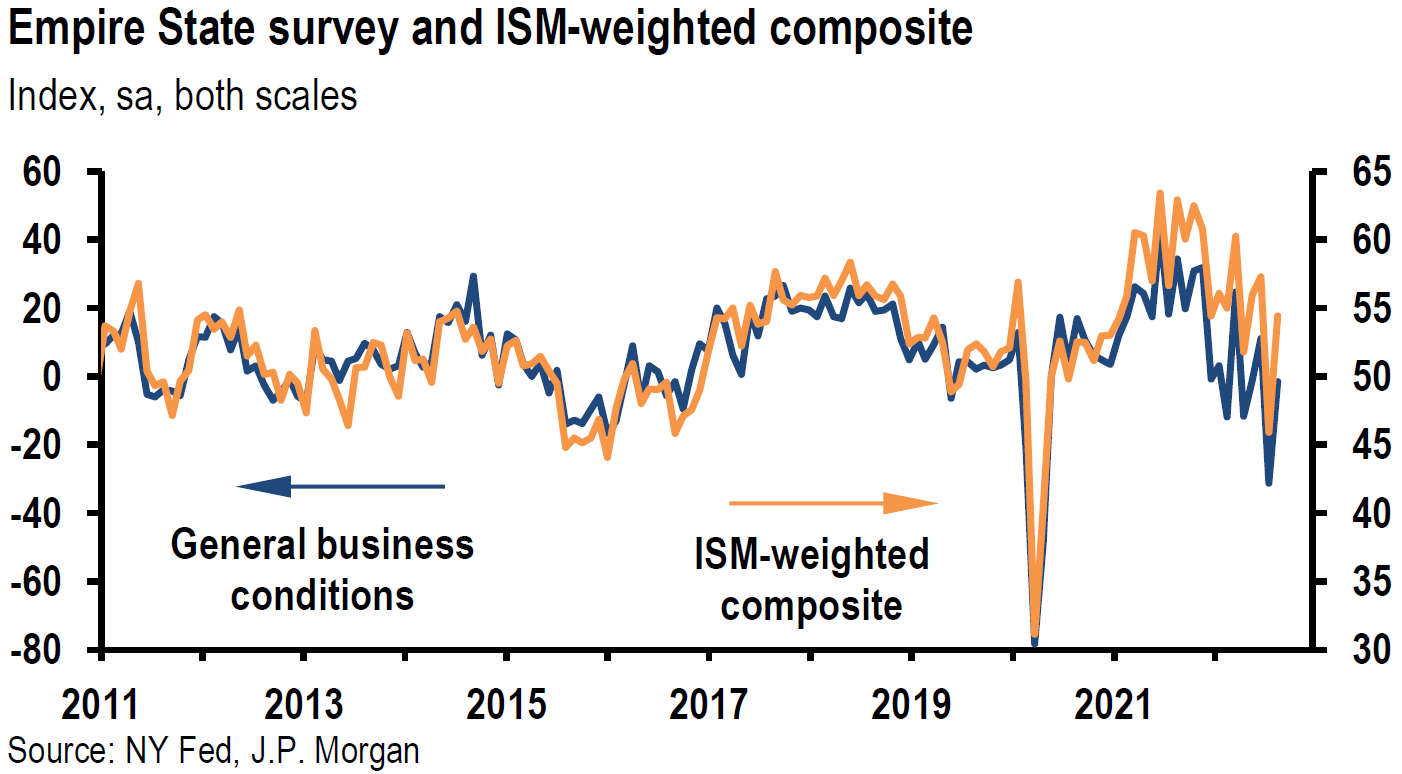
Source: JP Morgan, US: Manufacturing indicators mixed but softening (9-15-2022)
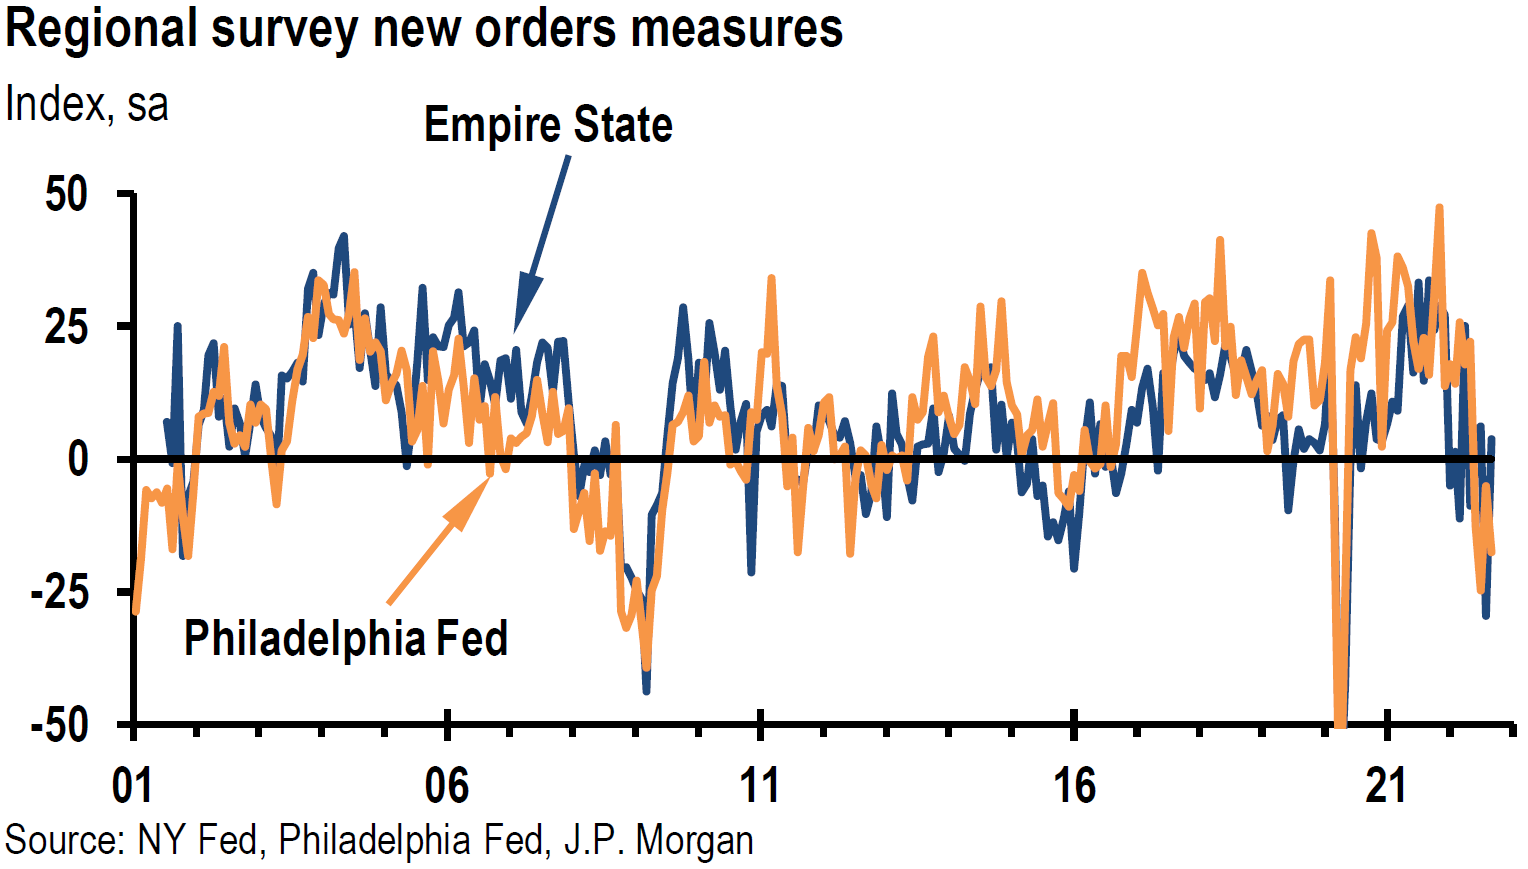
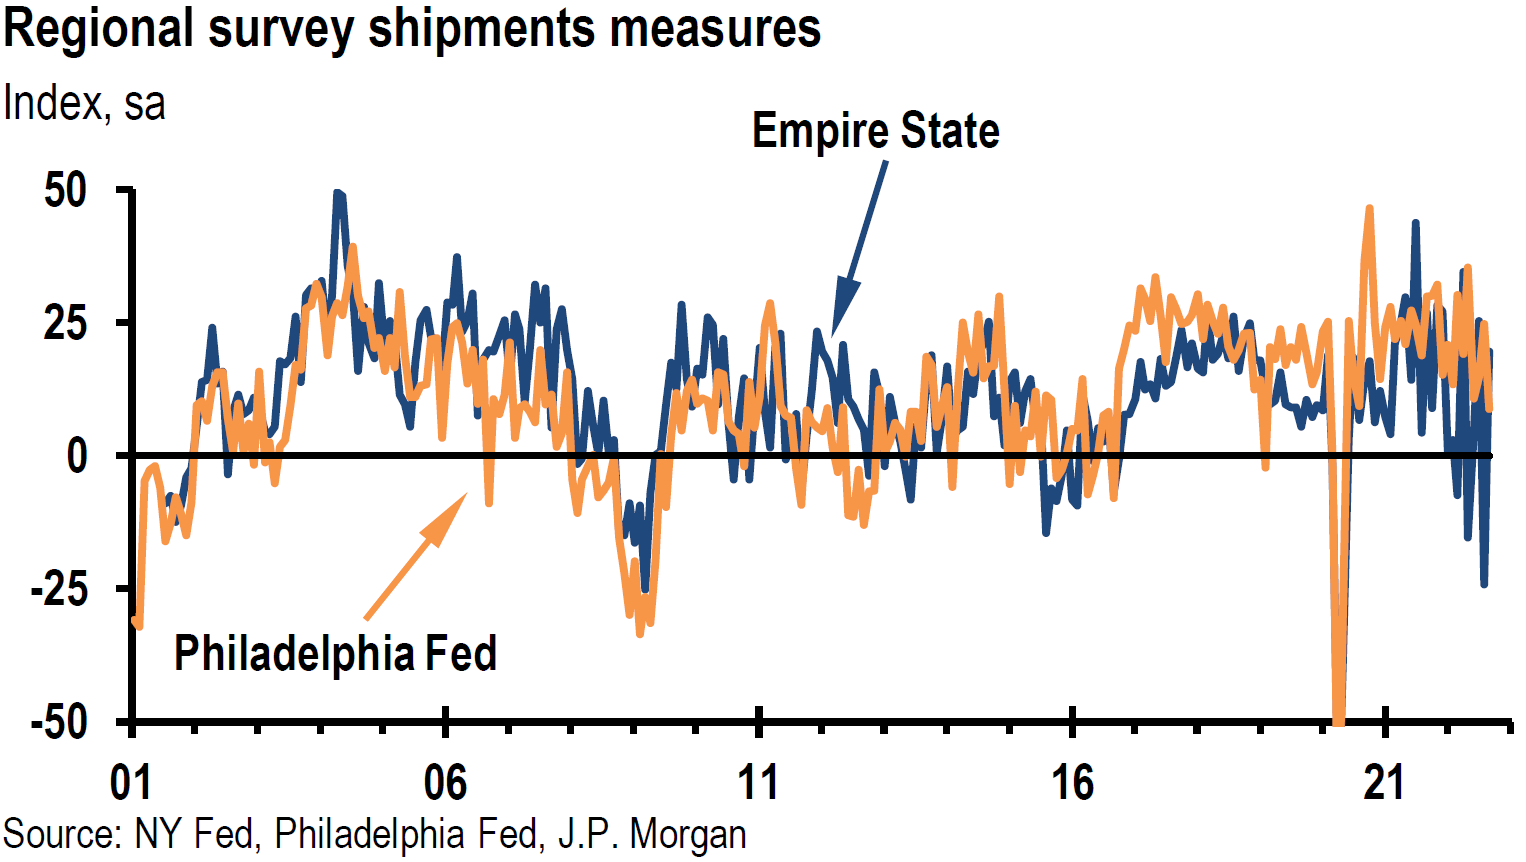
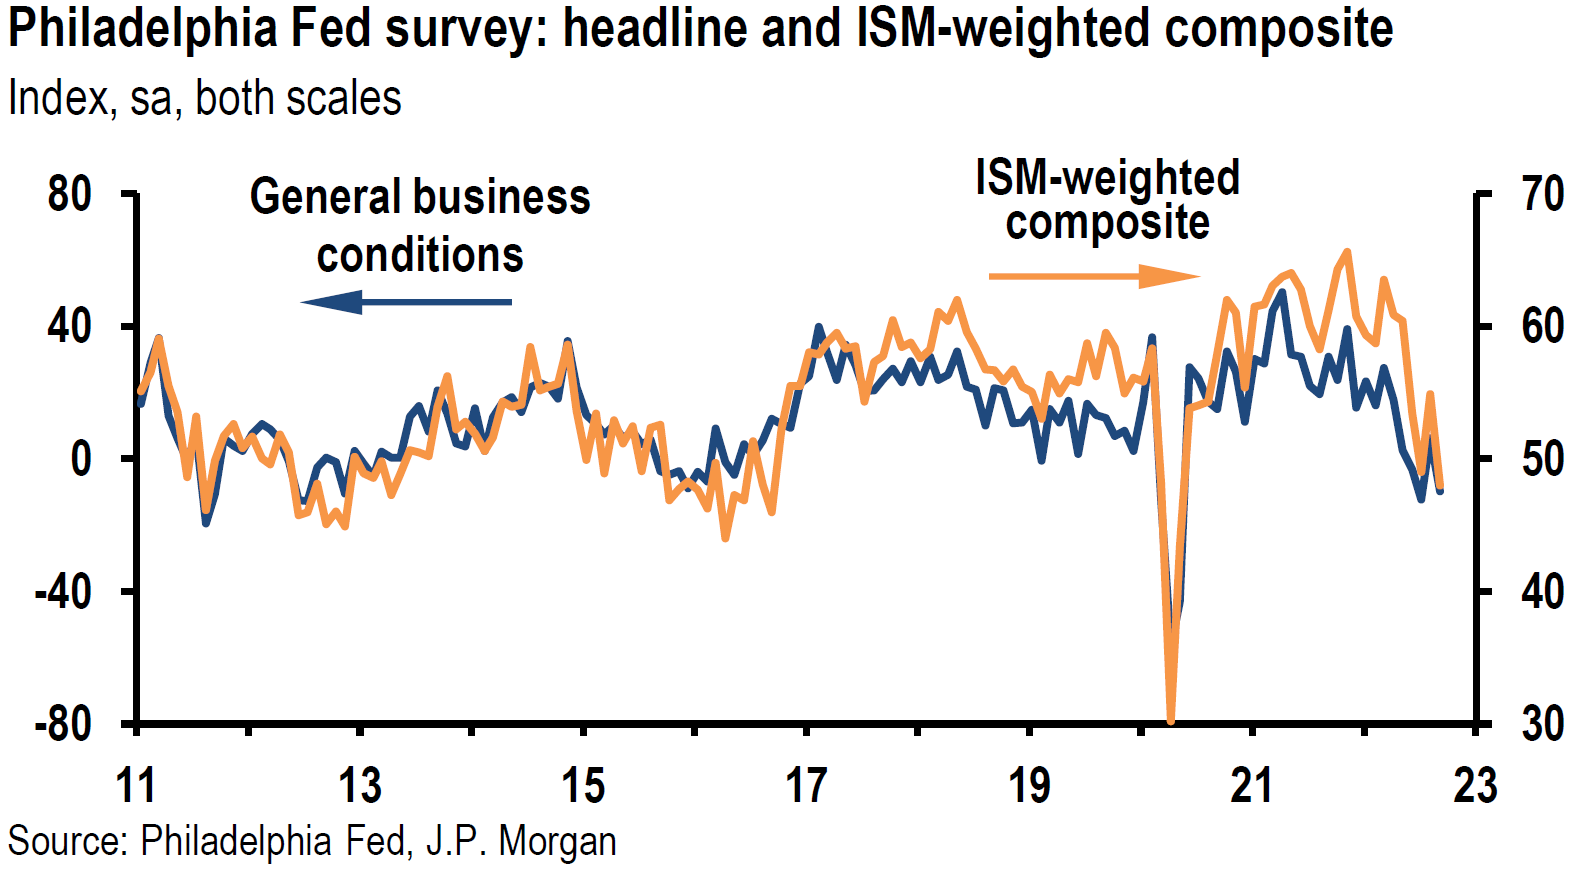
Philadelphia Fed Manufacturing Survey
In contrast to the monthly increases of the New York Fed’s survey of manufacturing, the Philadelphia Fed’s survey’s current general activity index unexpectedly dropped 16.1 points to a negative -9.9 in September. This marked its third month of the last four surveys in negative territory. New orders, shipments and employment measures all declined. Only new orders remained in negative territory. The shipment index declined to its lowest level since May 2020. Although the employment index remained in positive territory, the average workweek declined into negative territory for the first time since June 2020, confirming a slowing trend in employment measures. Prices paid decreased 13.8 points to +29.8, even as prices received increased 6.3 points to +29.6. Expectations for growth over the next six months remained “subdued” as the future general activity index improved but remained in negative territory. The delivery time component decreased drastically indicating shorter delivery times that were now at their lowest level since April 2009. We assume that the much shorter delivery times are a very good indicator of easing supply chain bottlenecks. We were also encouraged by softening input prices. However, we will remain on alert for any indications of a slowing trend in employment, such as that indicated by the shorter workweek of the Philadelphia Fed survey.
Source: JP Morgan, US: Manufacturing indicators mixed but softening (9-15-2022)
Initial Unemployment Insurance Claims
Unfortunately, key national data relevant for the U.S. employment trajectory to slow, were not as sanguine. The lower-than-expected nationwide initial jobless claims for the week ended September 10, indicated a still tight labor market. The initial jobless claims level of 213,000 was the lowest since May.
Industrial Production
The Fed released the U.S. industrial production August data this week that showed a decrease of 0.2% m/m in industrial production versus an expected increase of 0.1% m/m and 3.7% y/y. Manufacturing output increased 0.1% m/m after an increase of 0.6% in July, and marked a +3.3% increase y/y. The index for utilities decreased 2.3% m/m. Capacity utilization dropped 0.2% to 80.0% versus an expected 80.3% reading. But the 80.0% is still 0.4% above its long run average between 1972 and 2021. We interpret these figures as yet another indication of a slowing U.S. economy.
Inventory-to-Sales Ratio
U.S. business inventories increased as expected 0.6% m/m in July versus +1.4% in June. Sales declined 0.9% m/m, pushing up the inventory-to-sales ratio to 1.32 versus June’s ratio of 1.30 and the July 2021 ratio of 1.26. This ratio was 1.42 in February 2020. Ex-auto inventories increased 0.4% and the ex-autos inventory-to-sales ratio remained flat at 1.16 versus 1.19 in February 2020. A higher ratio indicates that inventories have expanded relative to sales.
Housing Continues to Weaken
According to the Mortgage Bankers’ Association, mortgage applications dropped 1.2% last week compared to the prior week and were 29% lower relative to the same week one year ago. The 30-year fixed-rate mortgage hit a 14-year high of 6.30% this week. Tightening financial conditions in response to the Fed’s tightening monetary policies appear to be working.
China’s Economic Activity Improves Generally
China’s economy improved broadly in August. Retail sales grew 5.4% y/y versus an expected 3.5% increase. Industrial production rose 4.2% y/y, exceeding 3.8% growth estimates. Auto production growth of 33% y/y was the largest contributor to industrial production growth. Fixed asset investment for the first eight months this year grew 5.8%, beating estimates of 5.5% growth. Real estate investment for this time period continued to decline, lower by 7.4% from the year ago period, deteriorating from July’s 6.4% downturn. We remain hopeful for an economic rebound in China that would help global economic growth as well as increasing commodity demand.
Bottom Line
For the time being, we are maintaining our basic investment approach as expressed in last week’s commentary. We continue to favor high quality big cap stocks that offer good balance sheets, as well as relatively stable cash flows and profit margins. A well-diversified portfolio for long-term investors will most likely be the preferred approach.
We foresee that the continuing weakening trends in the U.S. economy should reduce demand sufficiently so that the rate of inflation would be lower and that the labor market becomes less tight. We believe that the Fed should show “patience” and review economic data before assessing the effects of its policies.
We find the increased inversion of the 2-10-year Treasury yield curve somewhat troublesome, since we view increased inversions as an indication from the bond market that the Fed will tighten more than is “required” to tame inflation. We maintain our assumption that the Fed will see enough of a slowing in the rate of inflation and a lessening of labor market tightness before it chooses to tighten too much, in our opinion. We are also maintaining our belief that at worst, the U.S. will experience only a mild recession. We were encouraged by the mostly better than expected Chinese economic data for August. We foresee a rebound in China’s demand for commodities in general and for energy in particular in the coming months.
Definitions
Basis Points (bps) – A basis point is one hundredth of one percent, used chiefly in expressing differences of interest rates.
Federal Funds Rate – The term federal funds rate refers to the target interest rate set by the Federal Open Market Committee. This target is the rate at which commercial banks borrow and lend their excess reserves to each other overnight.
Headline Inflation – Headline Inflation is the raw inflation figure reported through the Consumer Price Index (CPI) that is released monthly by the Bureau of Labor Statistics (BLS). The CPI calculates the cost to purchase a fixed basket of goods to determine how much inflation is occurring in the broad economy.
Core Inflation – Core inflation is the change in the costs of goods and services, but it does not include those from the food and energy sectors. This measure of inflation excludes these items because their prices are much more volatile.
Producer Price Index (PPI) – The producer price index measures the average change over time in the prices domestic producers receive for their output. It is a measure of inflation at the wholesale level that is compiled from thousands of indexes measuring producer prices by industry and product category.
Inverted Yield Curve – An inverted yield curve describes the unusual drop of yields on longer-term debt below yields on short-term debt of the same credit quality. Sometimes referred to as a negative yield curve, the inverted curve has proven in the past to be a relatively reliable lead indicator of a recession.
Owners’ Equivalent Rent (OER) – Owners’ equivalent rent is the amount of rent that would have to be paid in order to substitute a currently owned house as a rental property. This value is also referred to as rental equivalent.
Shelter Costs – Shelter cost refers to the average monthly total of all shelter expenses paid by households that own or rent their dwelling.
Service Inflation – Services inflation is an instance where there is an increase in prices for services that is the primary driver for inflation.
Goods Inflation – Goods inflation is an instance where there is an increase in prices for goods that is the primary driver for inflation.
IMPORTANT DISCLOSURES
The views and opinions included in these materials belong to their author and do not necessarily reflect the views and opinions of NewEdge Capital Group, LLC.
This information is general in nature and has been prepared solely for informational and educational purposes and does not constitute an offer or a recommendation to buy or sell any particular security or to adopt any specific investment strategy.
NewEdge and its affiliates do not render advice on legal, tax and/or tax accounting matters. You should consult your personal tax and/or legal advisor to learn about any potential tax or other implications that may result from acting on a particular recommendation.
The trademarks and service marks contained herein are the property of their respective owners. Unless otherwise specifically indicated, all information with respect to any third party not affiliated with NewEdge has been provided by, and is the sole responsibility of, such third party and has not been independently verified by NewEdge, its affiliates or any other independent third party. No representation is given with respect to its accuracy or completeness, and such information and opinions may change without notice.
Investing involves risk, including possible loss of principal. Past performance is no guarantee of future results.
Any forward-looking statements or forecasts are based on assumptions and actual results are expected to vary from any such statements or forecasts. No assurance can be given that investment objectives or target returns will be achieved. Future returns may be higher or lower than the estimates presented herein.
An investment cannot be made directly in an index. Indices are unmanaged and have no fees or expenses. You can obtain information about many indices online at a variety of sources including: https://www.sec.gov/fast-answers/answersindiceshtm.html or http://www.nasdaq.com/reference/index-descriptions.aspx.
All data is subject to change without notice.
© 2024 NewEdge Capital Group, LLC


