Weekly Summary: February 14 – 18, 2022
Key Observations:
- We surmise that Putin’s main concern with Ukraine is related to Russia’s perception of NATO’s push eastward towards Russia. Putin can only dream of a time when Ukraine was “back in the U.S.S.R.”
- Presently, it appears that Russia will either invade Ukraine or retain its troops near Ukraine’s borders for quite some time, perhaps months. Supply disruptions of “key” materials from Russia are possible. Higher inflation and slower global economic growth could result.
- Apart from Russia-Ukraine tensions, the “re-opening” U.S. trade looks intact, particularly in regard to travel-related equities.
- We suppose the Federal Reserve (Fed) to remain very hawkish given the incoming economic data.
The Upshot:
Hopefully, the Russia-Ukraine tensions will be relatively short-lived, so that a global economic rebound could occur then in the manner that we foresee. This outcome would lead to interest rates continuing higher along with continued wage increases and higher than consensus inflation rate increases. We imagine that volatility will continue, and that any U.S. equity rallies will prove to be unsustainable until at least after the Fed’s mid-March meeting and irrespective of how the Russia-Ukraine tensions are resolved. Furthermore, we continue to presume a weakening U.S. Dollar (USD) over the course of this year. A weaker USD would help commodity prices go higher and would favor international equity holdings by U.S.-based investors. Moreover, we maintain our conviction that commodities are the best inflation hedge presently. We suppose that equity investments in select European and emerging markets (EM) might be an attractive way for long-term investors to diversify their portfolios. On February 11, Goldman Sachs’ economists predicted that European economies would outperform the U.S. economy for the first time in thirteen years. In our opinion, the U.S. re-opening trade will prove to be durable.
Russia-Ukraine Tensions
Since the end of last week, global financial markets have been affected most by speculations over the intentions of Russia’s president Vladimir Putin in regard to Ukraine. The principal question has been whether Russia will invade Ukraine and what would be the many repercussions of such an invasion? What would be the severe sanctions against Putin and Russia that the U.S. threatened? What sanctions would be forthcoming from Canada and the other 27 European countries who are members of The North Atlantic Treaty Organization (NATO)? What would be Russia’s response? NATO – an intergovernmental military alliance – constitutes a system of collective security, whereby its independent member states agree to mutual defense in response to an attack by any external party. Currently, NATO recognizes Bosnia and Herzegovina, Georgia and Ukraine as aspiring members. Both Georgia and Ukraine were constituent republics of the Union of Soviet Socialist Republics (U.S.S.R.), also known as the Soviet Union. The U.S.S.R. was a one-party state prior to 1990, when it was governed by the Communist Party of the Soviet Union. Moscow was the capital within Russia, which was the largest and most populous republic. The U.S.S.R. was founded in 1922 and was dissolved in 1991.
It is well known that Putin wants assurances that Ukraine can never become a member of NATO. We are not speculating whether or not Russia will ultimately invade Ukraine or what Putin’s real motives are for surrounding Ukraine with Russian troops that appear ready to invade. But we surmise that this is ultimately about Russia’s security. Russia has become concerned increasingly about NATO’s expansion eastward and its involvement in the former Soviet space. It is alarmed about the present or future deployment of any military weapons in the area.
“Back in the U.S.S.R.”
We conjecture that Putin yearns for the days gone by when the U.S.S.R. was intact, and when Moscow was in charge of the U.S.S.R. and its constituent republics that included Ukraine. That was when the U.S.S.R. was an undisputed “super-power” that was listened to and feared by many countries. We contemplate that Putin could be dreaming along the lyrics of the Beatles song “Back in the U.S.S.R.” If he invades, he might think “Been away so long, I hardly knew the place, Gee, it’s good to be back home.” We then guess that he could tell the Ukrainian people “You don’t know how lucky you are” to be reunited with Russia. We are not saying that scenario is likely to unfold – only that this could be Putin’s “wish.” In the meantime, we wait for more clarity on the Russia-Ukraine tensions.
Possible Sanctions Could Lead to Critical Supply Disruptions
Even if there is no Russian invasion of Ukraine, sanctions still might be imposed on Russia due to actions just short of an invasion. Given Russia’s vast natural resources, as well as some of Ukraine’s key resources, Russia could retaliate by restricting the flow of certain commodities. Possible Russian retaliatory moves could exacerbate and extend global inflationary pressures and dampen global economic growth. Some examples might include possible disruptions of natural gas and oil exports from Russia to Europe, which could be significant problem for European economies. According to Reuters on February 16, Europe gets approximately 40% of its natural gas and about 26% of its oil needs from Russia. CNBC reported on February 11 that chipmakers could face supply issues for key components including semiconductor grade neon if Ukraine is invaded. According to the Techcet advisory firm, over 90% of U.S. semiconductor-grade neon supplies come from Ukraine, while 35% of U.S. palladium is sourced from Russia. A primary focus of this consulting firm is an analysis of materials needed in supply chains in global semiconductor industries. The Korea Times observed on February 11 that neon is a critical component needed for the lasers used to make semiconductors. Techcet described neon as a byproduct of Russian steel manufacturing. Among other applications, Palladium is used in sensors and memory circuits. Any disruptions, or even the threat of supply disruptions or constraints in these commodities, could exacerbate the shortage of semiconductors. By now, we all are very familiar with what these shortages mean for auto and truck manufactures, as well as increasing inflationary pressures. Russia is also a leading producer of wheat and barley, as well as materials used in the production of fertilizers and other commodities. Food inflation could increase further.
U.S. and Russian Views on the Current Situation Diverge
Towards the end of this week there were reports from Russia indicating they were becoming concerned over fighting between Ukraine and Russian-backed separatists in eastern Ukraine. The U.S. continued to assert that Russia was poised for an imminent invasion. Some analysts were fearful that Russia’s reference to fighting in eastern Ukraine could be used as pretext for a Russian invasion. The Russians also indicated that it would take some time before it could withdraw its troops from near Ukraine’s borders, perhaps months. We maintain that even if a Russian invasion is not imminent, the continued presence of the Russian military near and around Ukraine borders could be enough to encourage the stockpiling of key Russian materials and commodities. This could lead to increased inflationary pressures and to a slowing global economy. We remain hopeful that any negative effects from a potential Russian-Ukraine conflict would be relatively short-lived.
Possible Iranian “Nuclear” Deal = More Oil
Multiple news reports from February 16 and 17 indicate that a possible nuclear deal with Iran could be imminent, which could lead to significant oil supplies from Iran. On February 16, the Guardian cited a tweet from Iran’s lead negotiator on that same day that, “after weeks of intensive talks, we are closer than ever to an agreement, nothing is agreed until everything is agreed, though.” The U.S. added that it was in the “very final stages” of indirect talks with the Islamic Republic of Iran. On February 17, Bloomberg reported Citi Research’s prediction that an agreement would allow the return of 500,000 barrels a day of Iranian oil to international markets by April or May, and that the additional supply of oil from Iran could increase to 1.3 million barrels per day by the end of 2022. We assume that the prospect of supplementary Iranian oil supplies constrained any additional oil price increases, which would have otherwise most likely have transpired due to the potential Russian-Ukrainian crisis.
Underlying U.S. Equity Trends
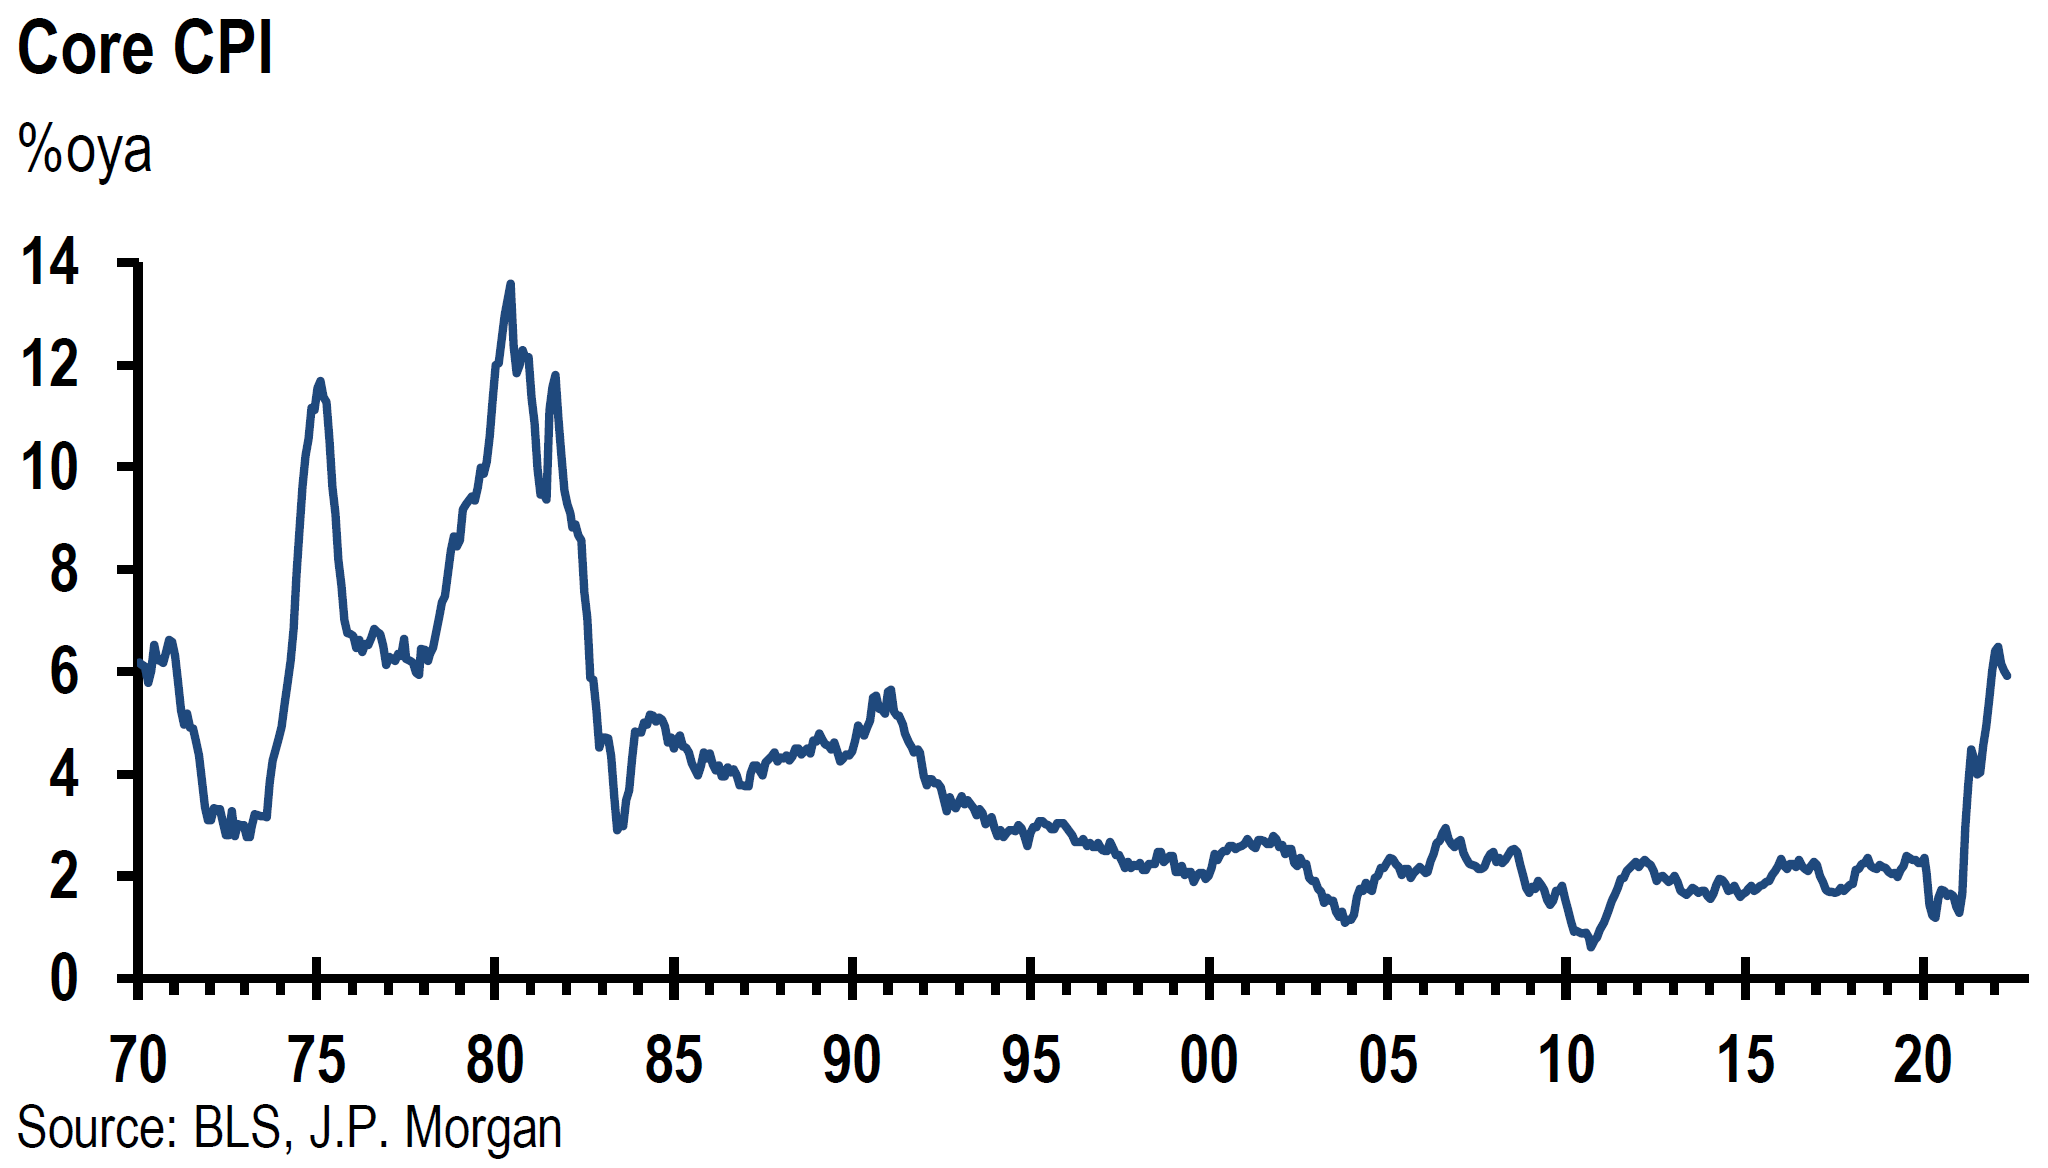
We thought that this might be a good week to try to decipher underlying financial market trends when the focus was not the Russia-Ukraine tensions. Through Thursday, the biggest equity gains of the week were on Tuesday when the U.S. Producer Price Index (PPI) was released. Much like the U.S. Consumer Price Index (CPI) released the prior week, the January PPI also exceeded expectations. The headline PPI for January was 1.0% month-over-month (m/m) and 9.7% year-over-year (y/y). The core January PPI, which excludes food and energy, was +0.8% m/m and +8.3% y/y. The only other significant economic data released that day was the Federal Reserve Bank of New York’s Empire State Manufacturing survey of activity in the New York State area. The survey responses were collected between February 2 and February 9. Although the headline general business conditions rose over the prior month, the increase was below expectations. But the underlying components, such as increases in shipments, new orders and employment, were strong. Delivery times continued to lengthen, prices paid remained near their record peak and prices received hit a new record. While firms were generally optimistic that business conditions would improve over the next six months, the optimism was rather muted.
U.S. Treasury Yield Curve
The U.S. financial markets responded rather enthusiastically to the data that day. The equity rally was very broad based. The strength of the reopening trade was particularly noteworthy. Most any travel-related equities ended the day with substantial gains. Following a period of a flattening trend, the Treasury yield curve steepened. We do not think that the yield curve steepening along with the advance of travel-related stocks was a coincidence. We interpret this correlation to mean that the yield curve is prone to steepen when there is a positive outlook for future economic growth. Likewise, when the markets become more concerned about future economic growth, the yield curve tends to flatten. Most recently, there has been a flattening bias. Historically, yield curves start to flatten when the Fed begins its tightening monetary cycle. As the Fed continues to tighten, the yield curve typically flattens more since the market anticipates a slowing economy to result from the tightening cycle. In our opinion, the current flattening period start was earlier than “normal” due to the Fed “telegraphing” its intentions early. Another factor might have been foreign buying of longer-dated Treasuries due to their relative attractiveness compared to foreign sovereign yields. The Fed has taken note of this foreign influence in the minutes of their prior meetings. But this foreign buying interest might abate to some extent along with the recent dramatic rise of their own sovereign yields.
On days like Thursday of this week and Friday of last week, when the focus has been on the Russia-Ukraine crisis, the yield curve has flattened along with an increasing pessimism for future global economic growth. U.S. equities broadly declined on both of those days as well. As we stated previously, we hope that this crisis will be rather short lived so that our anticipated global economic rebound can occur in a timely manner. We conjecture that in the near term and perhaps the medium term, the yield curve will be volatile in terms of flattening or steepening before flattening further in the longer term. We will continue to focus on trying to forecast a general rise in interest rates.
Source: Goldman Sachs, Global Markets Analyst: The Synchronized Bond Market Sell-off and Longer-Maturity Forward Rates (2/16/2022)
Fed Minutes from January 25-26 Meeting
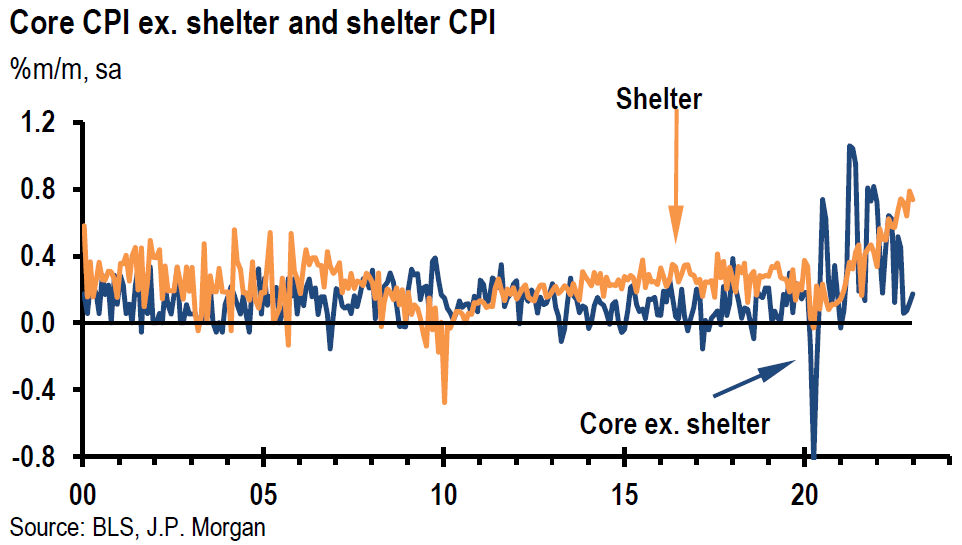
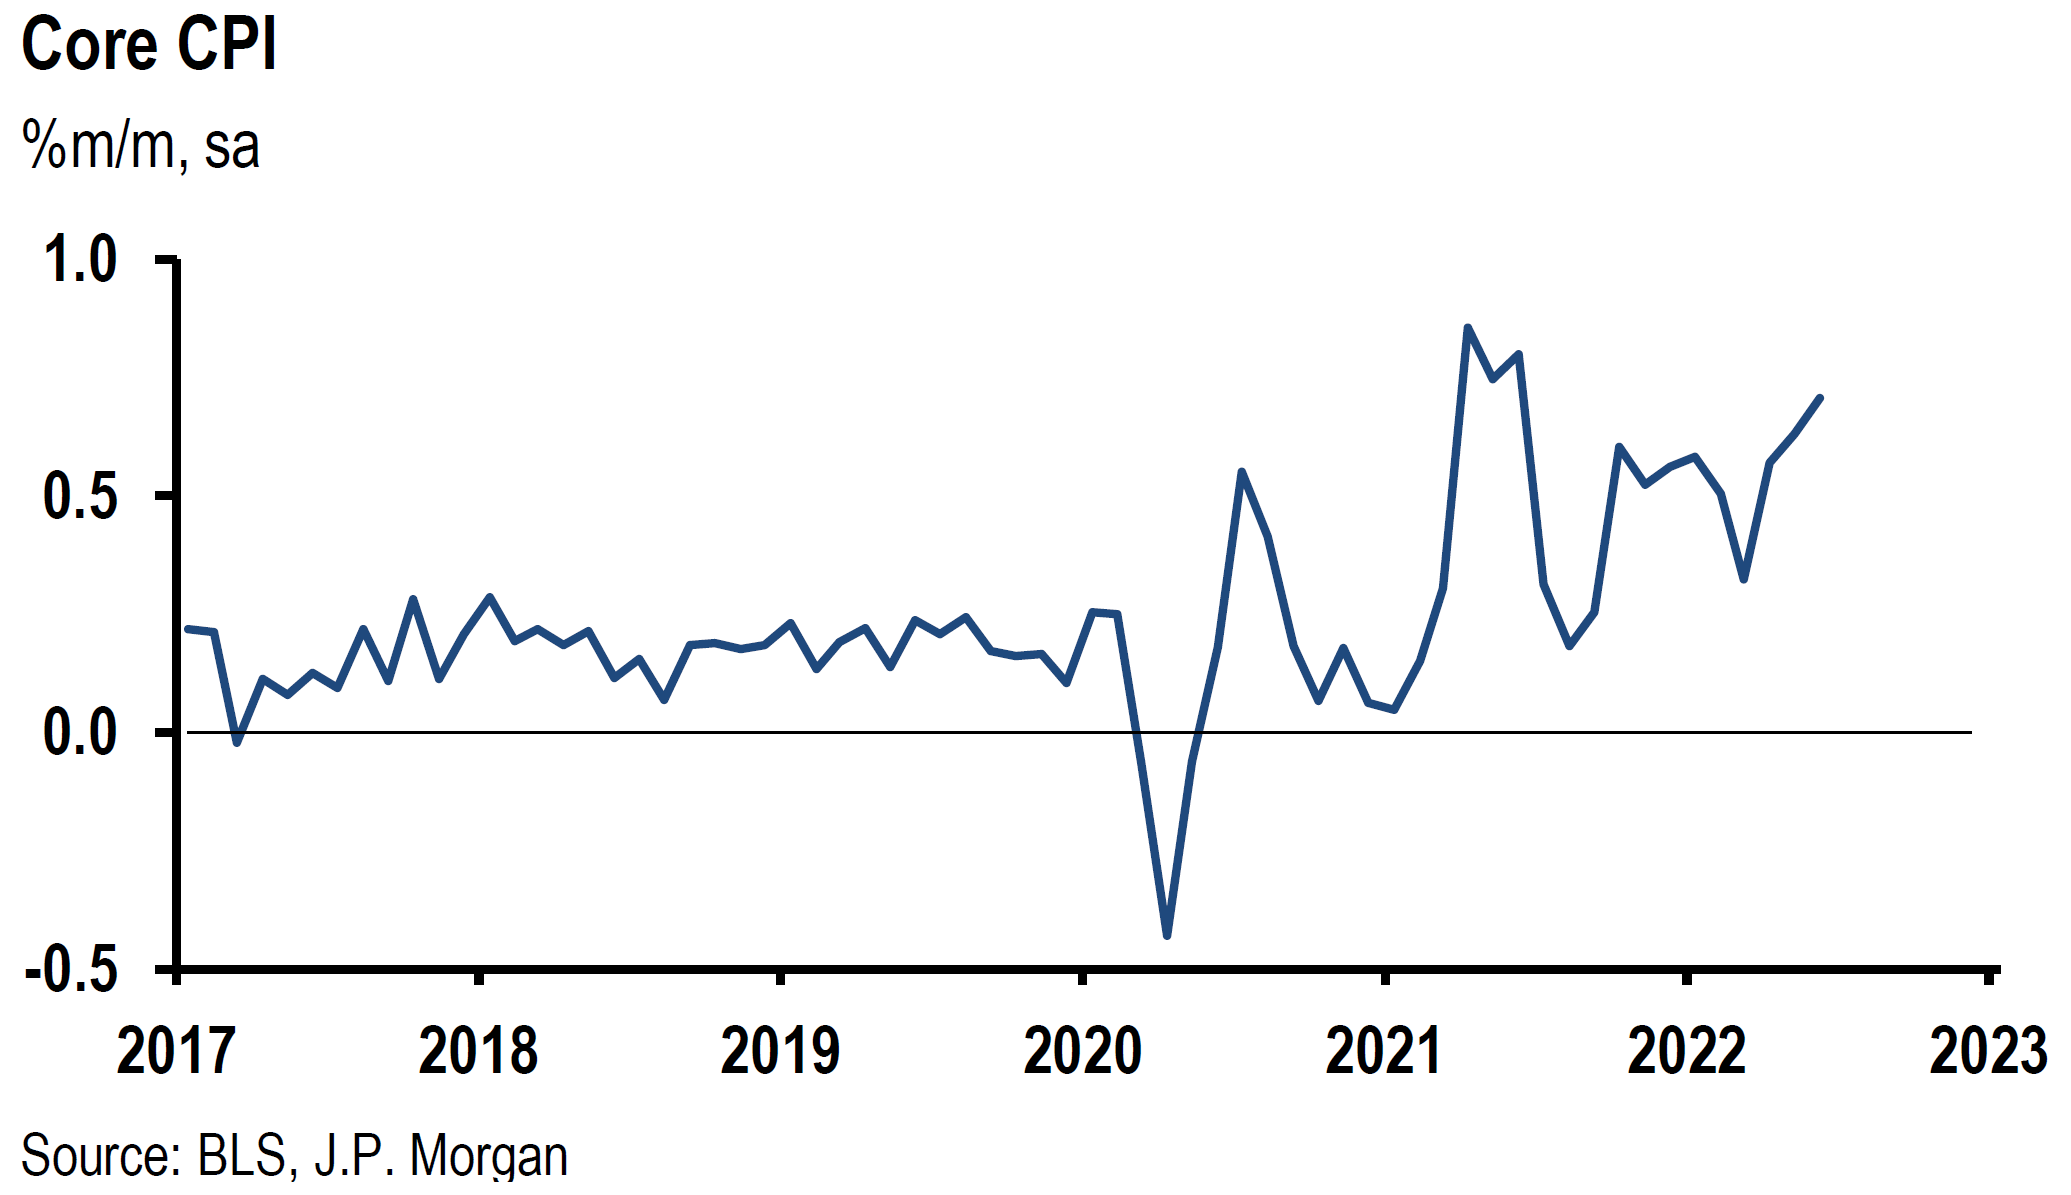
The minutes of the Fed’s January 25-26 meeting were released mid-week. It appears that the Fed shares our confidence in a strong global economic rebound after Q1 2022. The minutes also indicated that inflationary pressures have continued to surprise the Fed on the upside. The Fed minutes highlighted most participants’ increased uncertainty about inflation. The tight labor market and increasing wages along with increasing housing costs were of special concern for higher inflation. Most participants viewed inflation risks as skewed to the upside and economic growth risks as skewed to the downside. The discussion of geopolitical risks centered around their effects on inflation and economic growth. We did not detect any surprises in the Fed minutes about their future policy decisions. Furthermore, we thought it notable that there were very few additional details on the reduction of the Fed’s balance sheet of nearly $9 trillion. Any discussion about using the manner of balance sheet reduction to steepen the yield curve was absent.
Fed to Remain Hawkish
We continue to assume that the Fed will be as hawkish as the incoming economic data will allow. As we have specified in our prior commentaries, the Fed believes that the best way to provide for a stable and growing economy is to control inflation and to keep inflation expectations “well-anchored.” Under the present circumstances, we agree. Most analysts, including ourselves, have noted that the Fed cannot solve the supply-chain issues that have accounted for a good portion of the rise in inflation. The Fed’s tightening monetary policies only can affect really the demand side of the equation. But the Fed’s influence through diminishing demand should not be underestimated. On February 14, J.P. Morgan divulged that U.S. consumer spending on goods was more than $700 billion above its pre-pandemic trend, while spending on services was $300 billion below trend. A diminishing demand for goods could lower inflation to some extent. Likewise, to the extent that the Fed’s tightening bias lowers asset prices, including equities, it helps to serve the Fed’s purpose of tightening financial conditions, which is presumed to lower demand and help contain inflationary pressures. The Fed actually desires a slumping equity market in this context. It just wants to avoid any severe dislocation of equity prices.
Mostly Positive U.S. Economic Data
Most of the U.S. economic data released this week was positive. The biggest positive surprise in economic data points was the much stronger-than-expected U.S. retail sales in January that were +3.8% m/m after a revised lower 2.5% reading for December. This was the biggest month-over-month increase in ten months. Online sales were very strong at +14.5% m/m. Sales at auto dealers were noteworthy at +5.9% m/m, which perhaps is an indication of supply constraints easing in auto production as more vehicles were available for sale. On the other hand, sales at bars and restaurants were lower by 0.9% m/m. No doubt, the Omicron variant could have played a role. January U.S. industrial production rose 1.4% m/m, which was better than expected. The very large increase of 9.9% in the index for utilities due to a surge in demand for heating in January was a significant contributor to the bigger-than-anticipated increase. Due to the strong January retail sales and industrial production figures, Goldman Sachs raised its Q1 2022 U.S. GDP growth estimates from 0.5% to 2.0% quarter-over-quarter.
Other positive economic data released midweek were higher-than-expected U.S. import and export prices. In fact, the 2% m/m increase of U.S. import prices was the largest sequential monthly increase since April of 2011. U.S. business inventories had a strong showing as well, rising 2.1% m/m in December. This was the strongest month-over-month increase in business inventories since records began in February of 1992. Inventories climbed 10.5% y/y. Finally, the New York Fed’s business leaders’ services survey for the New York area conducted between February 2 and February 9, registered a headline business activity index decline, but also exhibited optimism for business conditions to improve over the next six months. The record high or almost record high prices paid and received, as well as the continued near-record-high pace of wage growth, all seemed to dampen respondents’ assessment of current business conditions.
Virtually all of the above positive economic data was released midweek along with the Fed minutes release. The U.S. equity averages had a muted response that day. But the U.S. Treasury yield curve steepened, presumably reflecting a more benign outlook for U.S. economic growth.
Source: U.S. Census Bureau, MANUFACTURING AND TRADE INVENTORIES AND SALES, DECEMBER 2021 (2/16/2022)
Source: Federal Reserve, INDUSTRIAL PRODUCTION AND CAPACITY UTILIZATION (2/16/2022)

Source: U.S. Census Bureau, ADVANCE MONTHLY SALES FOR RETAIL AND FOOD SERVICES, JANUARY 2022 (2/16/2022)
Bottom Line
If Russia-Ukraine tensions lead to a scenario of higher inflation and slower economic growth, the Fed could be facing a conundrum. Do they then risk slowing economic growth even more with aggressive interest hikes to slow inflation or do they procrastinate implementing their planned monetary tightening policies? Many analysts take the view that the Fed would then delay the implementation of its planned tightening schedule. We take the opposite view given the anticipated underlying robust global economic rebound and the very elevated inflation levels. The case for a non-delayed tightening cycle is strengthened by our shared view with the Fed that the most effective way to sustain robust economic growth presently is to tame inflation and to keep inflation expectations “well anchored.”
In the near and perhaps intermediate terms, we contemplate a volatile yield curve depending on the markets’ perception of a slowing or robust economy. But we maintain our conviction of interest rates continuing their ascent this year. However, we don’t expect the fixed income markets to escape our assumption of continued volatility in financial markets.
Our preference for a “barbell” diversified portfolio for many long-term investors remains our favored approach. This barbell could include high-quality big-cap U.S. growth stocks. We envisage Value and Cyclical type stocks remaining in such a diversified portfolio along with international stocks and a commodities exposure. Our forecast of a weaker USD could enhance the attractiveness of most of these investments.
Source: Goldman Sachs, Tracking Retail Net Buying Activity in US Stocks by Index, Sector and Style (2/17/2022)
Current Indicators – Change from Preceding Month

Forward-Looking Indicators – Expectation Six Months Ahead
Source: Federal Reserve Bank of New York, Business Leaders Survey (2/9/2022)
Current Indicators: Change from Preceding Month
Forward-Looking Indicators: Expectations Six Months Ahead

Source: Federal Reserve Bank of New York, Empire State Manufacturing Survey (2/9/2022)

Definitions:
NY Fed’s Business Leaders (Services) Survey – A monthly survey of service firms in New York State, northern New Jersey and southwestern Connecticut, conducted by the New York Fed.
The NY Empire State Index – The NY Empire State Index is the result of a monthly survey of manufacturers in New York state. Known as the Empire State Manufacturing Survey, it is conducted by the Federal Reserve Bank of New York. The headline number for the NY Empire State Index refers to the main index of the survey, which summarizes general business conditions in New York state
Consumer Price Index (CPI) – The Consumer Price Index (CPI) is a measure that examines the weighted average of prices of a basket of consumer goods and services, such as transportation, food, and medical care. It is calculated by taking price changes for each item in the predetermined basket of goods and averaging them.
Headline Inflation – Headline inflation is the raw inflation figure reported through the Consumer Price Index (CPI) that is released monthly by the Bureau of Labor Statistics. The CPI calculates the cost to purchase a fixed basket of goods, as a way of determining how much inflation is occurring in the broad economy. The CPI uses a base year and indexes the current year’s prices according to the base year’s values.
Core Inflation – Core inflation is the change in the costs of goods and services but does not include those from the food and energy sectors. This measure of inflation excludes these items because their prices are much more volatile. It is most often calculated using the consumer price index (CPI), which is a measure of prices for goods and services.
Producer Price Index (PPI) – The producer price index (PPI), published by the Bureau of Labor Statistics (BLS), is a group of indexes that calculates and represents the average movement in selling prices from domestic production over time. It is a measure of inflation based on input costs to producers.
Inflation Hawk (Hawkish) – An inflation hawk, also known in monetary jargon as a hawk, is a policymaker or advisor who is predominantly concerned with the potential impact of interest rates as they relate to fiscal policy. Hawks are seen as willing to allow interest rates to rise in order to keep inflation under control. EM
The People’s Bank of China (PBOC) – The People’s Bank of China is the central bank of the People’s Republic of China and is located in Beijing
Yield Curve – A yield curve is a line that plots yields (interest rates) of bonds having equal credit quality but differing maturity dates. The slope of the yield curve gives an idea of future interest rate changes and economic activity.
Re-opening trade – The reopening trade means buying stocks that will benefit from an open economy, domestically and globally.
Large-cap high quality growth stock – A large cap high quality growth company is a company with a market capitalization value of more than $10 billion that generally exhibits consistent earnings growth, does not utilize significant leverage and tends to increase in capital value rather than yield high income
IMPORTANT DISCLOSURES
The views and opinions included in these materials belong to their author and do not necessarily reflect the views and opinions of NewEdge Capital Group, LLC.
This information is general in nature and has been prepared solely for informational and educational purposes and does not constitute an offer or a recommendation to buy or sell any particular security or to adopt any specific investment strategy.
NewEdge and its affiliates do not render advice on legal, tax and/or tax accounting matters. You should consult your personal tax and/or legal advisor to learn about any potential tax or other implications that may result from acting on a particular recommendation.
The trademarks and service marks contained herein are the property of their respective owners. Unless otherwise specifically indicated, all information with respect to any third party not affiliated with NewEdge has been provided by, and is the sole responsibility of, such third party and has not been independently verified by NewEdge, its affiliates or any other independent third party. No representation is given with respect to its accuracy or completeness, and such information and opinions may change without notice.
Investing involves risk, including possible loss of principal. Past performance is no guarantee of future results.
Any forward-looking statements or forecasts are based on assumptions and actual results are expected to vary from any such statements or forecasts. No assurance can be given that investment objectives or target returns will be achieved. Future returns may be higher or lower than the estimates presented herein.
An investment cannot be made directly in an index. Indices are unmanaged and have no fees or expenses. You can obtain information about many indices online at a variety of sources including: https://www.sec.gov/fast-answers/answersindiceshtm.html or http://www.nasdaq.com/reference/index-descriptions.aspx.
All data is subject to change without notice.
© 2024 NewEdge Capital Group, LLC


