

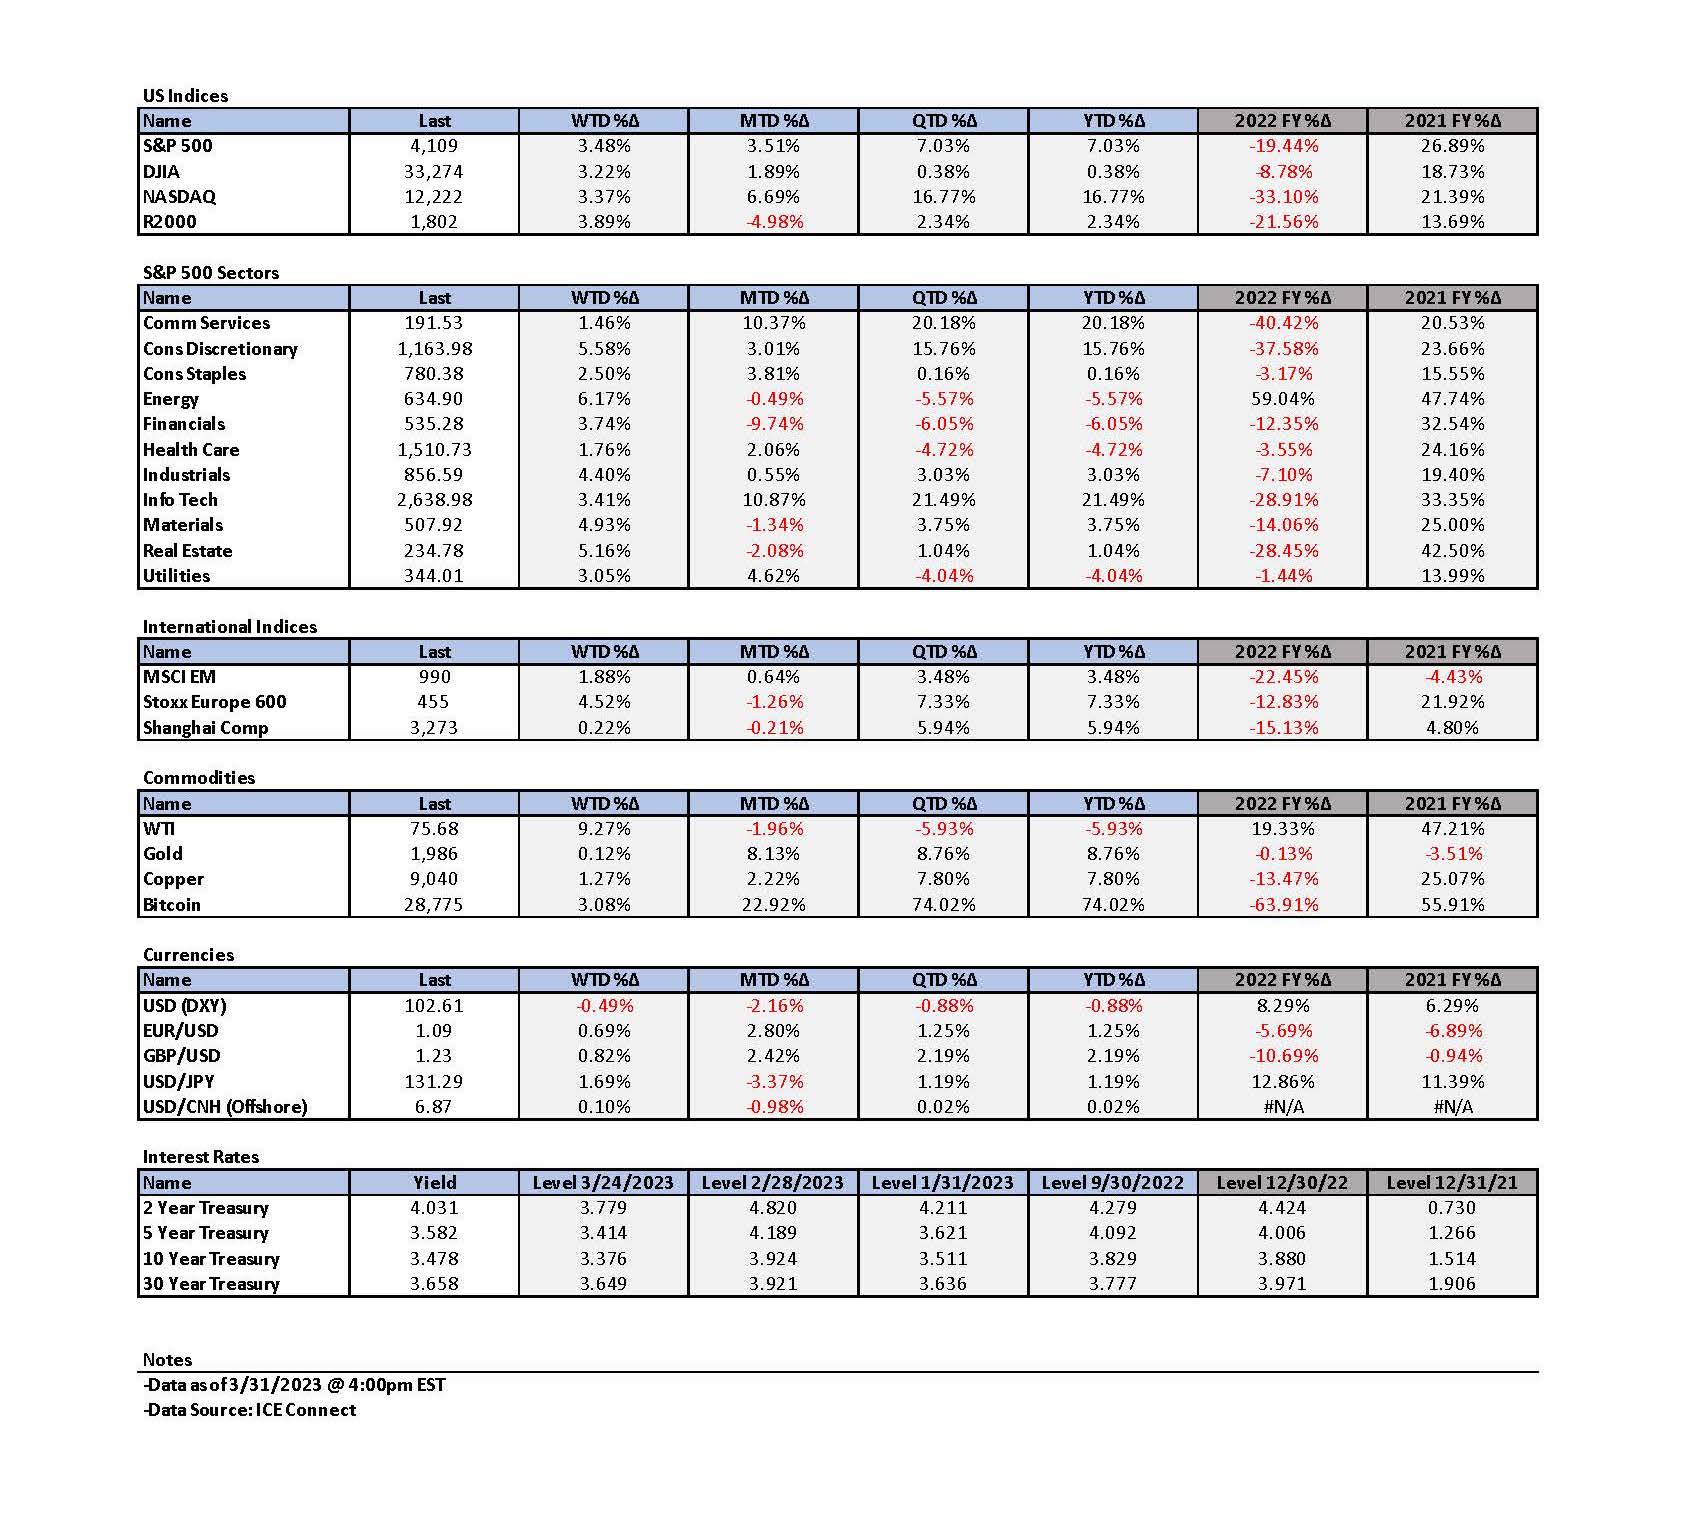
Weekly Summary: March 27 – 31
Key Observations:
- The Congressional hearings on the banking crisis this week have convinced us that more bank regulations will be forthcoming. The timing, content and extent of these changes remains uncertain. We remain concerned about deposit outflows and the increasing preference for money market funds. We still expect a credit contraction that should affect the economy in an uneven manner.
- Financial markets this week seem to be convinced that financial stability has been achieved. We remain concerned over the longevity of this apparent stability. We foresee a “bumpy” road ahead with many surprises. We view the world as more uncertain now than before the banking crisis. Many financial markets act like there is more certainty now. The relative dearth of market moving economic data this week might have enabled stocks to register broad gains across any sectors this week. Daily fluctuations across sectors this week indicated some signs of a lack of conviction of what type of stocks to buy. In this environment, we are not surprised to hear of light positioning.
- This week we saw signs of a general deterioration of consumer confidence and rising concerns over recession probabilities. This appeared to coincide with the lowering of one year ahead inflation expectations. Many stocks continued to appreciate this week as they appear to be focused on the expectation of lower interest rates when compared to pre-banking crisis expectations. When will stocks worry more about recession risks? Perhaps disappointing earnings and guidance could be the catalyst.
- There could be many “outlier” types of events or circumstances that could disrupt the complacency of market participants. We suggest that a sudden policy shift by the Bank of Japan (BOJ) could be such an outlier. A sudden shift by the BOJ to a less accommodative monetary policy could cause a massive shift in the flow of funds that might strengthen the yen and push global interest rates higher.
The Upshot: Our general investment approach remains the same as depicted in last week’s commentary. We maintain our preference for quality stocks with good balance sheets, relatively stable cash flows with stable margins. Volatility across sectors continues to be supportive of a diversified global portfolio for long term investors. We continue to stress that stock selectivity in the current environment is of paramount importance.
We will continue to recommend trimming positions after sufficient price appreciation no longer justifies “full” positions on a risk-adjusted basis. Our strategy includes only buying on downturns in price since we foresee continued volatility. We believe that selective growth and tech stocks should continue to command premium valuations in a slowing economy.
Are There Any Bad Guys in the Banking Crisis?
The banking crisis depicted in our last two commentaries commanded mostly the attention of Congress and various government officials this week as they tried to discern who the “bad guy” was – or who the bad guys were – who helped precipitate this crisis. In her song “bad guy”, Billie Eilish made it easy as she identified herself as the “bad guy.” We thought that one phrase in particular captured the essence of her persona in the song: “I do what I want when I’m wanting to.” We surmise that this might have been the attitude of many people who were involved in laying the foundation that could turn into the crisis that transpired. This could have been either through certain actions or certain inactions. It appears that sufficient risk controls, as well as sufficient supervision, were lacking. Most likely, insufficient communication also played a role. We leave it up to the reader’s judgement whether to classify anyone as a “bad guy” in this saga. After listening to some of the Congressional testimony this week, it seems that there are many people at “fault”, and that there is plenty of “blame” to go around. In general, we suppose that uncertainty has risen in regard to the Fed’s future monetary policies, economic and inflation growth trajectories, the extent and timing of credit contraction, as well as further tightening of financial conditions. The form and timing for more regulation of banks is also now uncertain. This uncertainty probably would be most acute in regard to those banks with assets of under $250 billion, which encompasses most regional banks.
Deposit Outflows and Money Market Funds
Many officials made comments to the effect that deposit outflows from U.S. regional banks had appeared to stabilize. But according to Bloomberg News on March 31, Fed data showed that for the week ended March 15, deposits at smaller banks dropped by $120 billion as they increased by almost $67 billion for the 25 largest banks. Money funds have also recently been benefitting from deposit outflows as deposit holders focus more on alternatives. According to the investment company institute, money market funds increased by $66 billion in the week ending March 29. Bloomberg estimates a record $5.2 trillion now resides in money market funds. Fewer deposits most likely translate into fewer loans. A 2020 FDIC report estimated that community banks with assets of $10 billion or less held 36% of small business loans.
Source: Goldman Sachs, Assessing the financial impact on regional banks from recent events (3-29-2023)
A Relative “Vacuum” of Information Provides Ideal Environment for U.S. Stocks to Rise this Week
In our opinion, there was little “market moving” information this week. We almost would characterize it as a “vacuum” of information. With assurances that the banking crisis had stabilized, the major U.S. stock indexes all rose through Thursday this week. Sector rotations were rather pronounced. The energy and financials sectors of the S&P 500 were the top performing sectors on Monday. Energy remained the top performing sector on Tuesday, and showed the most gains through Thursday. After languishing in the bottom quarter during the first two days this week, the info tech sector was rebounded to being second best on Wednesday and Thursday. Many U.S. tech and growth stocks have had very strong price gains this year. We have offered explanation of our preference for many of these growth stocks in prior commentaries, as well as our explanation for their continued outperformance.
Risk-Reward Prompts “Trimming” of Selected Stocks after Large Gains
In last week’s commentary we stated that “late Thursday morning we thought that it was highly likely that U.S. equities traded at a level that would be at least a short-term peak.” We were “correct” for four trading days for the S&P 500 and five days for Nasdaq. Admittedly, we thought that the short-term top would have lasted a little longer. But early Friday of last week, we also thought that energy stocks looked like they could be “bottoming.” Through Thursday of this week, the energy sector was the best performing sector of the S&P 500. Towards the end of last year, we also believed that energy stocks were due for a significant decline. We maintain our view expressed last week, that the risk-reward no longer justified full positions in many stocks. In particular, we were thinking of some of our preferred growth stocks that had appreciated substantially since their October lows as well as showing significant gains this year. We thought that such stocks could command a premium valuation in a slowing growth environment. But due to the increased uncertainties, many of which are depicted in this week’s commentary, we thought it advisable to trim these positions. We view this approach as merely adhering to our strategy since early in the pandemic. Only buy on market downturns, trim positions for long term investors after substantial gains, while maintaining “core” long term positions for favored stocks.
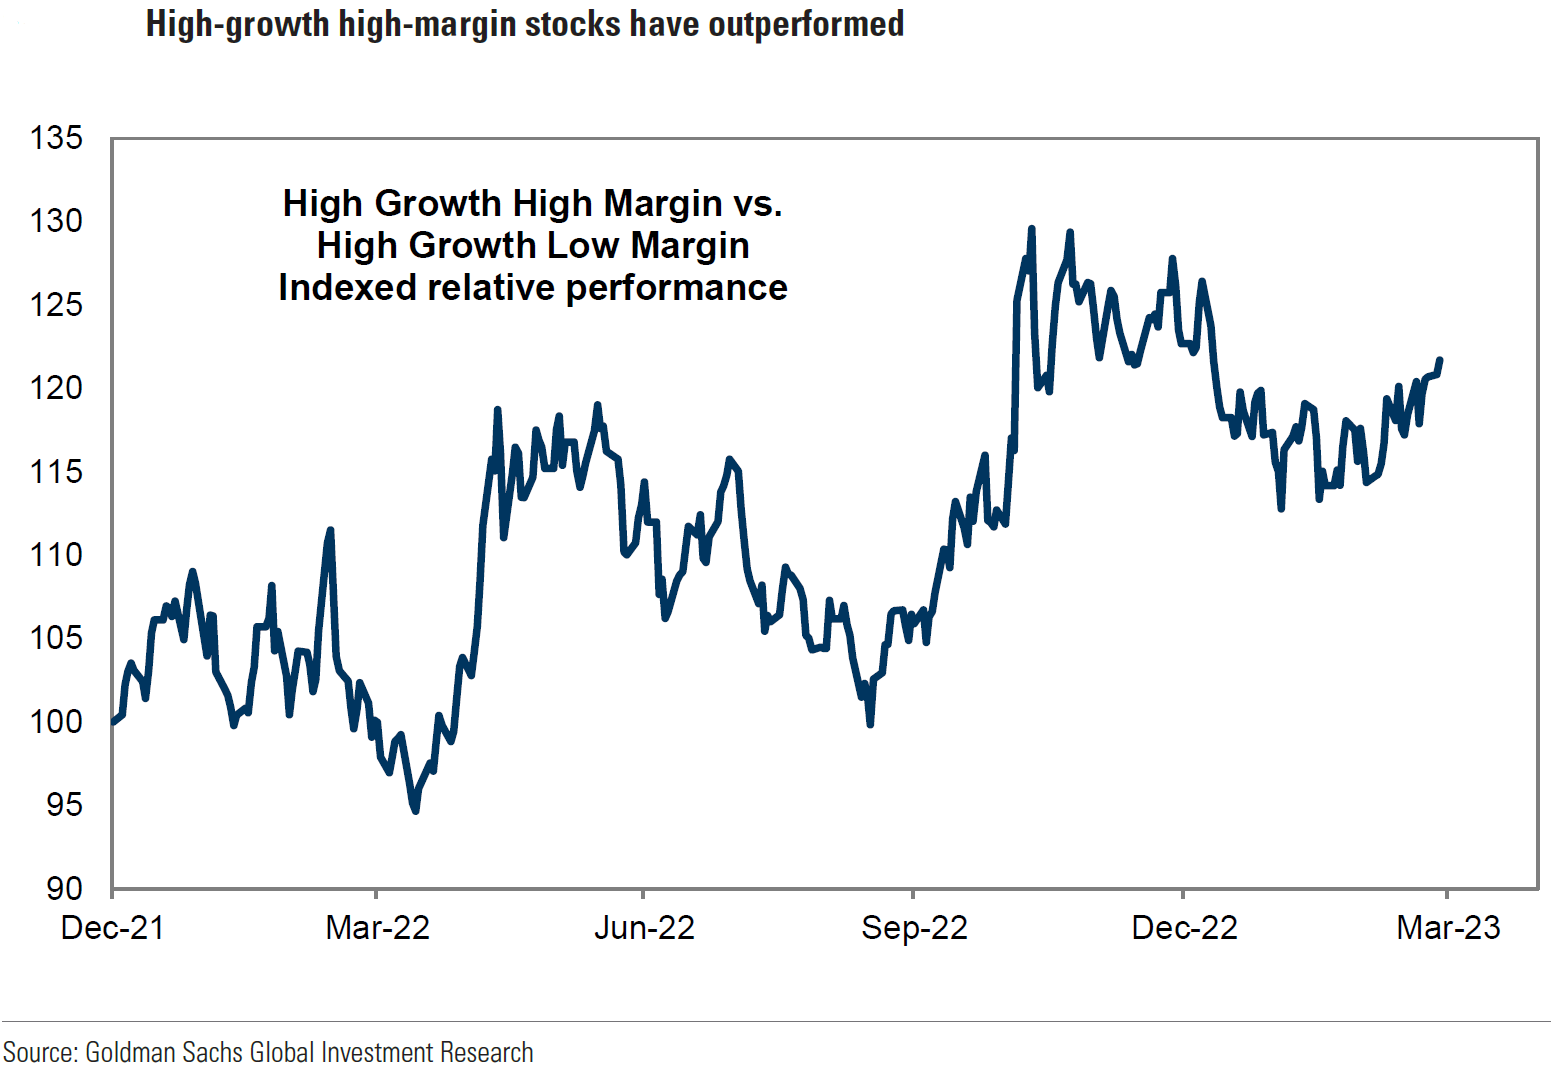
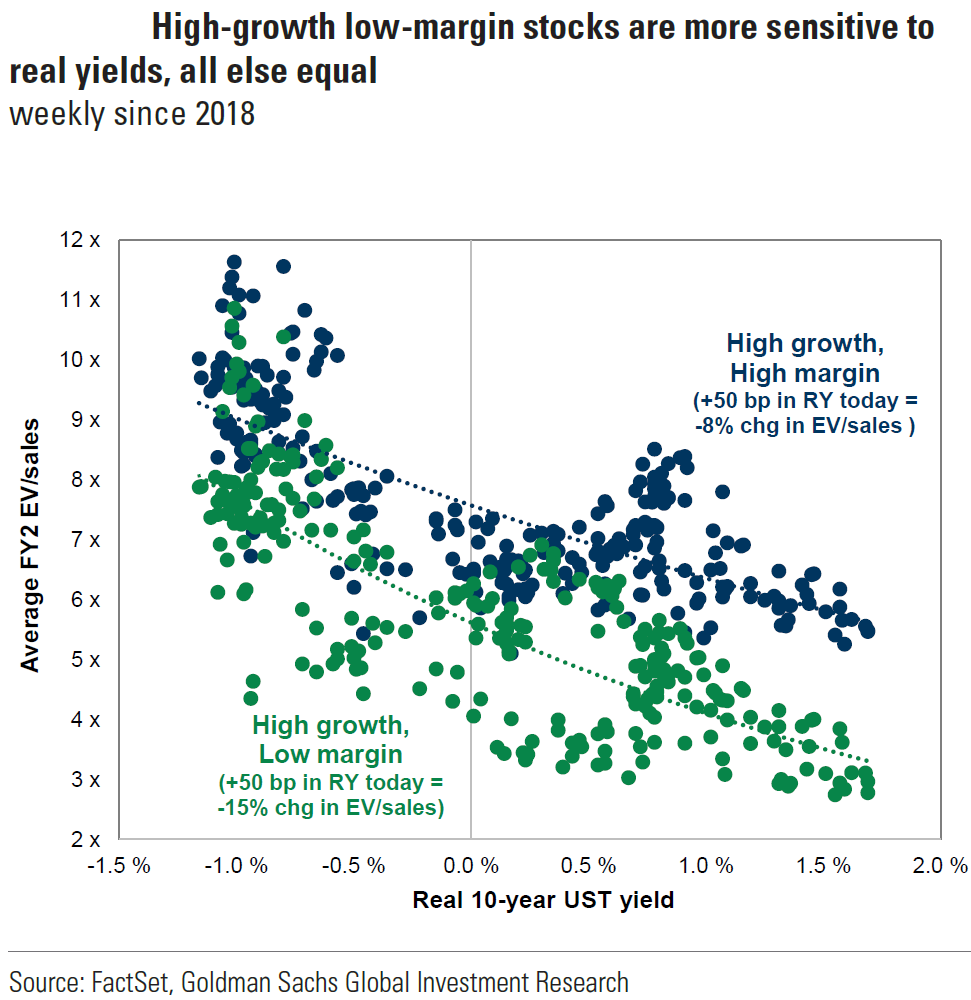
Source: Goldman Sachs, US Macroscope: Own high-margin vs. low-margin growth stocks (3-29-2023)
Fund Flows and Positioning are Still Important
On March 30, Bloomberg News highlighted the importance of “fund flows” and “positioning.” Bloomberg cited comments from Goldman’s Scott Rubner who has analyzed fund flows for two decades. “Current positioning is too short, too low VAR, low net … if the macro were to improve, we think that the pain trade goes back to the upside. This is a change in tone.” Rubner sees further stock gains, at least through April. In support of his forecast, Rubner referred to the bearish positioning of commodity trading advisers (CTAs). He estimated that CTAs are currently “betting about $26 billion against the S&P 500, near the largest short position since at least October 2021.” The latest Bank of America Corp. survey of money managers this month showed that their allocation to U.S. stocks fell to an eighteen-year low. This would seem to support Rubner’s views on positioning.
Senate Hearings on Banking Crisis
The Congressional hearings began on Tuesday with members of the Senate Banking Committee questioning federal regulators in an attempt to understand what went wrong to cause the U.S. banking crisis centered around the collapse of Silicon Valley Bank (SVB) and Signature Bank (SB). The three federal regulators questioned were chairman of the board of directors of the Federal Deposit Insurance Corporation (FDIC) Martin Gruenberg, under-secretary for domestic finance at the U.S. treasury Nellie Liang, and vice chairman for supervision at the Federal Reserve (Fed) Michael Barr. Barr characterized SVB’s failure as a “textbook case of mismanagement” that included “inadequate” risk management, as well as inadequate internal controls. Barr stated that SVB “waited too long to address its problems and, ironically, the overdue actions it finally took to strengthen its balance sheet sparked the uninsured depositors’ run that led to the bank’s failure.” Barr highlighted how SVB “leadership” failed to manage effectively interest rates and the risk of running out of cash. Just as Fed Chair Powell and the Treasury secretary Yellen had done prior to this hearing, Barr tried to instill “confidence” in the U.S. banking system. “Our banking system is sound and resilient, with strong capital and liquidity. We are committed to ensuring that all deposits are safe … and [we] are prepared to use all of our tools for any size institution, as needed, to keep the system safe and sound.” Gruenberg, who had been against the rollback of many protections in regard to smaller banks, used this hearing to reiterate his opinions. The SVB and SB failures “demonstrate the implications that banks with assets over $100 billion can have for financial stability. The prudential regulation of these institutions merits serious attention, particularly for capital, liquidity, and interest rate risk.” Barr agreed: “I anticipate the need to strengthen capital and liquidity standards for firms over $100 billion.” Liang also saw the need to “strengthen” rules for banks. Gruenberg and Barr indicated that they were considering ‘’serious” action against the people who ran SVB and SB. Maybe there were some “bad guys” after all.
House Hearings on Banking Crisis
On Wednesday, the hearings continued before the House Financial Services Committee. The chairman of this committee Patrick McHenry, R-N.C. stated “We need competent financial supervisors. But Congress can’t legislate competence.” The Committee’s ranking member Maxine waters, D-Cal questioned the regulators’ role. “The light touch cautions from the Fed to SVB managers are clearly not what Congress intended for bank supervision.” She promised that legislation will be forthcoming. Barr added: “I expect that we’re going to find that we need to have more of an emphasis on supervisors using tools they have more promptly … when they see problems at banks that they’re supervising.”
Possible New Banking Regulations
On March 30, Goldman Sachs (Goldman) relayed a few “key takeaways” from their discussions with current and former “policymakers.” One of the conclusions was that it was “likely” that additional regulations around “capital and liquidity metrics” could be coming for regional and large-cap banks. Regulatory changes most likely would affect the availability and cost of making loans. Goldman observed that some of the policymakers they contacted “believe that increasing capital requirements may have a smaller social cost than many believe, whereas increasing liquidity requirements can have more of a dramatic impact on balance sheets and thus on bank business models, and thus they see higher capital as a potentially beneficial change.” Goldman also found limited support for a full guarantee of all deposits.
More Regulation Could = More Uncertainty
According to Yahoo! Finance on March 30, President Biden’s administration is asking that federal regulators reimpose certain regulations that would not need further legislation. Under a bipartisan bill passed in 2018, the Fed decided in 2019 to exempt banks with $100-$250 billion in assets from maintaining a standardized “liquidity coverage ratio.” On March 30, the White House “encouraged” bank regulators to reinstate liquidity requirements for these banks and to use “rigorous liquidity stress tests that factor in the risks of faster withdrawals in an always-on online environment.” The administration also encouraged regulators to consider “strong capital requirements [for banks] at an appropriate time after a considerable transition period.” Goldman’s discussions with policymakers seemed to indicate a preference for stronger capital requirements, which they thought would have less of an impact on lending. It is our conclusion that more bank regulation will become a reality at some point. The timing and details of any changes in bank regulations only adds to the uncertain environment. We assume that any regulatory changes will exacerbate the anticipated slowdown in credit creation that will lead to tighter financial conditions. This should slow the U.S. economy even more than anticipated. Additionally, this should also help rein in inflation. We anticipate that tighter financial conditions due to less available credit will have a more “uneven” effect on the U.S. economy than if financial conditions had tightened solely from tighter Fed monetary policies. Such an environment should enhance the attractiveness of high-quality companies with good balance sheets, steady cash flow and healthy margins – the type of companies that we have been recommending for quite some time.
More Uncertain Earnings Guidance
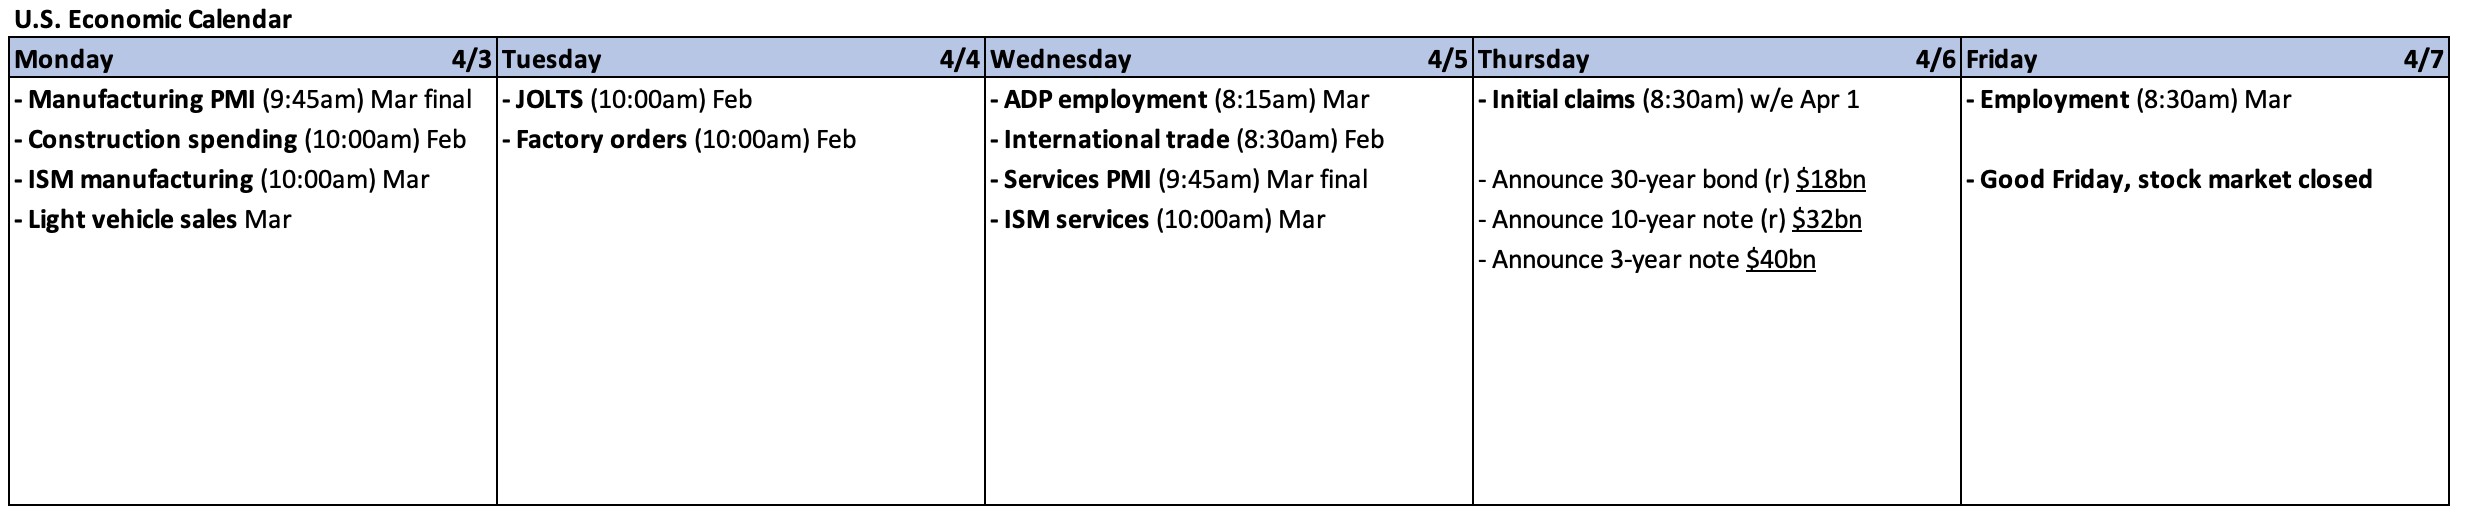
Given the increased uncertainty in regard to tightening credit conditions due to the banking crisis and possible regulatory changes, we anticipate that earnings guidance might become more problematic as companies begin to report first-quarter earnings in mid-April. Many banks will be at the forefront in reporting their earnings. Given the rapidly changing environment, we expect more uncertainty than would be typical. We hope to get a better picture for what might be expected for future bank earnings. Many parameters on which we will focus in regard to banks, will include loan loss reserves, expected future loans, concentration of deposits, percent of deposits that are not insured, industry concentrations, further tightening of lending standards, funding costs, deposit inflows and outflows, and projected net interest income. We surmise that the guidance from many banks might help us to ascertain the availability and cost of credit for various businesses, accounting for both size and type of industry.
Source: Goldman Sachs, What’s Top of Mind in Macro Research: Continued focus on bank stresses (3-29-2023)
On March 24, Goldman estimated that the consensus bottom-up 2023 S&P 500 earnings estimate was $222. As of the close on March 30, that would yield a P/E ratio of roughly 18.25. Estimates will continue to change as earnings are announced. According to the latest available Earnings Insight report dated March 16 from FactSet, the estimated earnings decline for Q1 was -6.1%. On December 31, the earnings for Q1 were expected to decline only -0.3%. For Q1, 83 S&P 500 companies already have given negative earnings guidance and 25 have given positive guidance. According to Reuters on March 31, Citigroup equity strategists were now anticipating a 5% contraction in 2023 global profits due to the banking crisis and increased risks of recession. They also upgraded the technology sector to “overweight” since it was less affected by business cycles. A little late to the “party” perhaps?
Consumer Confidence Slips
As uncertainties continue to seemingly multiply, we will continue to monitor closely consumer confidence that might provide a forewarning of an economic slowdown. The Conference Board’s Consumer Confidence Index increased in March to 104.2 from an upwardly revised 103.4 (by +0.5pt) in February and against expectations for a decrease to 101.0. The present situations component fell to 151.1 from 153.0, while the expectations component increased to 73.0 from 70.4. The expectations component has been below 80 for twelve of the last thirteen months. Below 80 is considered a level that might indicate a recession within twelve months. The senior director of economics at The Conference Board stated that the expectations gain “reflects an improved outlook for consumers under 55 years of age and for households earning $50,000 and over.” The labor market differential – the difference in the number of consumers saying that jobs are plentiful and those saying that jobs are hard to get — fell 1.9pt to 38.8. The cutoff date for this survey was March 20, about 10 days after SVB was closed. We would characterize this survey as “lackluster.”
The final results for March of the University of Michigan’s consumer sentiment disappointed as it was revised down to 62 from the preliminary 67 level and fell for the first time in four months. The gauge for expectations was revised lower to 59.2 from 61.5. The commentary accompanying the survey did not think that the SVB turmoil affected the results. “Overall, our data revealed multiple signs that consumers increasingly expect a recession ahead.” Like The Conference Board’s Consumer Confidence Index, it was the poorer, less educated, and younger consumer that was most disappointing. However, year ahead inflation expectations were encouraging as they dropped to 3.6% from February’s reading of 4.1% and from the preliminary 3.8% level. This was the lowest reading since April 2021.
PCE Price Inflation Less than Expected
The Fed’s preferred measure of inflation, the various Personal Consumption Expenditures (PCE) price indexes were generally lower than expected. The headline PCE price index rose 0.3% month-over-month (m/m) versus 0.2% expected and 0.6% m/m in January. The y/y gain was 5.0% versus a downwardly revised 5.3% y/y gain in January, which was also expected for February. The core PCE prices (excluding food and energy prices) increased 0.3% m/m and 4.6% y/y, compared to expectations of 0.4% m/m and 4.7% y/y. The core y/y PCE price index also was 4.7% higher in January. Personal income increased 0.3%m/m versus an expected increase of 0.2%. Consumer spending fell short of the 0.3% expectations with a reading of 0.2% m/m. Financial markets reacted favorably in general to these numbers.
U.S. Housing Market Shows Signs of Stabilization but Still Sensitive to Mortgage Rates
U.S. home prices continued to show signs of weakness, but less so than expected. The Federal Housing Finance Agency (FHFA) home price index rose 0.2% m/m and 5.3% y/y in January. A decrease of 0.2% m/m was expected. December saw a 0.1% decline and a y/y increase of 6.7%. The S&P/Case-Shiller home price index decreased by 0.43% m/m in January versus an expected 0.5% decline and versus a revised decrease of 0.53% in December. Case-Shiller’s home price index rose 3.8% y/y in January versus a gain of 5.6% y/y in December. The New York Fed also published encouraging expectations for decelerating home price trends for February this week. Shelter costs have been a very “sticky” component of core inflation. Average one-year-ahead home price growth expectations fell to 2.6% in February from 7.0% in February 2022. This was the lowest reading since the inception of this series in 2014. The previous record low for one year ahead expectations was 3.3% in 2016. Expectations for rent increases also moderated from 11.5% a year ahead expectations in 2022 to 8.2% in February. This was still relatively high by historical standard. According to Rent.com rental prices dropped for the third consecutive month in February and for the 5th month out of the last six. The y/y increase in rental prices rose by 1.7% in February compared to mostly double digit increases for most of 2022. Moody’s Analytics now expects rents to increase in the 2.5% to 3.0% range for 2023.
Pending U.S. home sales rose 0.8% m/m in February but were 21.1% lower y/y. An expected 2.3% decline was expected after a jump of 8.1% m/m in January. The volatility in the 30-year fixed rate mortgage continues to be the principal swing factor in pending home sales. According to the National Association of Realtors, February began with the 30-year mortgage around 65 and ended the month just over 7%.
Will BOJ Surprise?
The Bank of Japan’s (BOJ) next meeting is on April 27 – 28. This will be the new governor Kazuo Ueda’s first meeting. There has been speculation that the BOJ’s yield curve control (YCC) policy might be further relaxed. According to Bloomberg News on March 30, the International Monetary Fund (IMF) said that the BOJ should avoid a “premature” exit from its monetary easing policies. The IMF said that “any changes to monetary policy settings will need to be well communicated to facilitate smoother transitions and protect financial stability.” We will try to monitor BOJ developments very closely. To the extent the BOJ modifies its YCC policy to allow Japan’s 10-year sovereign bond yield to increase, this could cause massive flows back into yen denominated assets that could push USD lower and push many other countries’ bond yields higher.
Bottom Line
For the time being we are maintaining our basic investment approach as expressed in last week’s commentary. We continue to prefer high quality stocks that offer good balance sheets, as well as relatively stable cash flows and profit margins. We prefer a very diversified global portfolio for long term investors. We continue to stress that stock selectivity in this current financial environment is of paramount importance.
We will continue to recommend trimming positions after sufficient price appreciation no longer justifies “full” positions on a risk-adjusted basis. Our strategy includes only buying on downturns in price since we foresee continued volatility. We believe that selective growth and tech stocks should continue to command premium valuations in a slowing economy.
Definitions:
Value at Risk (VaR) – Value at risk is a statistic that quantifies the extent of possible financial losses within a firm, portfolio, or position over a specific time frame. This metric is most commonly used by investment and commercial banks to determine the extent and probabilities of potential losses in their institutional portfolios.
Positioning – A position is the amount of a security, asset, or property that is owned (or sold short) by some individual or other entity.
Fund flows – Fund flow is the cash that flows into and out of various financial assets for specific periods of time. It’s usually measured on a monthly or quarterly basis.
Headline PCE Inflation – A measure of the prices that people living in the United States, or those buying on their behalf, pay for goods and services. The PCE price index is known for capturing inflation (or deflation) across a wide range of consumer expenses and reflecting changes in consumer behavior.
Core PCE Inflation – A measure of the prices that people living in the United States, or those buying on their behalf, pay for goods and services that excludes food and energy prices. The core PCE gives a more accurate reading of inflation because food and energy are very volatile parts of the economy.
NASDAQ – The Nasdaq Composite Index is the market capitalization-weighted index of over 2,500 common equities listed on the Nasdaq stock exchange.
S&P 500 – The S&P 500 is a total return index that reflects both changes in the prices of stocks in the S&P 500 Index as well as the reinvestment of the dividend income from its underlying stocks.
Federal Housing Finance Agency (FHFA) – The Federal Housing Finance Agency is U.S. regulatory agency that oversees the secondary mortgage market and players within it. Established in 2008, the FHFA’s responsibilities include supervising Fannie Mae and Freddie Mac, as well as the 11 banks that comprise the Federal Home Loan Bank (FHLB) System and the Office of Finance (OF), a joint office of the FHLBanks.
Conference Board Consumer Confidence Index (CCI) – The Consumer Confidence Index measures how optimistic or pessimistic consumers are regarding their expected financial situation. The CCI is based on the premise that if consumers are optimistic, they will spend more and stimulate the economy but if they are pessimistic then their spending patterns could lead to an economic slowdown or recession.
Federal Housing Finance Agency (FHFA) – The Federal Housing Finance Agency (FHFA) is a U.S. regulatory agency that oversees the secondary mortgage market.
Case-Shiller Housing Index – The Case-Shiller Index, formally known as the S&P CoreLogic Case-Shiller U.S. National Home Price NSA Index, is an economic indicator that measures the change in value of U.S. single-family homes on a monthly basis.
IMPORTANT DISCLOSURES
The views and opinions included in these materials belong to their author and do not necessarily reflect the views and opinions of NewEdge Capital Group, LLC.
This information is general in nature and has been prepared solely for informational and educational purposes and does not constitute an offer or a recommendation to buy or sell any particular security or to adopt any specific investment strategy.
NewEdge and its affiliates do not render advice on legal, tax and/or tax accounting matters. You should consult your personal tax and/or legal advisor to learn about any potential tax or other implications that may result from acting on a particular recommendation.
The trademarks and service marks contained herein are the property of their respective owners. Unless otherwise specifically indicated, all information with respect to any third party not affiliated with NewEdge has been provided by, and is the sole responsibility of, such third party and has not been independently verified by NewEdge, its affiliates or any other independent third party. No representation is given with respect to its accuracy or completeness, and such information and opinions may change without notice.
Investing involves risk, including possible loss of principal. Past performance is no guarantee of future results.
Any forward-looking statements or forecasts are based on assumptions and actual results are expected to vary from any such statements or forecasts. No assurance can be given that investment objectives or target returns will be achieved. Future returns may be higher or lower than the estimates presented herein.
An investment cannot be made directly in an index. Indices are unmanaged and have no fees or expenses. You can obtain information about many indices online at a variety of sources including: https://www.sec.gov/fast-answers/answersindiceshtm.html or http://www.nasdaq.com/reference/index-descriptions.aspx.
All data is subject to change without notice.
© 2024 NewEdge Capital Group, LLC


