

Weekly Summary – May 1 – May 5
Key Observations:
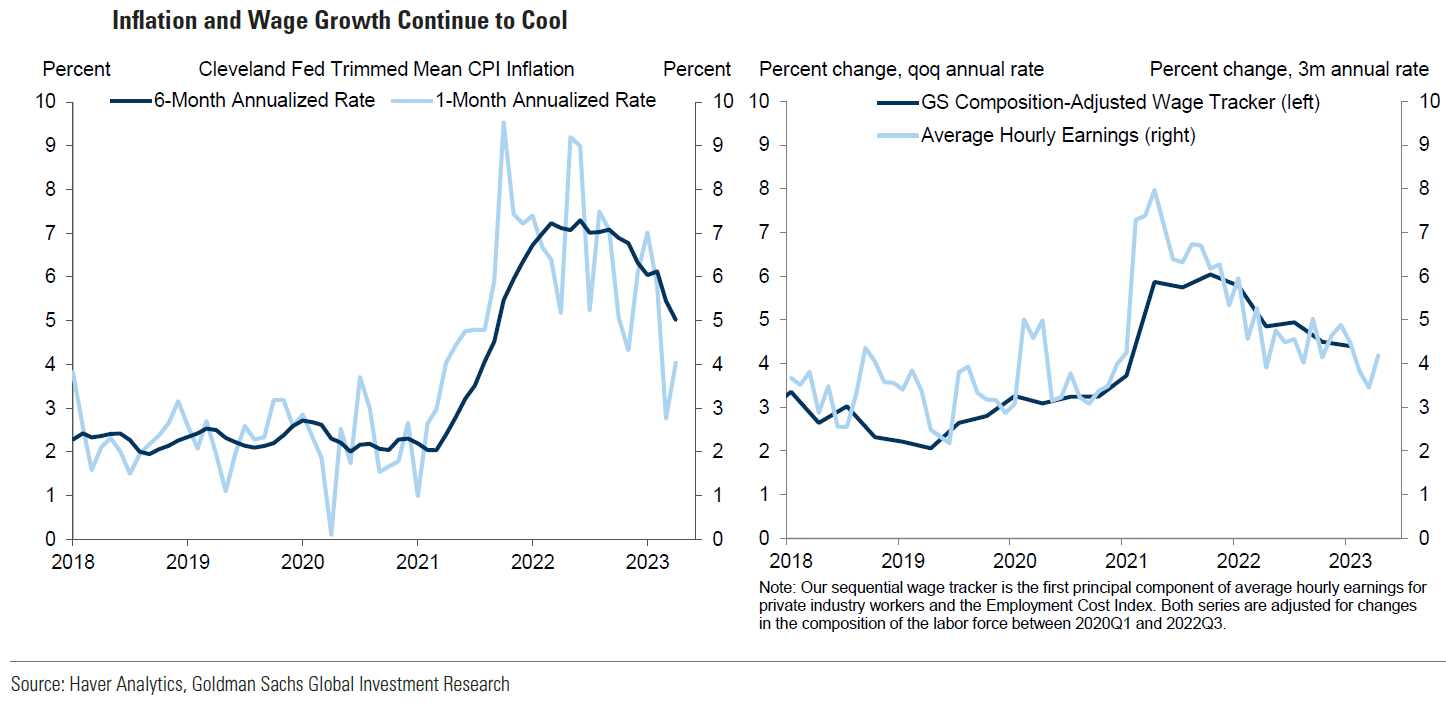
- Our base case remains that the Federal Reserve (Fed) will “pause” its rate hikes at its next meeting in June and that it will not cut the federal funds rate for “some time.” We thought that U.S. core CPI for April confirmed our opinion that it should continue to trend lower this year. The lower-than-expected April PPI readings were also helpful in this regard. But we wish to emphasize again that this could be a “bumpy” path towards a lower inflation rate. We maintain our belief that the downward trajectory of inflation might stall at roughly the 3.5% to 4.0% levels. This is merely our best “guess.” We assume that U.S. wage growth must be lower to reach the Fed’s targeted 2% rate of inflation. Powell has indicated that he thinks a wage growth rate approaching 3% would be compatible with the Fed’s 2% target. On May 11, Goldman Sachs stated that its “wage tracker has continued to slow from a peak of 6% in early 2022 to 4.5% in early 2023.” We remain hopeful that the downtrend in wage growth might accelerate soon.
- The New York Fed’s national April survey of consumer expectations showed lowered expectations in regard to future growth in household income and spending. Less optimism for finding another job if one was terminated was also noteworthy. Year ahead inflation expectations were tempered somewhat after March’s dramatic rise. But inflation expectations for three and five tears ticked higher, much like the most recent University of Michigan’s survey of consumer sentiment.
- The latest European Central Bank (ECB) survey of consumer expectations showed a “significant” rise in one-and three-year inflation expectations. Europeans were also slightly more dour about future economic growth in the Eurozone. Investor sentiment in Europe dropped more than expected in May. We thought that these two Eurozone surveys corroborated the others’ most recent “problematic” trends. The University of Michigan’s consumer sentiment data appeared to echo most of the recent Eurozone surveys referred to in this week’s commentary.
- Given all of the uncertainties surrounding economic growth rates and possible inflation trajectories, we were not surprised that the Fed decided to cease its forward guidance and substitute instead a data dependent approach that provides a “blank space” where the Fed can “write” its next policy decisions. The continuing instability of regional banks is but one of many uncertainties confronting investors. PacWest Bancorp disclosed in a regulatory filing on Thursday that there was an outflow of 9.5% of its deposits in just two days after it disclosed that it was in “talks” with potential investors. Pacwest’s stock was down by over 20% that day. The extent and magnitude of a credit contraction remains a key unknown. When and how the debt ceiling of the U.S. gets resolved remains another unknown.
The Upshot: our general investment approach remains the same as depicted in last week’s commentary. We maintain our preference for quality stocks with good balance sheets, relatively stable cash flows with stable margins. Volatility across sectors continues to be supportive of a diversified global portfolio for long term investors. We continue to stress that stock selectivity in the current environment is of paramount importance.
Through early Friday afternoon the two-year Treasury yield was comfortably higher during this week, in contrast to the 10-year yield, leading to a more inverted two-to 10-year Treasury yield curve. USD as represented by DXY was over 1% higher for the week and the major U.S. stock averages were lower for the week. We continue to see many factors that point to an elevated risk of a U.S. recession accompanied by elevated, although slowing rates of inflation. Once again, the “pain” trade appears to be stocks trading higher. On May 11, Societe Generale commented on extreme short positioning by hedge funds in the S&P 500. According to data compiled by Bloomberg and disclosed on May 11, the “net short positioning on the S&P 500 stands near levels seen only during the global financial crisis.” In our experience, in an environment of much uncertainty and little conviction, “positioning’ can be determinative of short-term market movements.
Fed Leaves a “Blank Space” for Upcoming Meetings
In many of our recent commentaries, we have observed numerous warning signs that U.S. economic growth is slowing and that inflation rates remain elevated, even as they show signs of moderating. In last week’s commentary, we analyzed the Fed’s decision to “pause” its rate hikes at the next Federal Open Market Committee’s (FOMC or Committee) meeting in June, and to remain “data dependent” thereafter with little or no forward guidance. Much like in Taylor Swift’s song “Blank Space,” the Fed has left us with a “blank space” before they decide to “write” the next policy decision. We remain very hopeful that the U.S., economy is not “gonna go down in flames … [and that the Fed’s tightening monetary policies] was worth the pain.” In this regard, we believe that it is “critical” that the U.S. debt ceiling be raised in a “timely” manner. We viewed the postponement of Friday’s White House (WH) meeting with Congressional leaders as a hopeful sign of resolving the debt ceiling crisis since a WH spokesman said that “staff[s] will continue working and all participants agreed to meet early next week.” According to people familiar with the talks, the delay reflects progress in staff level discussions. On May 12, Reuters reported that WH “officials acknowledged that they must accept some spending cuts or strict caps on future spending if they are to strike a deal.” Throughout the Fed’s monetary tightening cycle, we believe that the Fed can claim “don’t say I didn’t, say I didn’t warn ya” as to what to expect. In the meantime, both the Fed and the incoming economic data will “keep [us] second guessing.” Uncertainty and sometimes conflicting economic data have kept the major U.S. stock indexes range bound this week through Thursday, which has extended the relatively narrow overall equities trading range since the beginning of Q2. While the two-to 10-year Treasury yield curve has become less inverted – or more “steep” – interest rates have continued to be more volatile on a daily basis relative to equities. U.S. dollar (USD) trading has been rather muted recently.
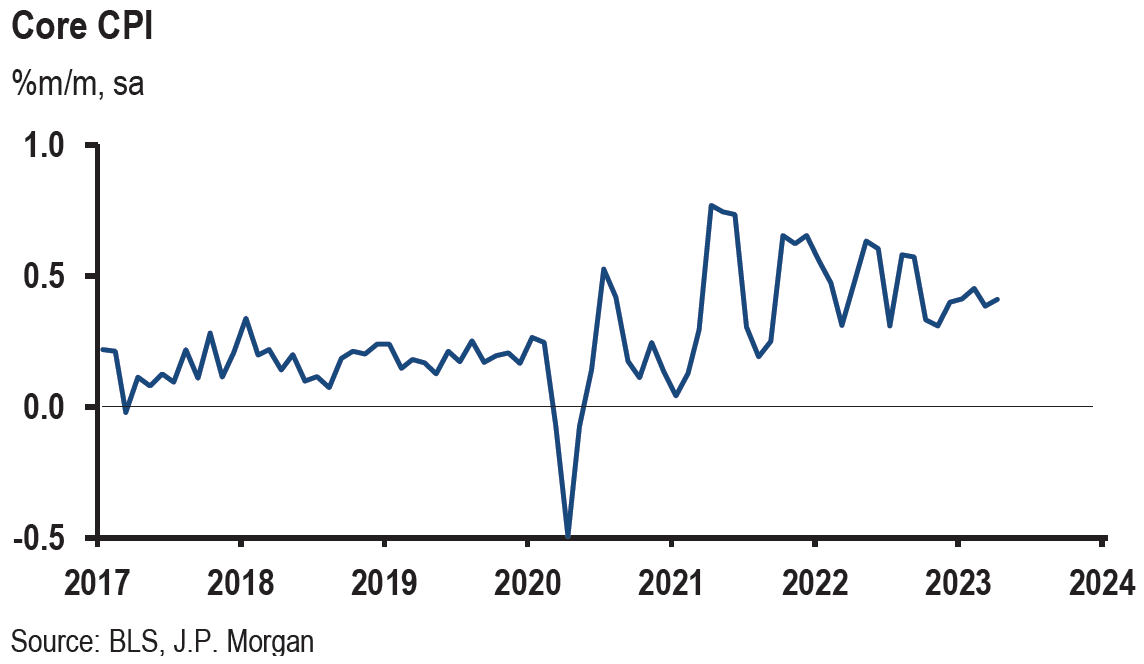
U.S. CPI April Details Confirm Our Optimism that Core CPI (Ex-Food and Energy) Should Continue to Trend Lower this Year
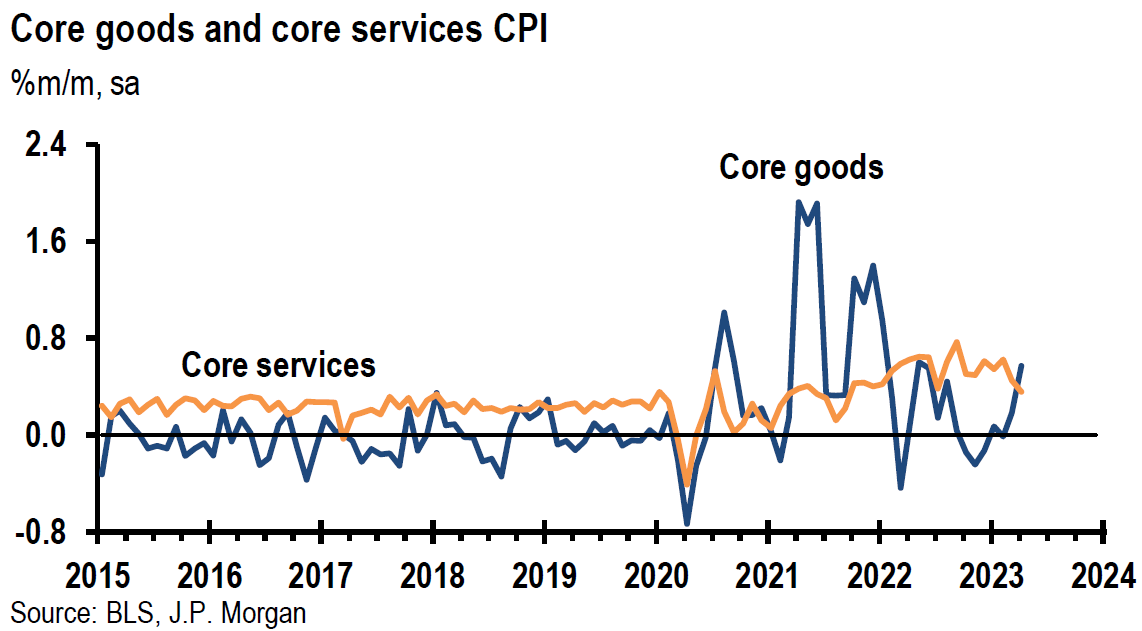
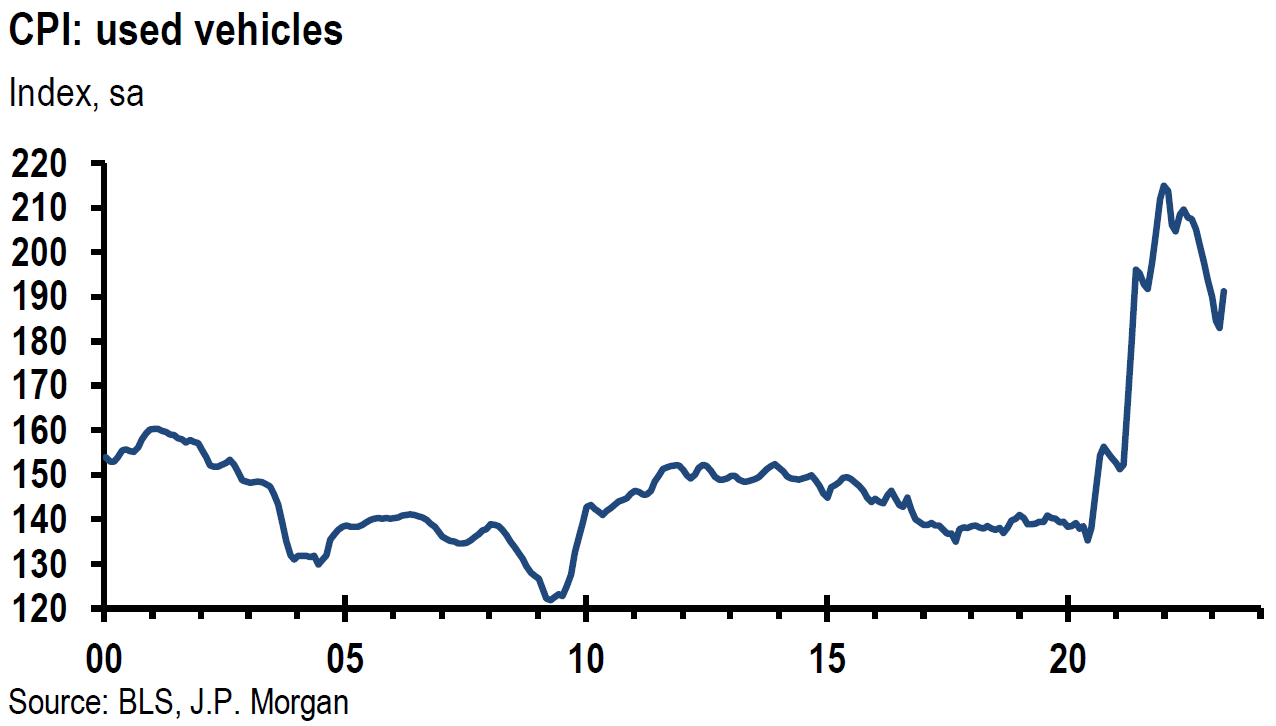
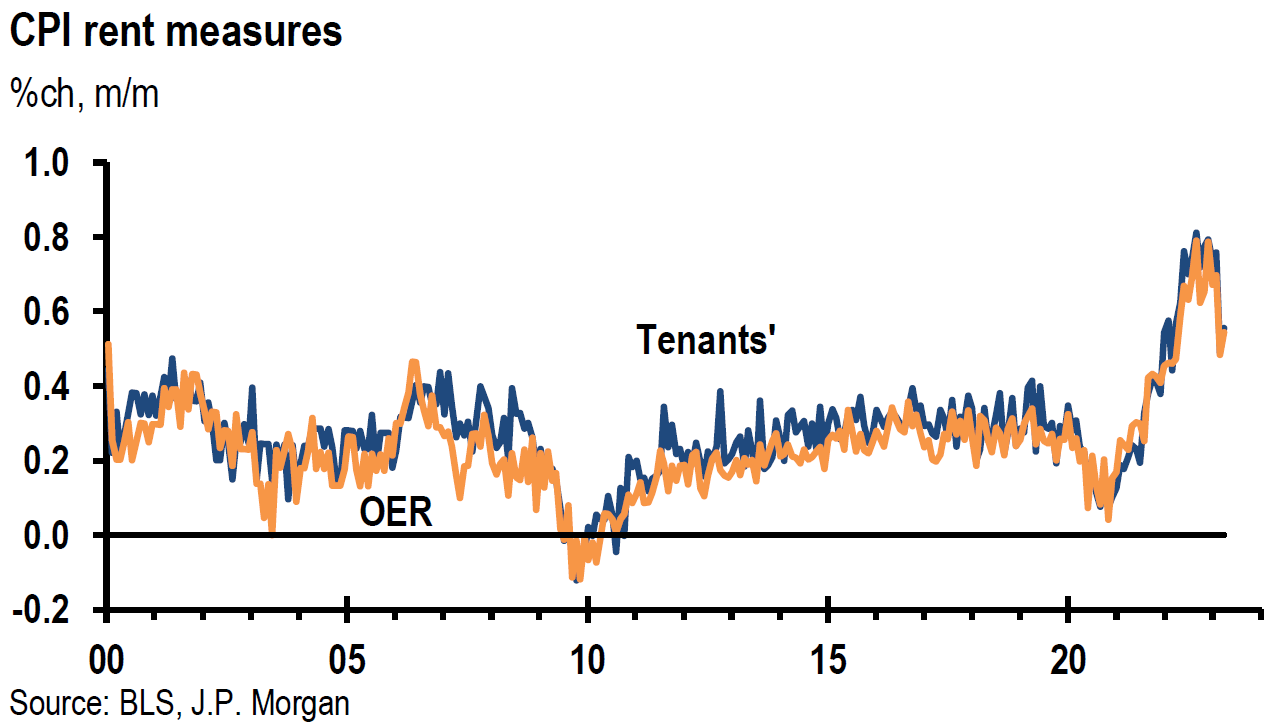
The most anticipated economic data this week was the U.S. Consumer Price Index (CPI) report for April that was released midweek. Headline and core CPI both rose 0.4% month-over-month (m/m) as expected. Headline CPI rose 4.9% year-over-year (y/y), slightly lower than the expected 5.0% rate, and was the lowest annual increase since April 2021. This measure hit a peak of 9.1% last June. Core CPI increased 5.5% y/y as expected. Shelter costs, which account for more than 30% of the total CPI “basket”, dropped from an increase of 8.2% the previous month to 8.1% y/y in April. This was the first annual decline in two years. On a monthly basis, rent and owner equivalent rent (OER) increased more than March’s rates, but maintained their downward trajectory from February’s levels. Rent was 0.56% higher m/m in April compared to 0.49% in March and 0.76% for February. Similarly, OER rose 0.54% m/m in April, 0.48% in March and 0.70% in February. Core services prices, excluding rent and OER, increased only 0.11% m/m, which is the smallest gain since last July. This is Fed chair Powell’s “super core” services measure, which he deems as perhaps the most “sticky” inflation and as most closely correlated with wage growth. We expect the 4.4% increase in used vehicle prices to resume its recent downward trajectory soon as the Manheim index of used vehicle prices fell 3.1% m/m in April. While new vehicle prices were 0.2% lower m/m, the monthly increase in used vehicle prices was the largest since June 2021. This category contributed 0.14 percentage points (pp) to the monthly gain in core CPI. Food prices were flat for the second consecutive month and might help dampen consumers’ inflation expectations. Energy prices were 0.6% higher m/m, mostly due to a 2.8% m/m increase in gasoline prices.
Source: JP Morgan, Signs of hope in the April CPI (5-10-2023)
U.S. PPI April Monthly Increases at or Below Expectations
The headline Producer Price Index (PPI) increased 0.2% m/m in April, below an expected 0.3% gain. Eighty percent of this increase was due to a 0.3% rise in services costs. This was the largest monthly gain since last November and reflected a large 4.1% m/m increase for portfolio management services. Core PPI – excluding food and energy – gained 0.2% m/m as expected. Furthermore, core PPI – excluding food, energy and trade services – also gained 0.2% but was below the expected 0.3% increase. Food prices declined 0.5% m/m while energy prices were 0.8% higher, mainly due to an 8.4% increase in gasoline prices. This translated into a 0.2% increase in goods prices. Headline PPI prices eased for the tenth consecutive month to gain 2.3% y/y in April. This was the lowest annual gain since January 2021. On an annual basis, core PPI – excluding food, energy and trade services – was 3.4% higher y/y, the lowest since early 2021.
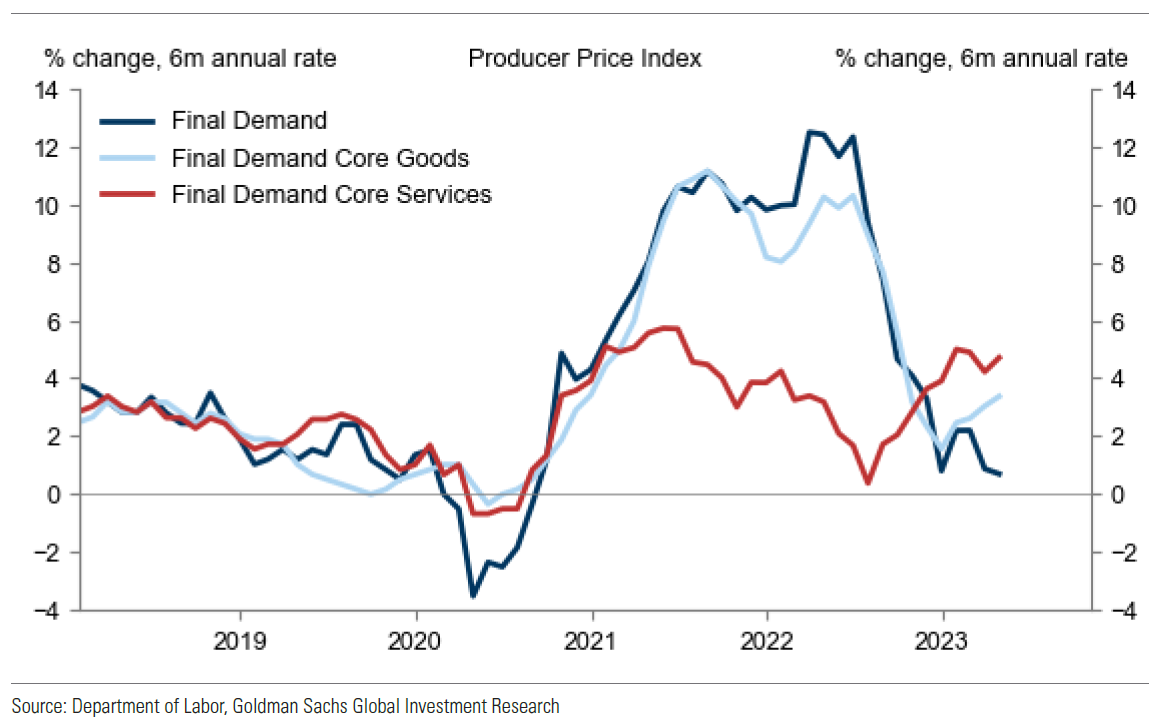
Source: Goldman Sachs, USA: PPI Below Consensus Expectations; Estimating April Core PCE Inflation of +0.29%; Unusual Jump in Massachusetts Initial Claims (5-11-2023)
New York Fed April Survey of Consumer Expectations – Lower Generally
The New York Fed April Survey of Consumer Expectations (SCE) is a national internet-based survey of a rotating panel of approximately 1,300 households. Following a large gain last month, median one-year-ahead inflation expectations gave back 0.3% of that increase to now expect a 4.4% increase in inflation. Inflation expectations over three-year and five-year time horizons both increased 0.1% to now expect inflation increases of 2.9% and 2.6%, respectively. Confirming our recent commentaries’ notion of a bottoming U.S. housing market, median home price growth expectations increased 0.7% to 2.5% in April, the highest reading since last July. “The mean perceived probability of finding a job (if one’s current job was lost) dropped from 57.6% in March to 55.2% in April, the lowest reading since September 2021. The decline was driven by respondents with at least some college education.” The median expected increase in household income declined 0.2% to 3.1% and household spending growth expectations declined from 5.7% in March to 5.2% in April.
European Central Bank (ECB) March Survey Shows Consumer Expectations for Eurozone Inflation Rose “Significantly”
This survey showed that inflation expectations for Europeans and Americans are roughly in line with one another. European one-year inflation expectations increased from 4.6% in February to 5.0% in March. Three-year-ahead inflation expectations rose from February’s survey of 2.4% to 2.9%. The ECB noted that uncertainty about one-year-ahead inflation expectations reached its highest level since this survey began. Consumers also became slightly more pessimistic as they cut their one-year-ahead European economic growth projections from -0.9% to -1%. On May 4, ECB president Christine Lagarde might have been referring to this survey when she stated that “although most measures of longer-term inflation expectations currently stand at around 2%, some indicators have edged up and warrant continued monitoring.” The Eurozone inflation rates are generally higher than those of the U.S., as headline inflation rates have slowed to roughly 7% from their double-digit peaks, and core inflation rates remain close to their peaks.
Eurozone Sentix Investor Confidence Index Turns More “Pessimistic” in May
This index rates the six-month outlook of investors for the Eurozone and is compiled from about 2,800 investors and analysts. This survey was conducted between May 4 to May 6. A reading above zero indicates optimism and below, indicates pessimism. May’s reading fell to a negative -13.1 points from -8.7 in April and was lower than expected -8.0 reading. The expectations index decreased to -19.0 from -13.0 for April and was the lowest since December. Germany’s current situation index dropped to -9.0 from -2.3 in April. Manufacturing accounts for about 20% of Germany’s economy. Both industrial output and orders have fallen recently in Germany, so these results were not surprising. We also suspect that rising inflation expectations for the Eurozone as reflected in ECB’s most recent survey, might have played a role in lowered investor confidence.
Preliminary Results for May’s University of Michigan Index of Consumer Sentiment Appeared to Echo the Eurozone Sentix Investor Confidence Index – Lower
The preliminary results for May of the Index of Consumer Sentiment fell to a six-month low of 57.7 from 63.5 in April and versus an expected 63. The report stated that “consumers’ worries about the economy escalated in May alongside the proliferation of negative news about the economy, including the debt crisis standoff.” Year ahead expectations for the U.S. economy “plummeted” to 53.4 from 60.5 in April and the current economic subindex fell to 64.5 from 68.2. Year ahead inflation expectations dropped slightly to 4.5% from 4.6%, after rising by 1.0% in April. But we found it troublesome that long run inflation expectations increased from 3.0% last month to 3.2% in this preliminary reading versus an expected decrease to 2.9%. This was the highest reading since March 2011. We surmise that the rise in longer term inflation expectations will be troubling to the Fed as well, since they have often highlighted the importance of long run inflation expectations remaining ”well-anchored.”
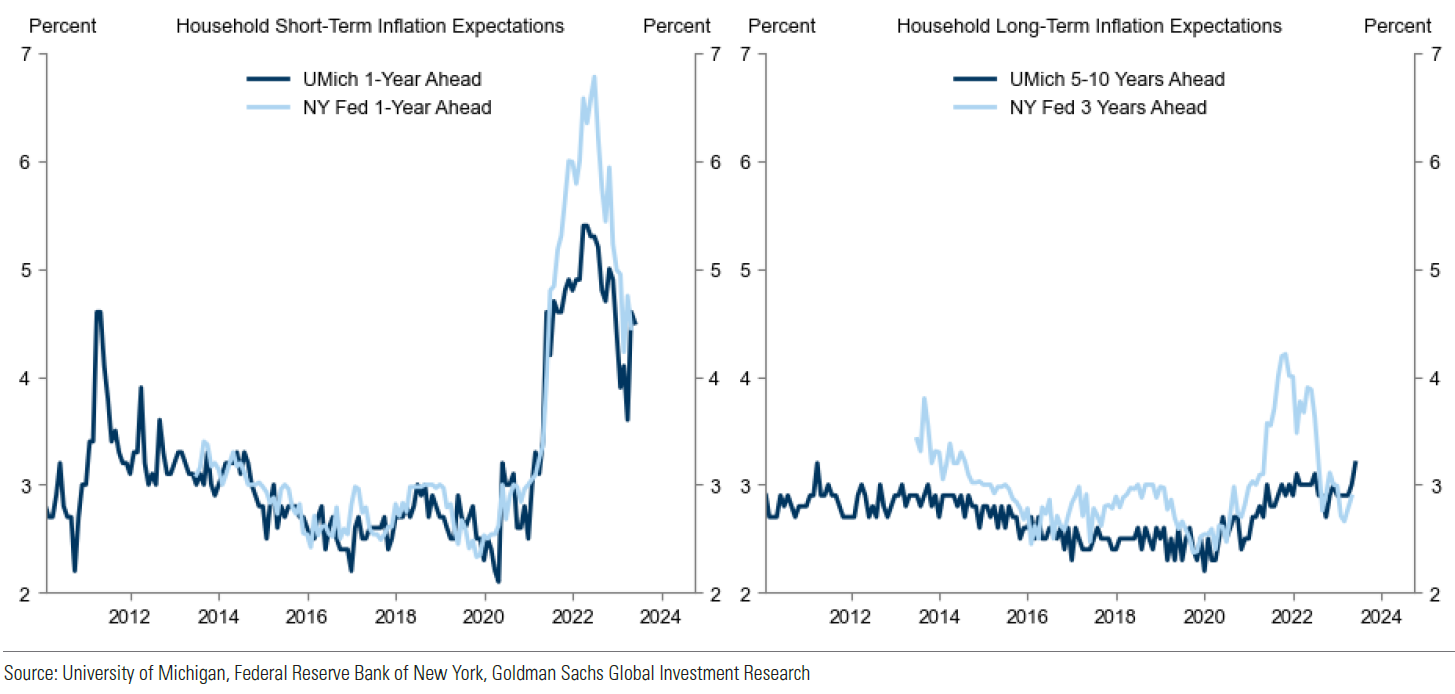
Source: Goldman Sachs, USA: UMichigan Sentiment Falls and Long-Term Inflation Expectations Rise in Preliminary May Report (5-12-2023)
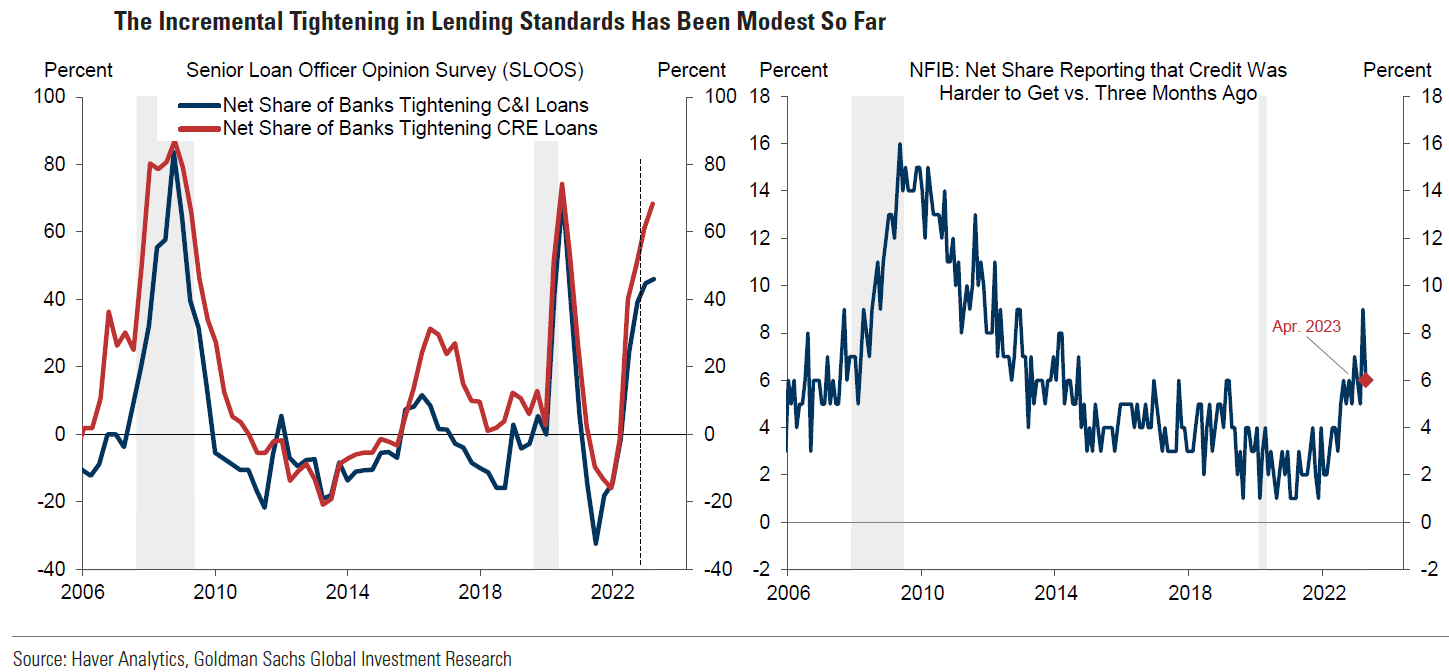
Fed’s April Senior Loan Officer Opinion Survey (SLOOS) – Tighter Q1 Lending Standards and Lower Loan Demand
The Fed’s SLOOS for April showed that lending standards tightened on net, and that demand weakened for both commercial and industrial (C&I) loans for firms of all sizes and for commercial real estate (CRE) loans. Tighter standards for all consumer loans were reported. Weaker demand for auto and other consumer loans was also reported but credit card demand was roughly unchanged. Banks on net widened significantly loan rates over the cost of funds – for large firms, 62% of banks widened these spreads versus 45% on net in the previous quarter; and 58% of banks on net widened spreads for small firms versus 33% on net in the previous quarter. On net, 56% of banks reported weaker demand for C&I loans for large and medium sized firms versus 31% in the previous quarter. For small firms, 53% of banks, on net, reported weaker demand for C&I loans versus 42% in the previous quarter. The only time loan demand was weaker for this latter category was in 2009. The series began in 1991. This SLOOS was better than we expected. We viewed the results as only incrementally more negative in regard to credit and loan activity. However, we expect credit conditions to continue to tighten further.
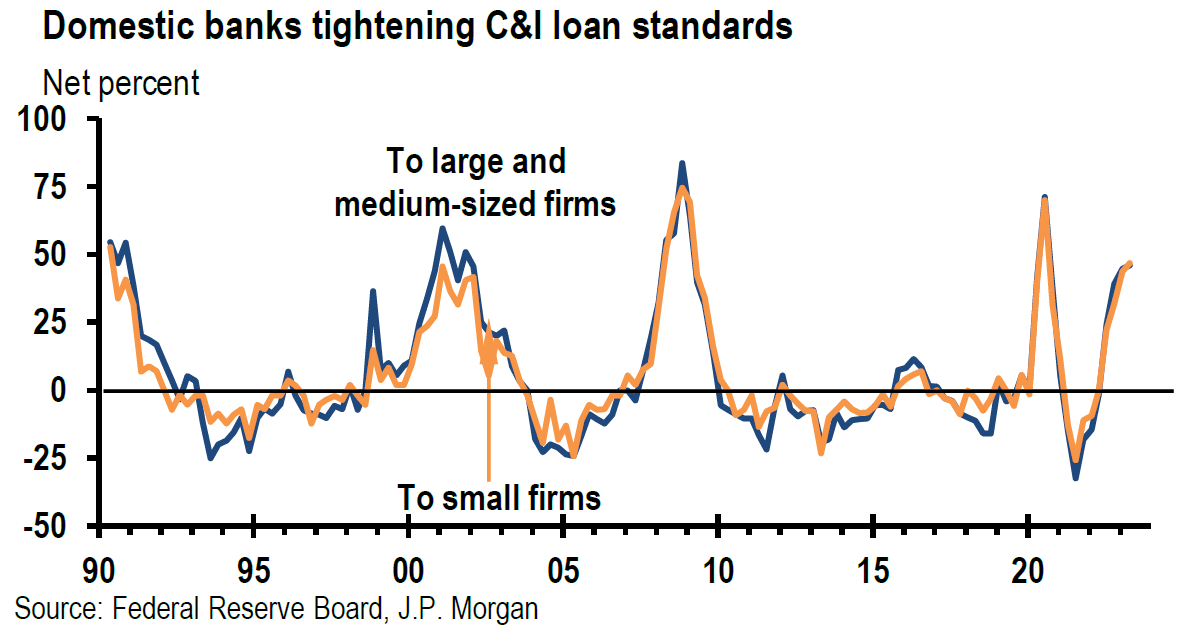
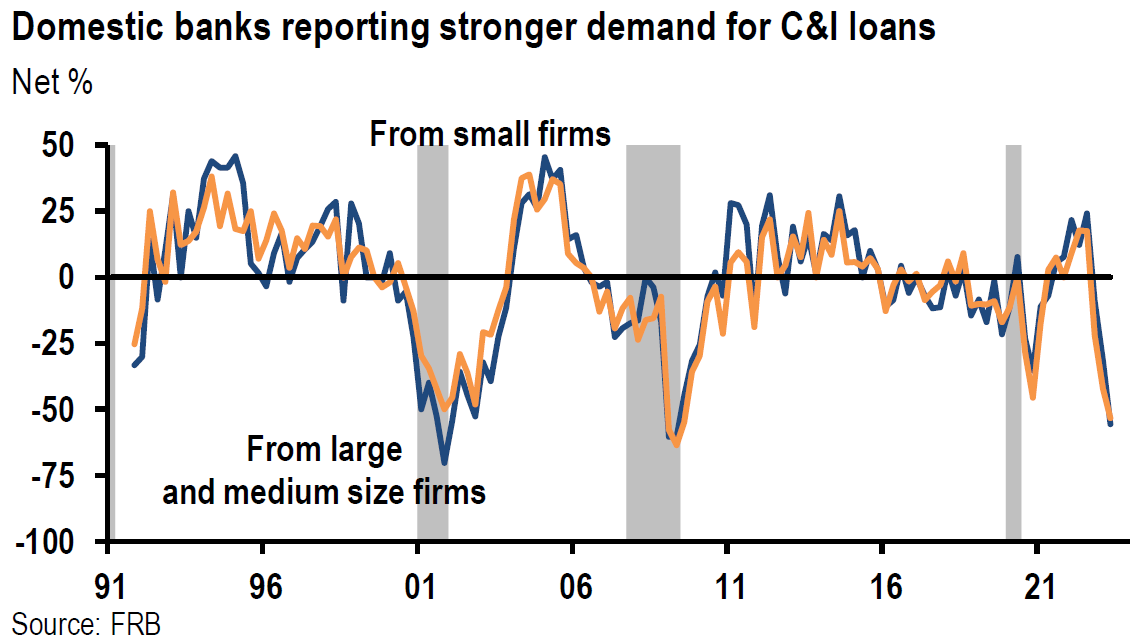
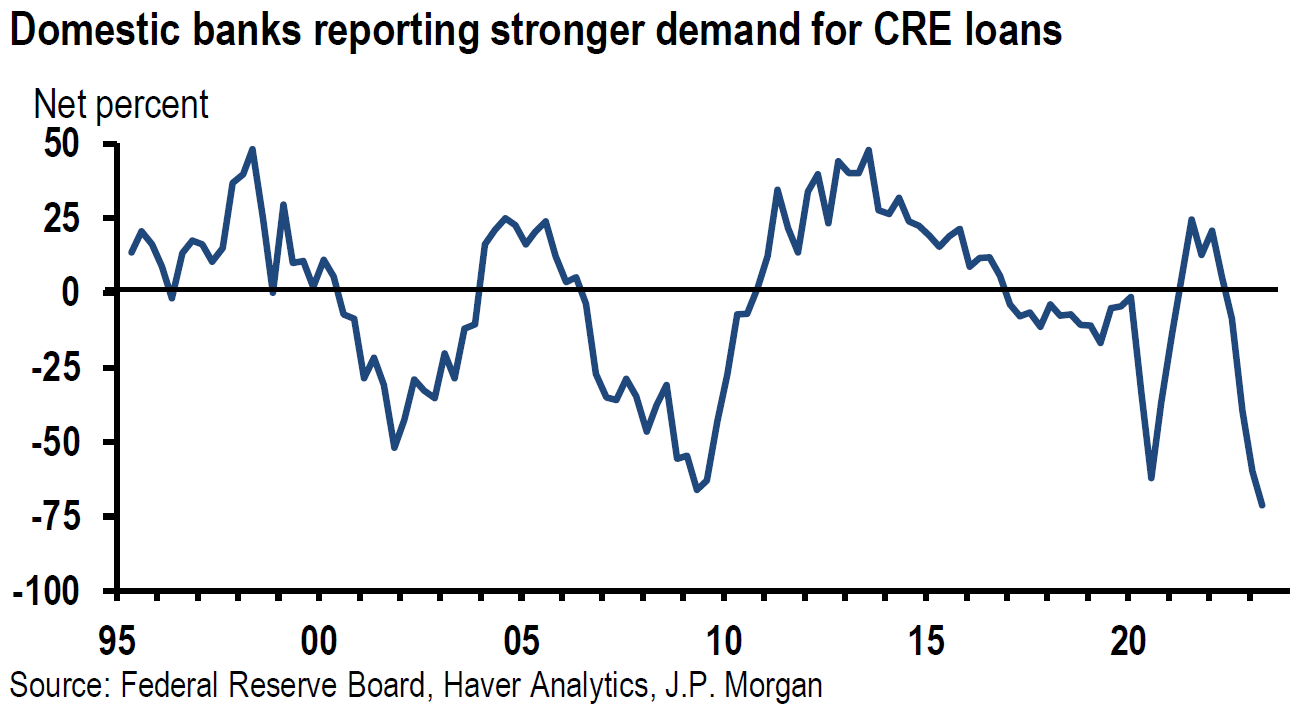
Source: JP Morgan, Tough news for the outlook, anyway you SLOOS it (5-8-2023)
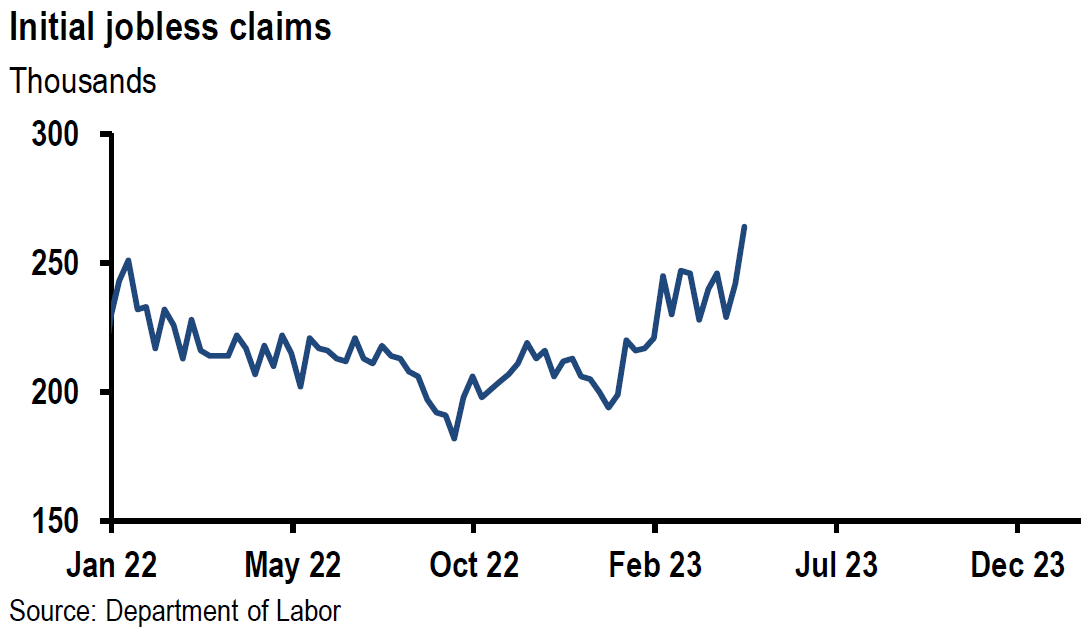
Initial U.S. Jobless Claims Rise Much More than Expected
Initial claims for unemployment benefits rose 22,000 to 264,000 for the week ended May 6 versus an expected 245,000 level. This was the highest level since October 2021. However, on May 11 Goldman Sachs (Goldman) questioned the veracity of this large jump in claims. Goldman noted that initial claims increased by 23,000 over the last couple of weeks in Massachusetts but that this increase remained uncorroborated by other specific labor market indicators. Goldman also stated that the current level of initial claims is about three times the peak level during the Great Financial Crisis (GFC). Continuing jobless claims rose 12,000 for the week ended April 29 to 1.813 million versus an expected 1.820 million claims. Notwithstanding Goldman’s concerns, we view this latest jump in initial claims as a potential precursor to a more abrupt slowing of the demand for labor and therefore a “cooling” of the U.S. labor market.
Source: JP Morgan, Thursday data wrap-up (5-11-2023)
NFIB Small Business Optimism Index Continues Lower in April
The National Federation of Independent Business (NFIB) April index was 1.1 points lower to 89.0, which was the sixteenth consecutive month below the survey’s 49-year average of 98 and the lowest reading since January 2013. Labor quality displaced inflation concerns by a narrow margin as the top small business problem. We thought it notable that NFIB stated that this latest survey indicated that inventories were too large relative to expected sales. This latter observation echoed similar statements made by Warren Buffett, chairperson of Berkshire Hathaway, at its most recent shareholders’ meeting with respect to many of Berkshire’s companies.
Unexpected Drop in China’s April Imports Question Sustainability of China’s “Reopening Economy”
April imports declined -7.9% y/y versus an expected decline of -0.2%. Exports rose 8.5% y/y versus an expected gain of 8.0%. March exports were higher by 14.8% y/y and March imports were lower by -1.4% y/y. But on a monthly sequential basis, both imports and exports were lower. Imports were -5.1% lower m/m in April and crude oil imports were -7.0% lower m/m. Exports declined by -5.4% m/m (seasonally adjusted and non-annualized).
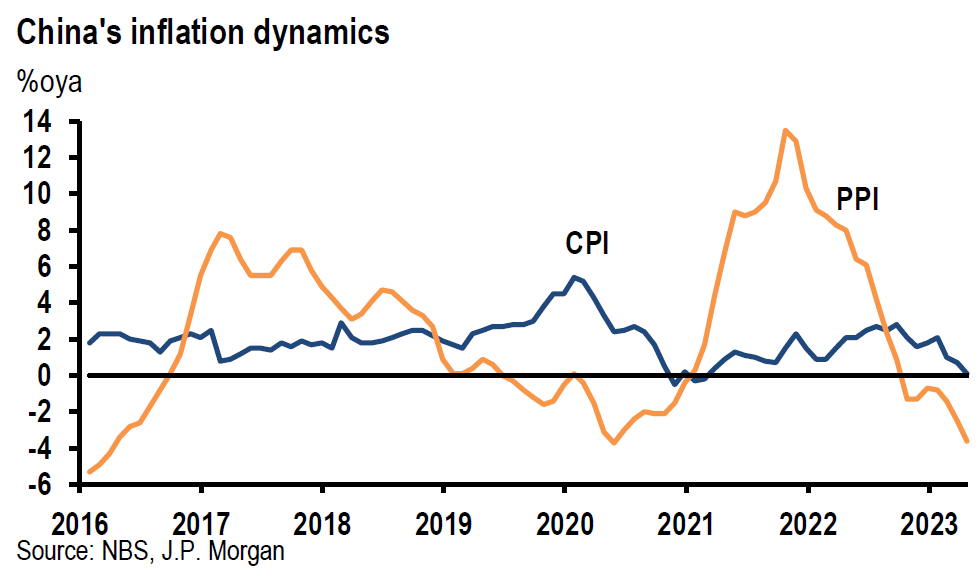
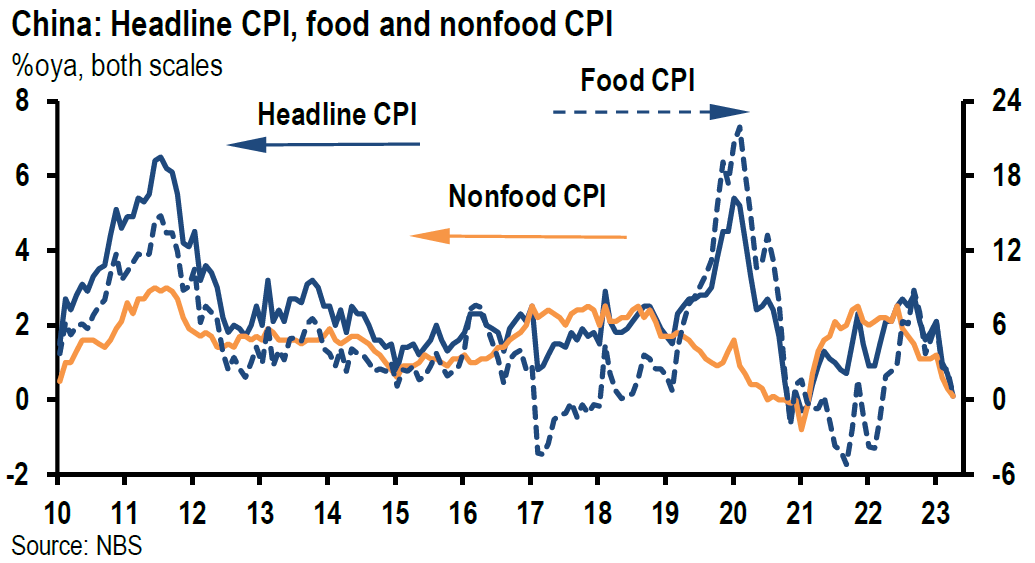
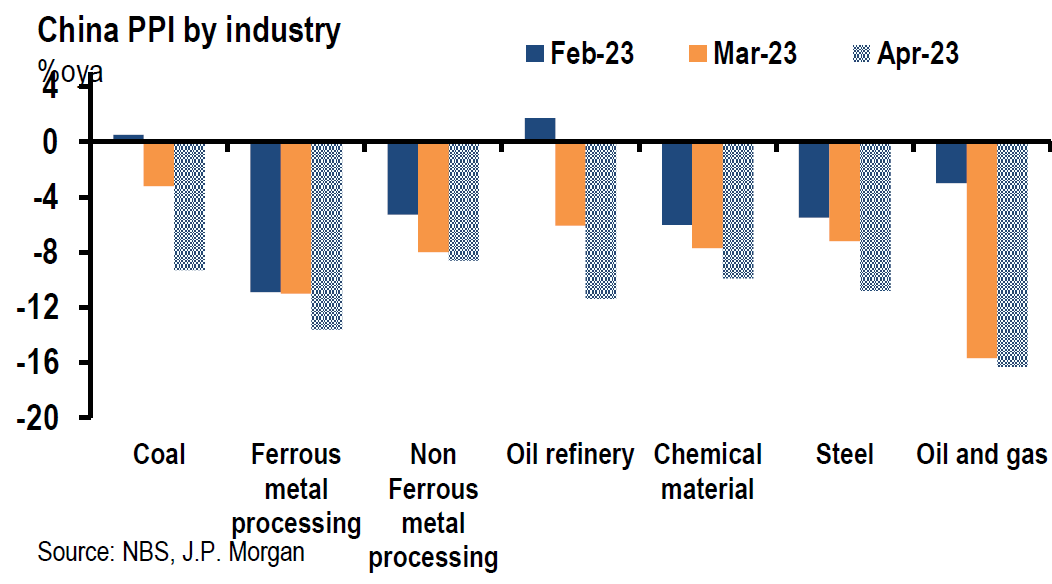
China CPI and PPI Decline Further in April
China CPI declined -2.2% m/m seasonally adjusted, annualized and PPI was lower by -4.2% m/m. CPI inflation fell to a barely positive y/y rate of 0.1% from +0.7% y/y in March. April PPI was -3.6% lower y/y in April versus down -2.5% y/y in March. Services inflation continued to firm in China. After the release of the April inflation data, Goldman revised lower their headline CPI and PPI 2023 estimates to 1.2% y/y and -1.3% y/y, respectively from +1.8% and -1.0% previously. Many economists believe that China’s PPI figures are typically a prelude to subsequent U.S. CPI readings.
Source: JP Morgan, China (5-11-2023)
German Industrial Output Declines More than Expected in March
German industrial orders fell -10.7% m/m in March, which was the largest monthly decrease since 2020. Auto sector production was -3.4% lower m/m in March versus an expected decrease of -1.3% and compared to a 2.1% m/m February increase. Retail sales and exports also dropped sharply in March. As we have already indicated, the manufacturing sector accounts for about 20% of Germany’s economy. We postulate that a good deal of Germany’s slowing economy could be tied to a less robust China reopening, as reflected by its disappointing import data.
Bottom Line
For the time being we are maintaining our basic investment approach as expressed in last week’s commentary. We continue to prefer high quality stocks that offer good balance sheet, as well as relatively stable cash flows and profit margins. We prefer a global diversified portfolio for long term investors. We continue to stress that stock selectivity in this current environment is of paramount importance. We foresee continued financial market volatility.
We believe that “problems” emanating from regional banks are not over and that lending standards will be further tightened. We believe that there is high probability that demand for many types of loans will continue to diminish. Given the many uncertainties and lack of conviction by many financial market participants, we would not be surprised to see extreme positioning having an “oversized” market impact.
Source: Goldman Sachs, Global Views: Climbing the Wall of Worry (5-11-2023)
Definitions:
S&P 500 – The S&P 500 is a total return index that reflects both changes in the prices of stocks in the S&P 500 Index as well as the reinvestment of the dividend income from its underlying stocks.
Basis Points (bps) – A basis point is one hundredth of one percent, used chiefly in expressing differences of interest rates.
Inverted Yield Curve – An inverted yield curve describes the unusual drop of yields on longer-term debt below yields on short-term debt of the same credit quality. Sometimes referred to as a negative yield curve, the inverted curve has proven in the past to be a relatively reliable lead indicator of a recession.
Producer Price Index (PPI) – The producer price index (PPI), published by the Bureau of Labor Statistics (BLS), is a group of indexes that calculates and represents the average movement in selling prices from domestic production over time. It is a measure of inflation based on input costs to producers.
Core Producer Price Index (PPI) – The core producer price index (PPI), published by the Bureau of Labor Statistics (BLS), is a group of indexes that calculates and represents the average movement in selling prices from domestic production over time that excludes food and energy prices, which are the more volatile parts of inflation.
Headline Consumer Price Index (Headline CPI) – Headline inflation is the raw inflation figure reported through the Consumer Price Index (CPI) that is released monthly by the Bureau of Labor Statistics (BLS). The CPI calculates the cost to purchase a fixed basket of goods to determine how much inflation is occurring in the broad economy. The CPI uses a base year and indexes the current year’s prices, according to the base year’s values.
Core Consumer Price Index (Core CPI) – Core inflation removes the CPI components that can exhibit large amounts of volatility from month to month, which can cause unwanted distortion to the headline figure. The most commonly removed factors are those relating to the costs of food and energy. Food prices can be affected by factors outside of those attributed to the economy, such as environmental shifts that cause issues in the growth of crops. Energy costs, such as oil production, can be affected by forces outside of traditional supply and demand, such as political dissent.
Positioning – A position is the amount of a security, asset, or property that is owned (or sold short) by some individual or other entity. A trader or investor takes a position when they make a purchase through a buy order, signaling bullish intent; or if they sell short securities with bearish intent.
Eurozone Sentix Investor Confidence Index – The Sentix Investor Confidence Index rates the relative six-month economic outlook for the euro zone. The data is compiled from a survey of about 2,800 investors and analysts. A reading above zero indicates optimism; below indicates pessimism.
NFIB Small Business Optimism Index – The Small Business Optimism Index is a composite of ten seasonally adjusted components. It provides an indication of the health of small businesses in the U.S., which account of roughly 50% of the nation’s private workforce.
The Manheim Used Vehicle Value Index – This index measures the prices car dealerships pay for used cars at auctions. The prices are adjusted for seasonal factors but typically offer insight into what dealerships pay for the used cars they sell. Cox Automotive—the company behind Autotrader and Kelley Blue Book—publishes the index and updates the data monthly.
Senior Loan Officer Opinion Survey on Bank Lending Practices (SLOOS) – The Senior Loan Officer Opinion Survey on Bank Lending Practices is a survey the Federal Reserve conducts to gain insight into bank lending practices and conditions.
IMPORTANT DISCLOSURES
The views and opinions included in these materials belong to their author and do not necessarily reflect the views and opinions of NewEdge Capital Group, LLC.
This information is general in nature and has been prepared solely for informational and educational purposes and does not constitute an offer or a recommendation to buy or sell any particular security or to adopt any specific investment strategy.
NewEdge and its affiliates do not render advice on legal, tax and/or tax accounting matters. You should consult your personal tax and/or legal advisor to learn about any potential tax or other implications that may result from acting on a particular recommendation.
The trademarks and service marks contained herein are the property of their respective owners. Unless otherwise specifically indicated, all information with respect to any third party not affiliated with NewEdge has been provided by, and is the sole responsibility of, such third party and has not been independently verified by NewEdge, its affiliates or any other independent third party. No representation is given with respect to its accuracy or completeness, and such information and opinions may change without notice.
Investing involves risk, including possible loss of principal. Past performance is no guarantee of future results.
Any forward-looking statements or forecasts are based on assumptions and actual results are expected to vary from any such statements or forecasts. No assurance can be given that investment objectives or target returns will be achieved. Future returns may be higher or lower than the estimates presented herein.
An investment cannot be made directly in an index. Indices are unmanaged and have no fees or expenses. You can obtain information about many indices online at a variety of sources including: https://www.sec.gov/fast-answers/answersindiceshtm.html or http://www.nasdaq.com/reference/index-descriptions.aspx.
All data is subject to change without notice.
© 2024 NewEdge Capital Group, LLC


