

If you had to take a bet on what the Fed will do next, the bond market is your best guess. Over the past 30 years, the strategy worked seamlessly. The bond market senses weakness in the global economy or markets, begins to price in rate cuts, and, sure enough, the Fed followed soon with easing. In scenarios where recessions did not follow, equity markets rejoiced at this easier Fed (exampled in 1995, 1998, 2016, and 2018), while in scenarios with recessions, equity markets were weighed down by earnings weakness, despite Fed liquidity.
Over the past year, however, the bond market has been wrong about the Fed’s next move multiple times. Inflation has remained stubbornly high and above the Fed’s 2% target, not falling nearly as quickly as the Fed and bond markets expected. This persistence of inflation has kept the Fed cautious about changing the course of policy, along with the risk that inflation could return if policy eases, necessitating an even more aggressive policy response.
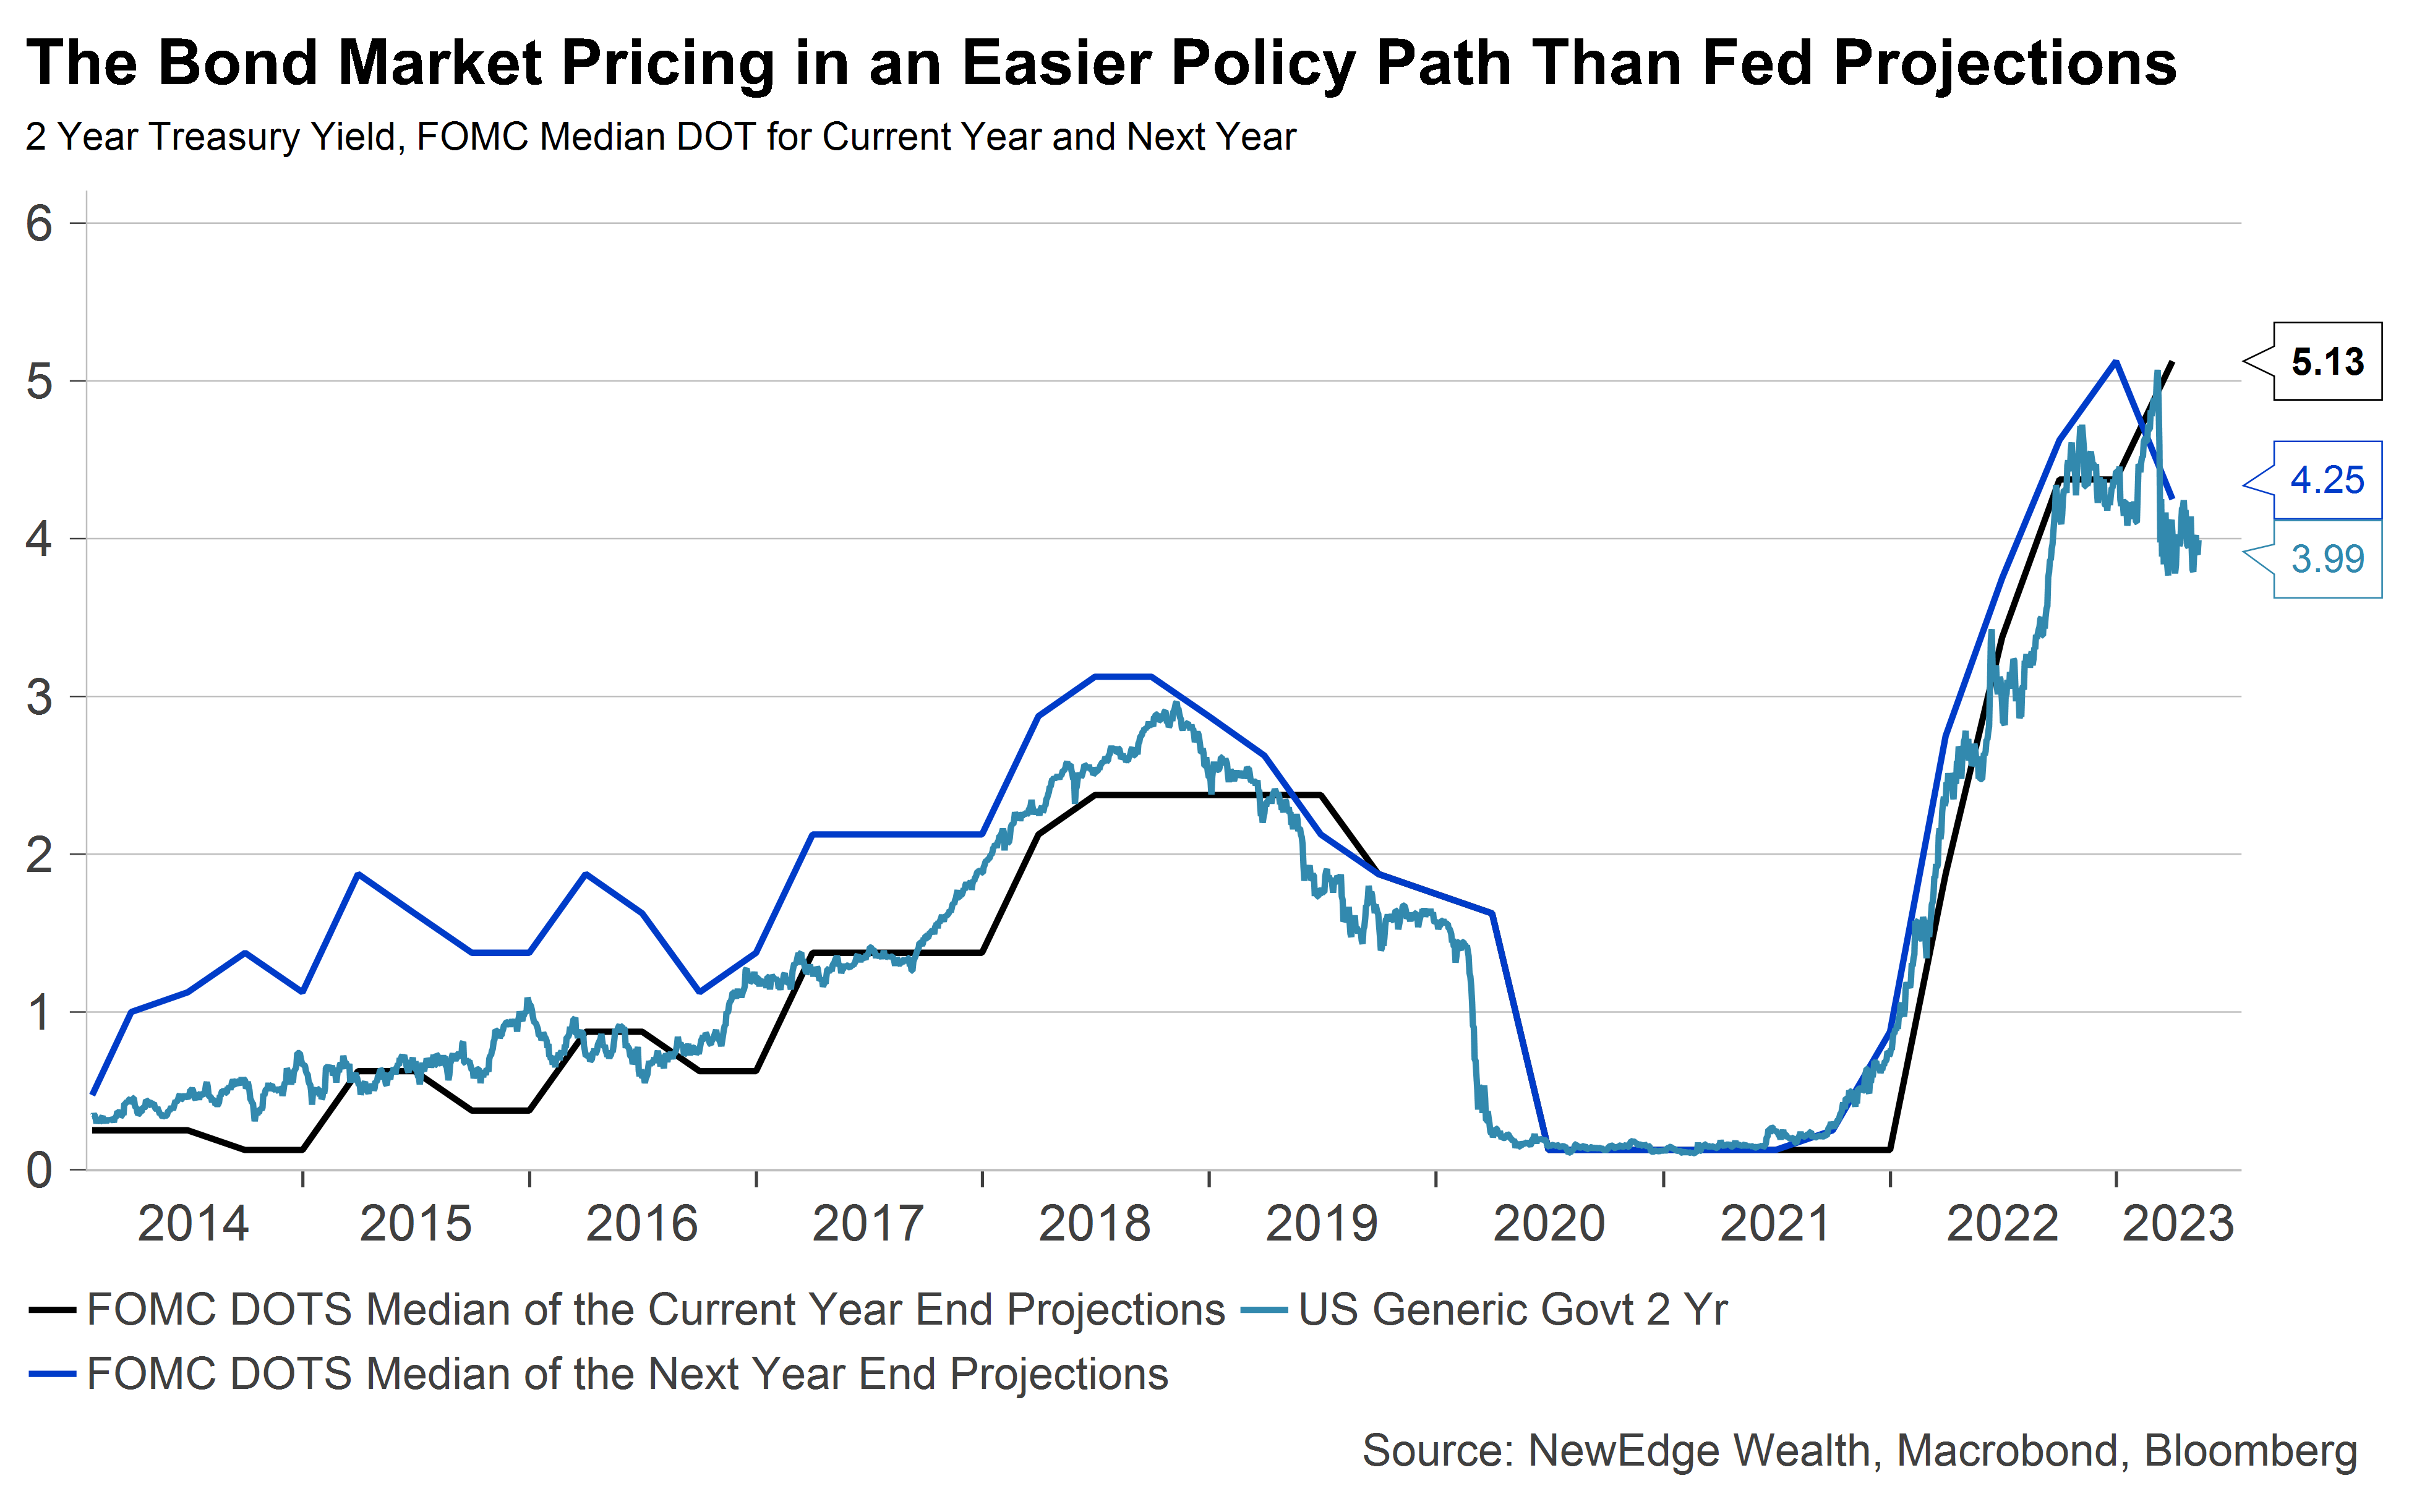
However, based on current market pricing, the bond market does not believe the Fed can hold the line on higher for longer policy. The yield of Treasury Bills maturing by early June is above the Fed funds rate and inflation, but just a few weeks later, the Fed funds futures (derivatives that measure expectations of Fed policy) are pricing in a 36% probability of a rate cut at the July FOMC meeting, with about 80 bps of cuts priced in by the end of 2023. The schism between the Fed and markets is the widest since the Fed began publishing projections through the Dot Plot in 2012.
As of: 5/12/23
The yields on T-bills and Fed Funds futures for May into June are at 5% to 5.5% and above headline inflation, and, therefore, can be considered “restrictive.” Based on current market pricing, the bond market expects that this level of restrictive rates will only last for a few months. But the recent messaging by officials such as Williams and Bowman emphasized holding rates at restrictive levels to ensure that inflation reaches the 2 percent goal and stays close to that territory going forward, keeping an anchor on longer-term inflation expectations.
There are multiple “problems” (maybe not 99!) that are driving the bond market to price in such a different outcome than the Fed’s guidance. These include concerns about the debt ceiling, regional banking crisis, geopolitical tensions, concern about flagging U.S. growth, and optimism that inflation will continue to moderate.
The elevated yield on Treasury Bills maturing in the next month reflects a chance that lawmakers will not get to a resolution by early June. We believe the risk of outright default remains low, despite startling rhetoric, because even after the X-date (when the Treasury runs out of “extraordinary measures” to prevent going over the debt ceiling), the Treasury can prioritize payments to Treasury debt holders in order to avoid a technical default. On the other hand, the bond market sees prolonged brinkmanship over the debt ceiling as a reason for the Fed to cut rates. The eventual resolution of the debt ceiling may include spending cuts that could slow the economy down and put downward pressure on inflation.
The regional banking crisis is permeating with some early effects seen in loan growth (both supply from banks and demand from borrowers have moderated) and credit conditions. But those effects can take considerable time to show up in unemployment and inflation data.
Although many of the pandemic-era supply chain pressures have normalized, the tensions with China over Taiwan, trade, and semiconductors have not. Geopolitical tensions remain a key wild card for markets and the economy.
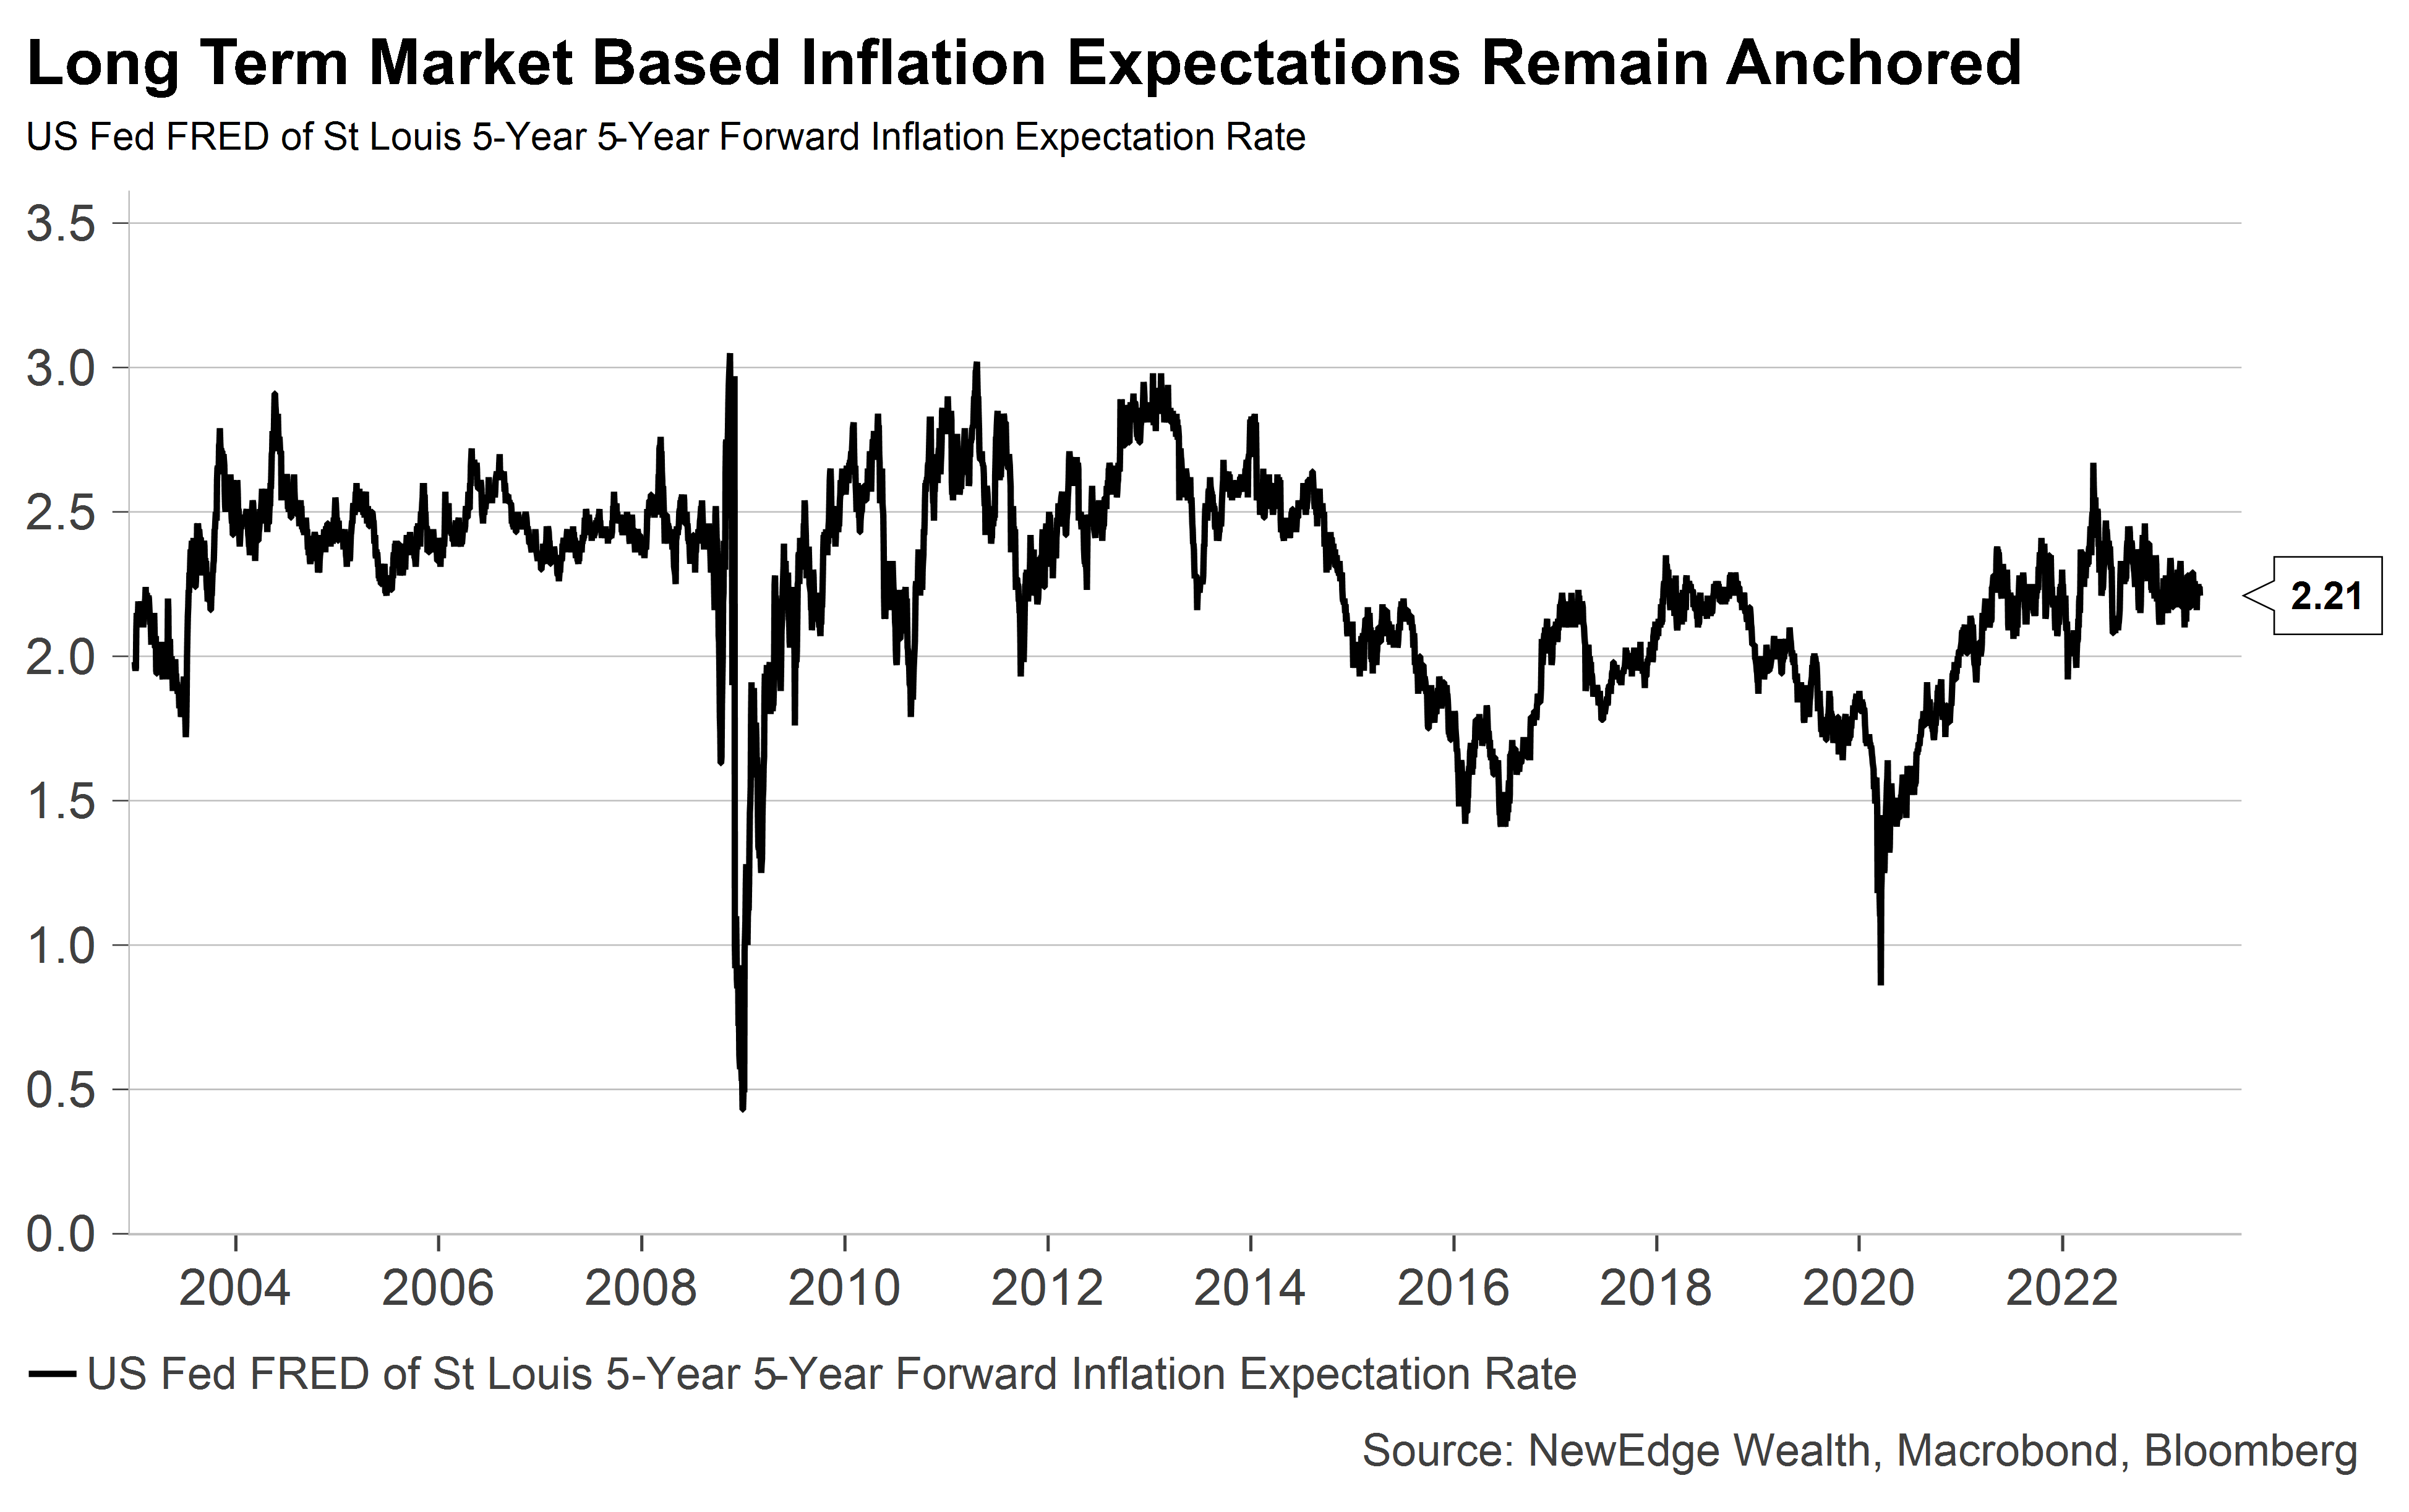
The bond market believes that the Fed will be successful in bending inflation back down to their 2% target in the long run. Market-based measures of inflation expectations, such as the 5-Year 5-Year Forward Inflation Expectations shown below at just 2.2%, have not meaningfully reset higher, despite the recent inflation episode.
As of: 5/12/23
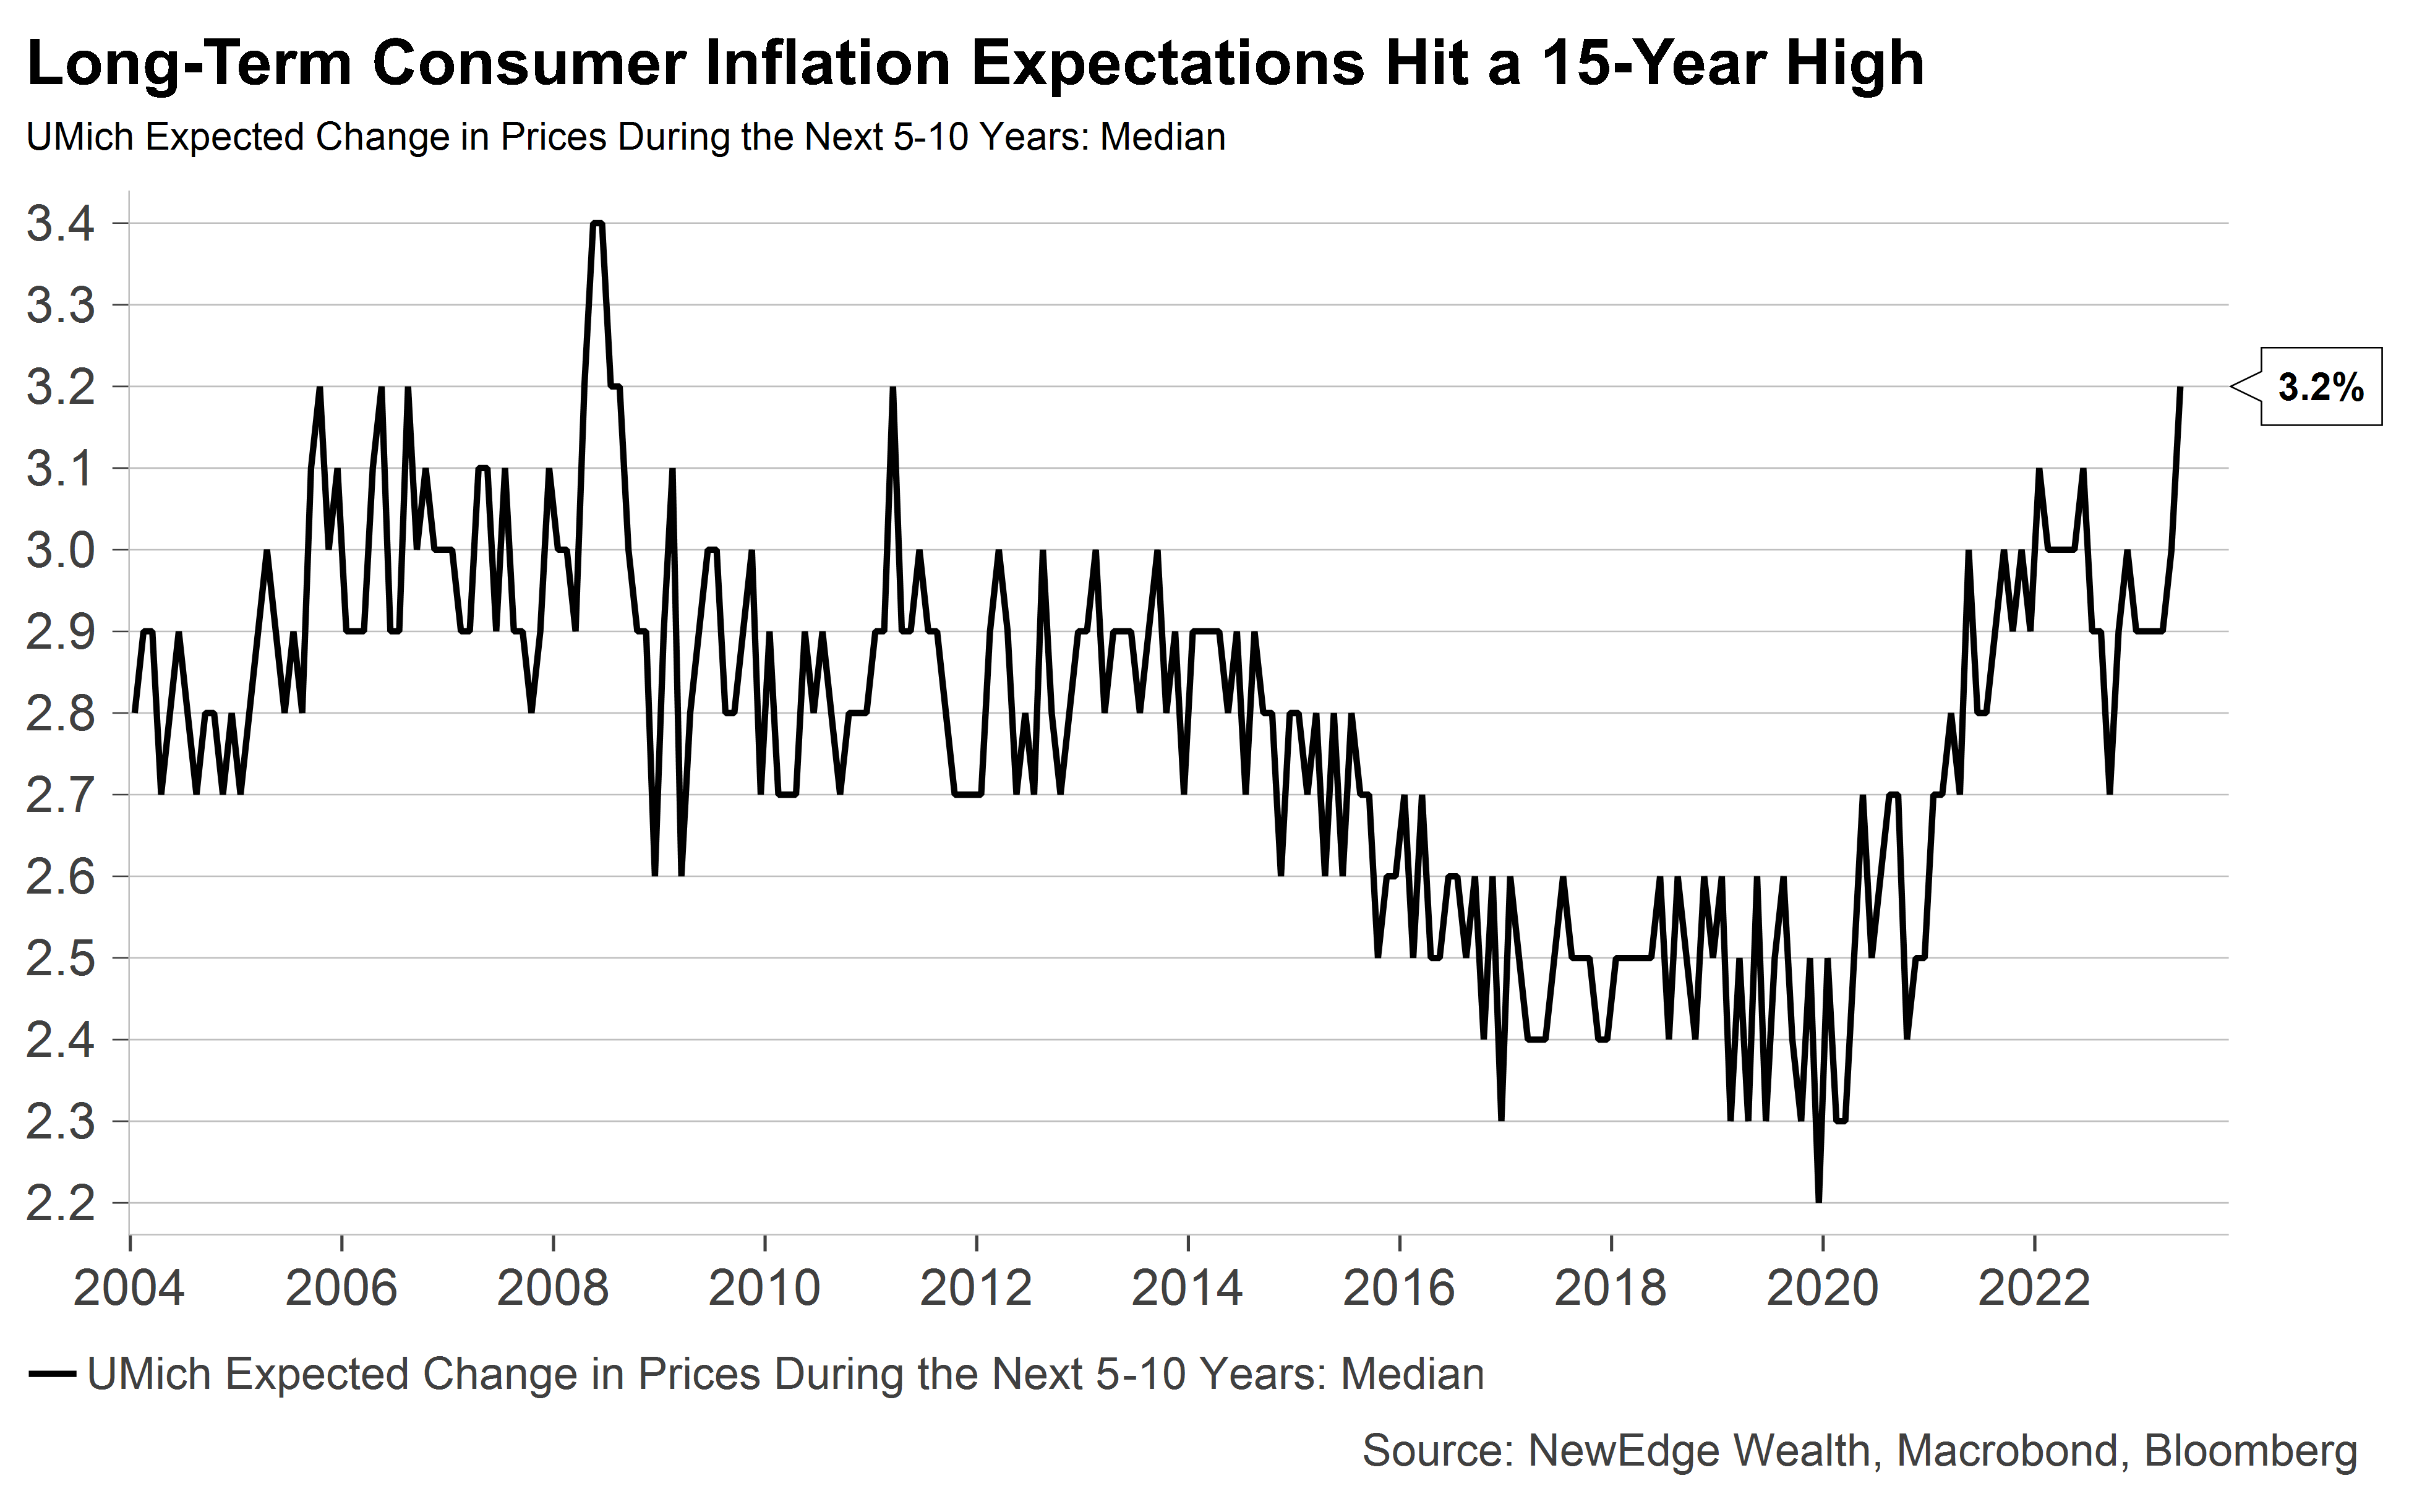
Consumer expectations tell a different story, and one that reinforces the Fed’s insistence on a higher for longer policy stance. Friday’s University of Michigan Consumer Sentiment Survey showed an uptick in long-term inflation expectations, up to 3.2%, the highest level since 2008.
As of: 5/12/23
Investors hold a high conviction that a debt ceiling and banking crisis will do the job for the Fed, allowing rate cuts to start as soon as the fall. There is a low risk of default, but a much higher risk of a recession.
A sign of recession worries is the yield curve that has started to re-steepen. The difference between the 2-year and the 30-year yield has narrowed to near flat. But the inversion between T-bills and the 30-year remains at a record level. This is another expression of the bond market not believing the Fed’s higher for longer guidance.
There is a false pretense that the last 30 years serve as an example of things may play out according to the wisdom of the bond market, mostly because in the last 30 years, inflation was subdued and did not restrict the Fed’s ability to support markets and the economy.
In the analogy of rapper Jay-Z, the bond market has 99 problems, but default ain’t one. But for the ultimate Fed pivot to happen, the bond market’s 99 problems must be the Fed’s problem. It will take more time for that to unfold and, therefore, the rate cuts priced in are less likely to materialize soon. For stock markets, it is a sobering message and why stasis is likely to prevail in a moribund range.
Top Points of the Week
By Ben Lope
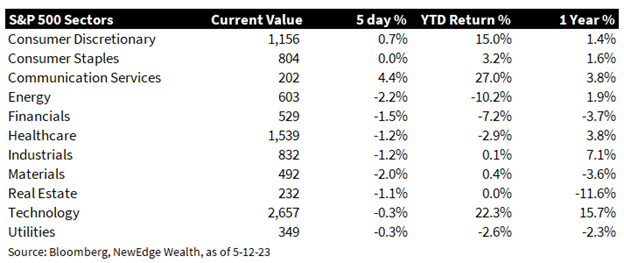
- Equities: Broad US equities were down slightly on the week, with the exception of the Tech-heavy NASDAQ and Russell 1000 Growth indices, which were up modestly. Communication Services was the top performing S&P 500 sector, despite shares of Disney falling approximately 10% following earnings results that were delivered in line with analyst projections while revealing challenges in the company’s streaming and TV segments. Nearly all international equity Indices showed flat to slightly negative returns for the week.
- Yields: Yields on US Treasuries inched slightly higher on the week, with relatively larger increases on the short end of the curve. Yields across the curve remain lower than the peaks seen prior the SVB and Signature Bank collapses in March, but this has not prevented the ICE BofA MOVE Index, which measures bond market volatility, from sitting at above average levels compared to prior years. The volatility is unlikely to go away any time soon as cracks in the credit market, looming U.S. debt ceiling issues, and weakening consumer confidence add to investor anxiety.
- Oil: Oil prices ended the week about flat, despite intraweek price swings higher and lower. The higher USD capped upside moves, while statements by the US government signaling that they could purchase oil to refill the US Strategic Petroleum Reserve offered a floor. Oil is down nearly 10% year-to-date but has experienced technical support near $70 and $75 per barrel, which could stem the need for OPEC+ to enact further production cuts.
- CPI In Line: April’s Consumer Price Index (CPI) reading, released on Wednesday, showed a year-over-year increase of 4.9% in headline inflation and 5.5% increase in core inflation, which excludes food and energy components. Month-over-month these figures increased 0.4% for both metrics. Although these readings remain well above the Fed’s inflation target of 2%, the data release sparked an uptick in equities and moderation Treasury yields, as significant progress has been made since headline inflation’s June 2022 peak of 9%. A moderation in rent inflation aligned with consensus expectations, but a pick-up in core goods inflation, attributed primarily to an increase in used car prices, displayed the challenge in projecting a clean glide path to the Fed’s broad inflation target.
- PPI In Line and Moderating: The US Headline Producer Price Index (PPI), released on Thursday, showed a year-over-year increase of 2.3% and a month-over-month increase of 0.2%, in line with consensus estimates. The year-over-year figure marks the lowest reading since January 2021 and was considered to be supportive of the Federal Reserve pausing rate hikes at their June meeting. Under the surface, Core PPI increased 3.2% year-over-year and 0.2% month-over-month, also in line with consensus expectations. The services component of PPI increased 0.3% month-over-month, marking its highest reading since November 2022 and providing a reminder that decelerating producer inflation is not uniform across economic segments.
- Jobless Claims Tick Higher, Sentiment Ticks Lower: US initial jobless claims figures indicated the highest level of Americans applying for unemployment benefits since October 2021. Initial unemployment claims increased by 22,000 week-over-week to a seasonally adjusted total of 264,000, higher than consensus expectations of 245,000. While this reading may aid in providing justification for the Federal Reserve to pause rate hikes in the coming months, a sustained slowdown in the US labor market makes the central bank’s calculus for a “soft landing” more challenging. On the “soft data” front, results from the University of Michigan’s Survey of Consumers showed sentiment falling from 63.5 in April to 57.7 in May, as respondents increasingly fear the onset of a recession and harbor anxieties regarding the looming debt ceiling “X-date.”
- US Data – Senior Loan Officer Survey: On the “soft data” front, Tuesday’s Senior Loan Officer Opinion Survey revealed that 46% of senior loan officers increased lending standards for corporate and industrial loans in the first quarter of 2023. This figure is up slightly from the previous quarter’s reading of 44.8% and foreshadows an increase in “hard data” on lending standards, which tends to lag “soft” survey data by about 12 months. The modest increase in lending standards is surprising in light of the regional banking tumult that began towards the end of Q1 and continues to loom over the sector, but further parsing of the data reveals increased lending standards were mostly driven by smaller, regional banks whose deposit outflows shifted towards the largest, diversified banks, whose lending standards neither tightened nor loosened.
- U.S. Corporate Earnings Update: More than 90% of S&P500 constituents have now reported first quarter earnings and the results have been better than expected. Overall earnings are on pace to decline 2% year-over-year, vs the pre-season expectation for a 7% decline year-over-year, and both the percentage of companies beating expectations and the magnitude of earnings beats are above historical average levels. Revenue growth is also exceeding expectations, rising 4% year-over-year, vs the previously expected 2% year-over-year growth. If 4% is the actual revenue growth rate for the quarter, it will mark the lowest quarterly growth rate since Q4 2020.
- Debt Ceiling Update: President Biden and House Speaker Kevin McCarthy failed to make progress on debt ceiling negotiations during their Tuesday meeting at the White House and then postponed a follow up meeting scheduled for Friday. The current impasse pits a demand by House Republicans for spending cuts to accompany any increase in the debt limit against calls from Biden and the Democrats for an unconditional increase in the debt limit. Yields on Treasury Bills maturing between June and August rose on the news, as Treasury Secretary Janet Yellen has warned that the government could run out of cash required to fund obligations as early as June 1, a significant pull-forward from earlier estimates of an “X-date” at some point in August. As we move closer to Yellen’s June 1 warning, the costs to insure US sovereign debt via credit default swaps has become more expensive than insuring defaults of Greek, Mexican, and Brazilian sovereign debt.
- Economic Data Next Week: Next week’s data releases for Retail Sales, the Philadelphia Fed Manufacturing Index, and Housing Starts will offer important clues about the path of US demand and inflation and will be factored into the Fed’s June policy decision. A continued moderation in these readings will likely increase the probability of a Fed pause in June, a scenario that the bond market is pricing in as a near certainty.
- Earnings Next Week: Corporate earnings next week will provide a look at the state of the U.S. consumer with Walmart, Target, and Home Depot all set to report. Recent weakness in retail sales is likely to weigh on top line growth and we are closely watching the interplay between price increases and transaction volumes as consumers continue to grow weary of rising prices.
IMPORTANT DISCLOSURES
Abbreviations:Bowman: Michelle Bowman, a member of the Federal Reserve Board of Governors; Core PPI: measures the change in the selling price of goods and services sold by producers, excluding food and energy; CPI: Consumer Price Index; Dot Plot: The Fed dot plot is published quarterly as a chart showing where each of the 12 members of the FOMC expect the federal funds rate to be for each of the next three years and the long term; Fed Fund futures: derivatives that measure expectations of Fed policy; FOMC: Federal Open Market Committee; Housing starts: an economic indicator that reflects the number of privately owned new houses (technically housing units) on which construction has been started in a given period; OPEC+: a group of 23 oil-exporting countries which meets regularly to decide how much crude oil to sell on the world market; Philadelphia Fed Manufacturing Index: measures changes in business growth covering the Pennsylvania, New Jersey, and Delaware region; PPI: Producer Price Index; Senior Loan Officer Survey: the Senior Loan Officer Opinion Survey on Bank Lending Practices is a survey the Federal Reserve conducts to gain insight into bank lending practices and conditions. The voluntary survey polls up to 80 large domestic banks and 24 branches of international banks; University of Michigan Consumer Sentiment Index: a survey of personal consumer confidence in economic activity, which is used to estimate future spending and saving; Williams: John Williams, President of the Federal Reserve Bank of New York; Yellen: Janet Yellen, United States Secretary of the Treasury. The 5-Year 5-Year Forward Inflation Expectations is a measure of expected inflation (on average) over the five-year period that begins five years from today.
Index Information: All returns represent total return for stated period. S&P 500 is a total return index that reflects both changes in the prices of stocks in the S&P 500 Index as well as the reinvestment of the dividend income from its underlying stocks. Dow Jones Industrial Average (DJ Industrial Average) is a price-weighted average of 30 actively traded blue-chip stocks trading New York Stock Exchange and Nasdaq. The NASDAQ Composite Index measures all NASDAQ domestic and international based common type stocks listed on the Nasdaq Stock Market. Russell 2000 is an index that measures the performance of the small-cap segment of the U.S. equity universe. MSCI International Developed measures equity market performance of large, developed markets not including the U.S. MSCI Emerging Markets (MSCI Emerging Mkts) measures equity market performance of emerging markets. Russell 1000 Growth Index measures the performance of the large- cap growth segment of the US equity universe. It includes those Russell 1000 companies with relatively higher price-to-book ratios, higher I/B/E/S forecast medium term (2 year) growth and higher sales per share historical growth (5 years). The Russell 1000 Value Index measures the performance of the large cap value segment of the US equity universe. It includes those Russell 1000 companies with relatively lower price-to-book ratios, lower I/B/E/S forecast medium term (2 year) growth and lower sales per share historical growth (5 years). The BBB IG Spread is the Bloomberg Baa Corporate Index that measures the spread of BBB/Baa U.S. corporate bond yields over Treasuries. The HY OAS is the High Yield Option Adjusted Spread index measuring the spread of high yield bonds over Treasuries. The ICE BofA MOVE Index reflects the volatility of U.S. bond futures and is considered an observation indicator of the U.S. bond term premium (the difference between long and short interest rates).
Sector Returns: Sectors are based on the GICS methodology. Returns are cumulative total return for stated period, including reinvestment of dividends.
The views and opinions included in these materials belong to their author and do not necessarily reflect the views and opinions of NewEdge Capital Group, LLC.
This information is general in nature and has been prepared solely for informational and educational purposes and does not constitute an offer or a recommendation to buy or sell any particular security or to adopt any specific investment strategy.
NewEdge and its affiliates do not render advice on legal, tax and/or tax accounting matters. You should consult your personal tax and/or legal advisor to learn about any potential tax or other implications that may result from acting on a particular recommendation.
The trademarks and service marks contained herein are the property of their respective owners. Unless otherwise specifically indicated, all information with respect to any third party not affiliated with NewEdge has been provided by, and is the sole responsibility of, such third party and has not been independently verified by NewEdge, its affiliates or any other independent third party. No representation is given with respect to its accuracy or completeness, and such information and opinions may change without notice.
Investing involves risk, including possible loss of principal. Past performance is no guarantee of future results.
Any forward-looking statements or forecasts are based on assumptions and actual results are expected to vary from any such statements or forecasts. No assurance can be given that investment objectives or target returns will be achieved. Future returns may be higher or lower than the estimates presented herein.
An investment cannot be made directly in an index. Indices are unmanaged and have no fees or expenses. You can obtain information about many indices online at a variety of sources including: https://www.sec.gov/fast-answers/answersindiceshtm.html.
All data is subject to change without notice.
© 2024 NewEdge Capital Group, LLC


