

Weekly Summary: November 7 – November 11
Key Observations:
- We have stressed “rapidity of change” as a hallmark of this period since the beginning of the pandemic and Russia’s invasion of Ukraine. The recent volatility in both financial markets and economic data seem to support this view. The most recent example of this is the disappointing University of Michigan consumer sentiment survey released on Friday that showed a very sharp drop in ‘buying conditions” for durables that decreased “most sharply.”
- We have found that the best investment approach of keeping an “open mind” is particularly suitable for this environment. This has always been our approach. We view the examination and understanding of financial markets as “looking for adventure” as we deal with “whatever comes our way.”
- The extreme financial market reactions to the better-than-expected October U.S. Consumer Price Index (CPI) announced on Thursday showed us that this “good” financial market moving information was not reflected in financial markets. Lack of “proper” positioning most likely also played a role. In our opinion, this week’s trading in financial markets continued to confirm our view that the level of interest rates and their volatility continue to be the principal drivers of equities and currencies. We will continue to monitor closely stock price reactions to news, and to changes in economic and financial market movements as we attempt to decipher what’s “priced in” to markets.
- Upon a closer examination of the CPI components and their specific details, we surmise that the data is broadly supportive of our notion that U.S. inflation could dissipate in a more rapid manner than has been anticipated by the Federal Reserve (Fed), and many investors and analysts. If the Fed has truly become more data dependent and more forward looking as described in last week’s commentary, it could conceivably tighten less aggressively than Fed chair Powell indicated recently. But the Fed has made clear that they prefer to err on the side of “over-tightening.” The dramatic decrease in interest rates, USD and the increase in equities has loosened U.S. financial conditions dramatically as well. This has made the Fed’s job of reining in inflation more difficult. We anticipate more hawkish “Fed-speak.”
The Upshot: Our general investment approach remains the same as depicted in last week’s commentary. We maintain our preference for big cap quality stocks with good balance sheets, relatively stable cash flows and stable margins. Volatility across sectors continues to be supportive of a diversified portfolio for long term investors. We expect volatility across virtually all financial markets to continue. However, after Thursday’s dramatic movements in financial markets, we believe that there is a high probability that these movements in U.S. equities, interest rates and USD could continue until mid-December. The next CPI release will be on December 13 and the next Fed decision will be announced on December 14. If these trends persist close to those dates, we would be inclined to scale back positions as we would then view a less favorable risk/reward scenario of holding certain positions.
Towards the end of September, during the UK currency and liquidity “crisis,” we thought that there was a very high probability that USD and U.S. interest rates had reached at least a short-term peak. The downward trajectory of these trends was exaggerated this week around U.S. CPI data. We will continue to closely monitor these trends.
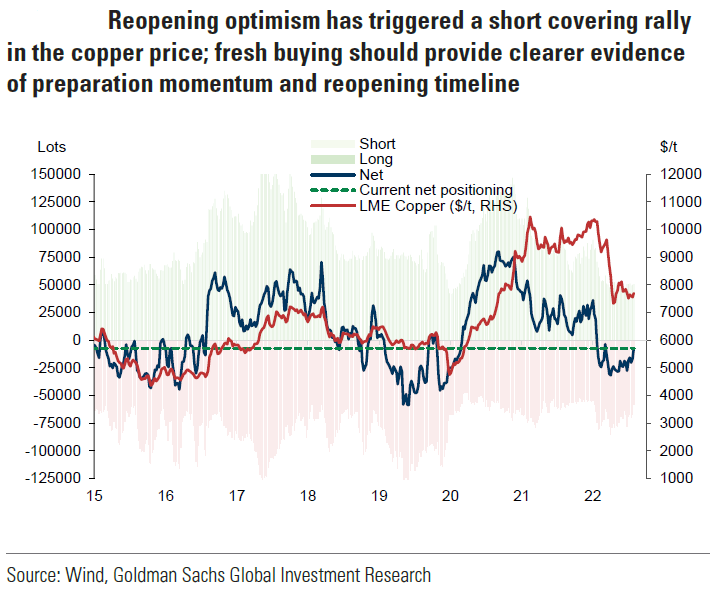
A weaker USD helps commodity prices and raises the value of overseas earnings for U.S. companies. We anticipate that base metals such as copper could benefit in particular. Commodity prices would get an additional boost higher to the extent China “reopens” by loosening its “dynamic” zero COVID-19 policies. The very strong positive reaction of Chinese equities and base metals, along with other commodities such as oil, to even a small relaxation of their COVID-19 policies is a good indication that these possibilities were not “priced in.” In many of our commentaries, we have highlighted the importance of the 10-year Treasury yield in terms of its affect on equity valuations, and in particular on growth stocks. To the extent that the 10-year Treasury yield remains “contained,” it would be beneficial for many equity valuations.
Another reason for our relatively sanguine view of equities for the next month is that it is between “earnings seasons.” We continue to expect downward earnings and margin revisions. The extent to which the U.S. enters a recession and to the extent that recession is “shallow” or “severe” could be determinative of equity valuations. We would also like to highlight that equity rallies such as seen on Thursday are most frequent in “bear markets.” Historically, some of the most extreme equity rallies occur during bear markets. Bear markets have a propensity of making it difficult to maintain “short” positions. We remain agnostic on possible “ultimate” levels of various financial markets.
Source: Goldman Sachs, Looking past lockdowns (11-10-2022)
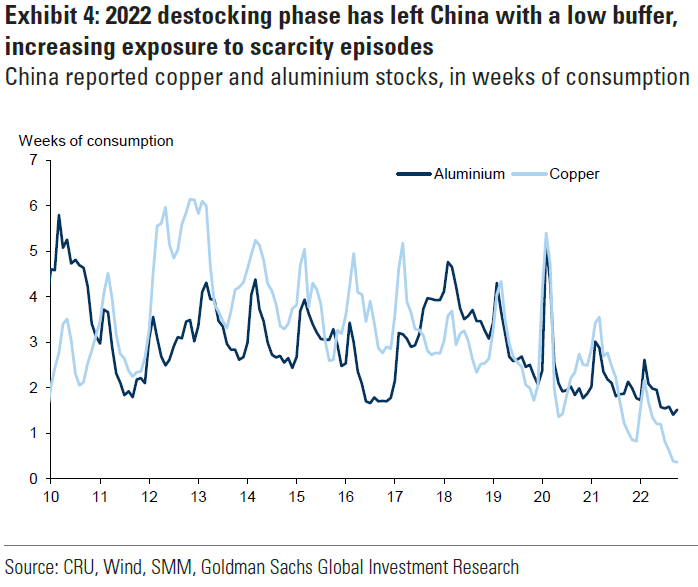
Source: Goldman Sachs, Reopening upside (11-8-2022)
“Looking for Adventure”
The persistent volatility in financial markets in 2022 was on display once again this week, particularly on Wednesday and on Thursday when the October CPI was announced. We maintain our conviction that the best approach to investing is to “keep an open mind” and to be willing to change according to incoming data. This approach has been useful especially since the pandemic began and since the Russian invasion of Ukraine. Given all the unknowns and variables that must be considered in deciphering these markets, we have chosen to look at this exercise as an “adventure.” This brought to mind Steppenwolf’s song “Born to Be Wild.” We remain ready, willing and able: “Looking for adventure; In whatever comes our way.” In this respect, we feel ”Like a true nature’s child; We were born, born to be wild.” In our opinion, the key to keeping an open mind is to have as few preconceptions as possible. We also believe that this happens to be one of the key characteristics of creativity in general – trying to view things as if for the first time. But at the same time, it is also important to be aware of history – such as seasonal trends – in analyzing financial markets. Keeping an eye on market reactions to news helps us to decipher what’s priced in already.
Focus on What’s Priced In – October CPI
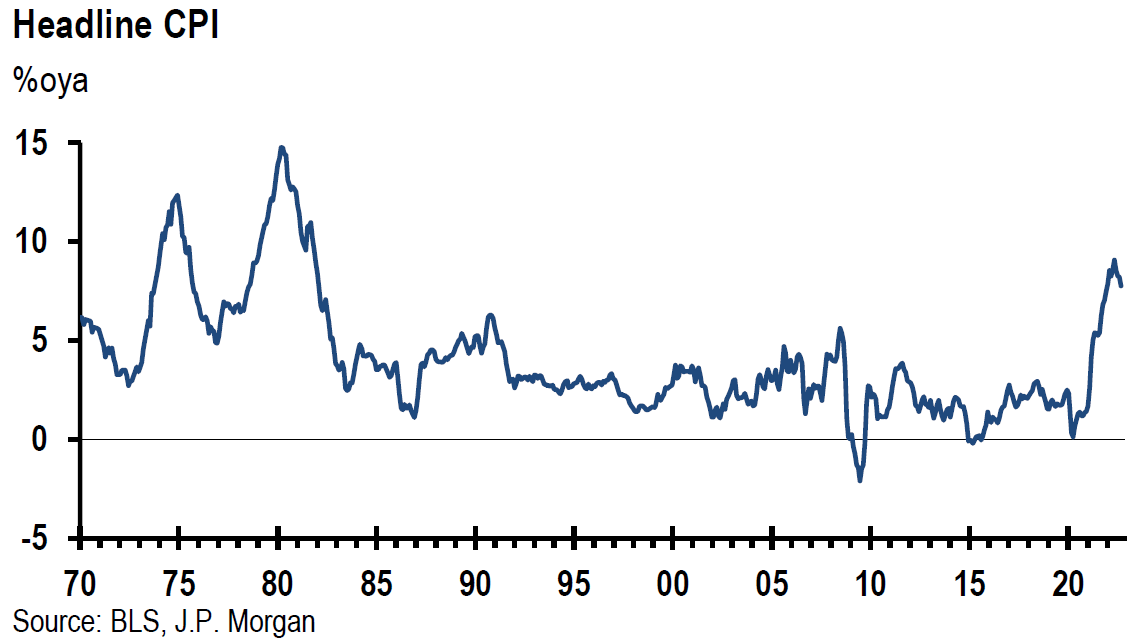
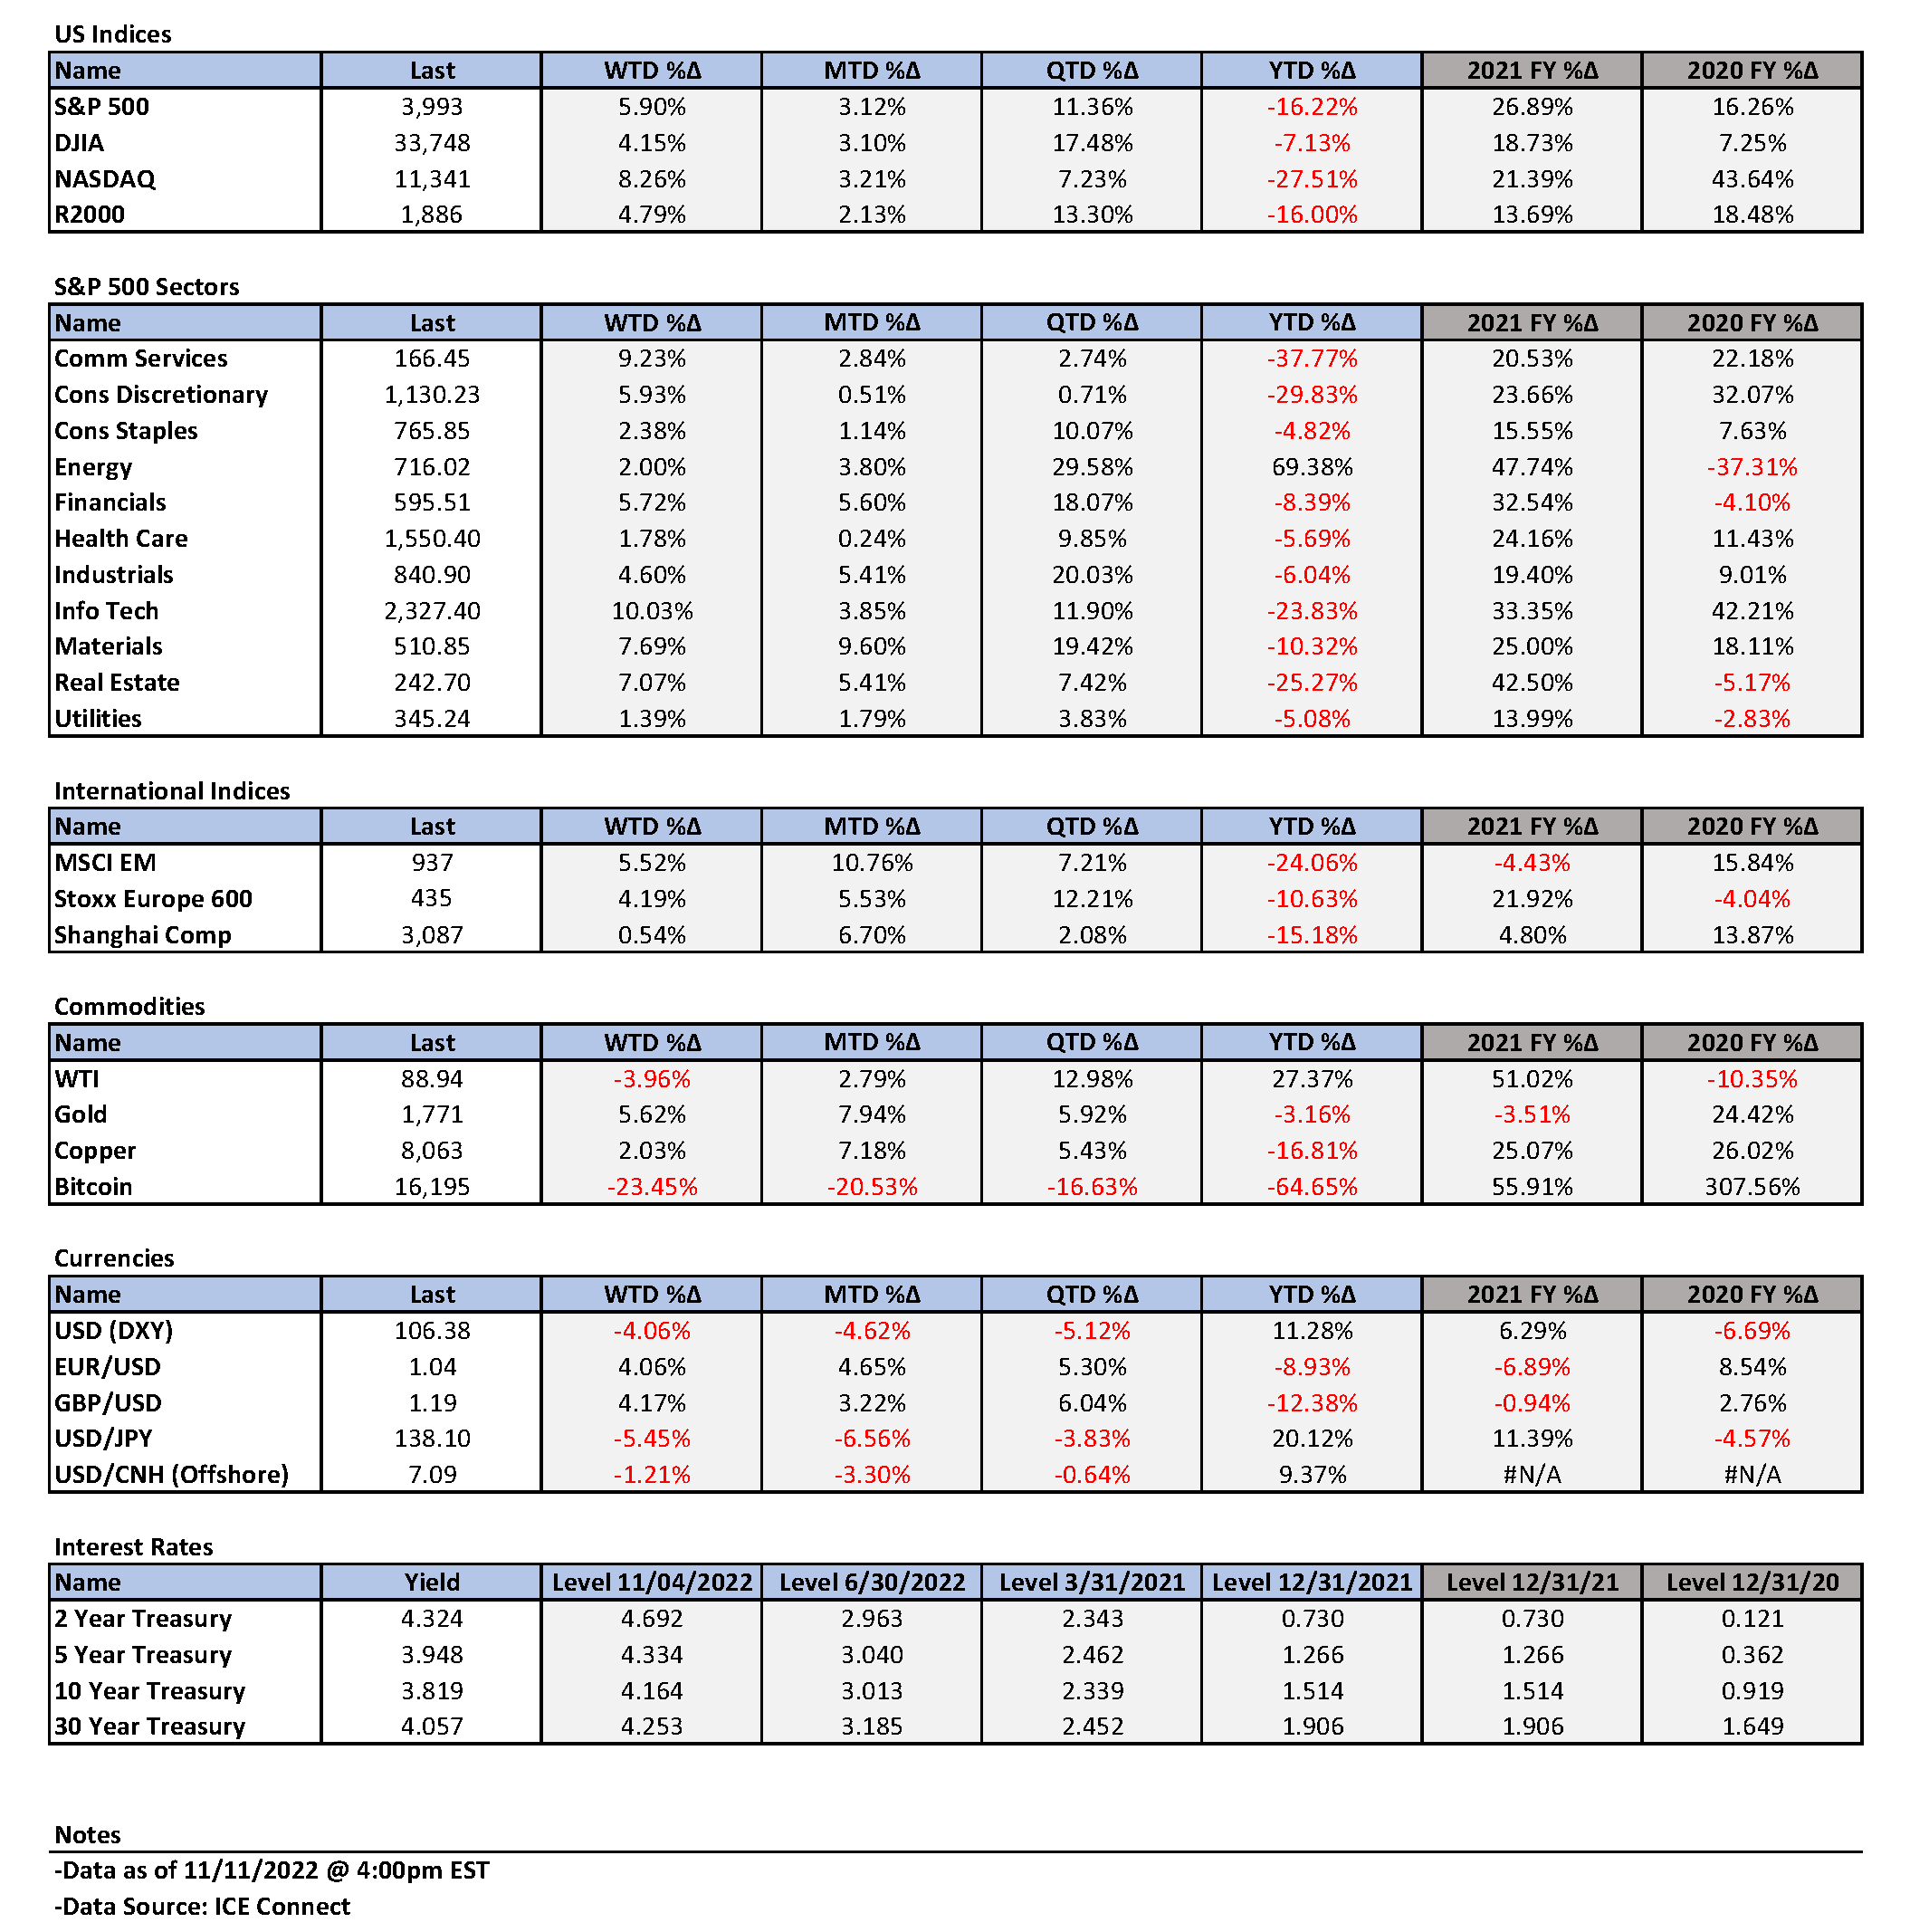
As we outlined in our October 14 weekly, it was our continued focus on observing financial markets’ reactions to various types of news and changing assumptions that help us decipher what’s “priced in” so that we might take better advantage of market volatility. It was this approach that led us to our high level of conviction that the opening low equity prices on Thursday, October 13 presented compelling risk/reward opportunities to purchase selected securities. In contrast to that Thursday’s higher-than-expected CPI reading, this Thursday’s CPI for October was less than expected. The financial markets’ reaction was even more dramatic. Interest rates and the U.S dollar (USD) traded lower and equities traded generally higher. The 10-year Treasury yield dropped over 30 basis points (bps) to close at 3.82%. As represented by the DXY index – a weighted USD index versus six major currencies – the USD traded more than 2.25% lower and closed at 108.04. According to CNBC that day, this was the USD’s biggest one-day decline in ten years. DXY continued its decline the next morning hitting the 107.0 level. Nasdaq closed 7.35% higher, as the S&P 500 rose 5.53% and the Dow Jones industrial Average closed 3.69% higher. These were the largest daily increases in both the Nasdaq and the S&P 500 indexes since April 2020. The financial markets continued to be volatile between these two CPI days. After trading above 4.3% intraday and closing at 4.21% on October 21, the 10-year Treasury yield closed as high as 4.25% on October 24. Throughout this period, we have maintained our conviction that the level of interest rates and their volatility have continued to be the principal drivers of equities and currencies in general. Of course, earnings and margins announcements have been important for individual companies as well. But, as indicated in our commentaries, it is our contention that the relative containment of interest rates and USD also played a prominent role in limiting the extent of the “spillover” effects from negative earnings announcement to the overall equity markets. We would treat a closing yield of over 4.3% on the 10-year Treasury yield as a very challenging hurdle for equity markets to overcome.
Potential for U.S. Inflation Accelerating Downtrend
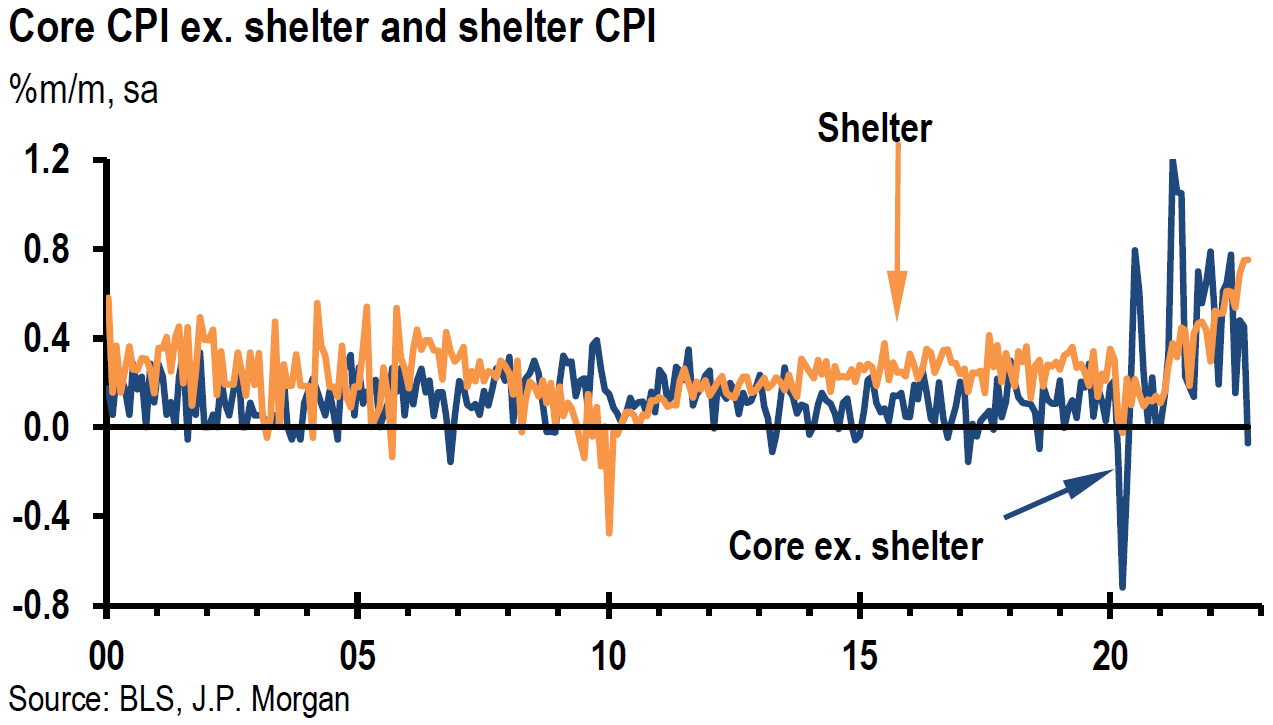
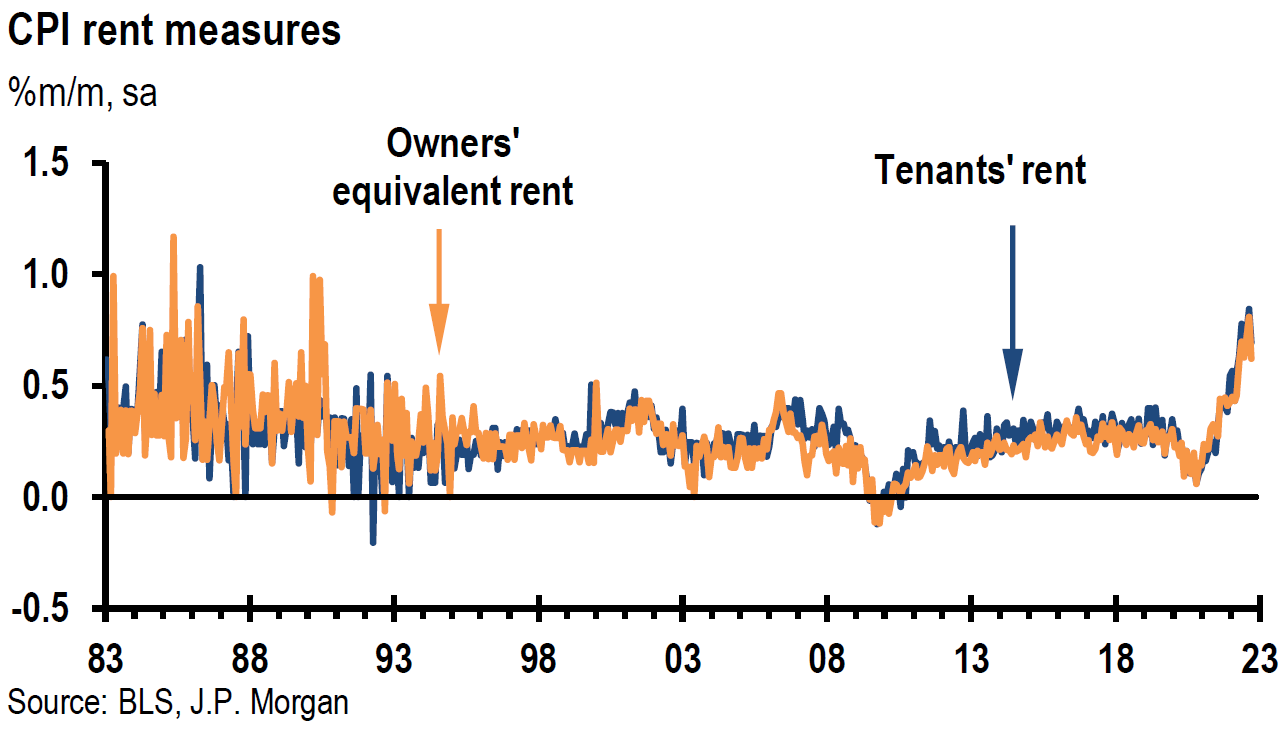
For the past few weeks, we have postulated that there was a high likelihood that U.S. inflation could start to descend at a quicker pace than the Fed or many investors and analysts were anticipating. We based this opinion on the many surveys we have analyzed over the past month, as well as earlier reports. Furthermore, we have discussed in our prior commentaries, examples of slowing economic growth rates, slower inflation rates and diminishing wage pressure trends. Additionally, we also highlighted in our October 14 report how the official government figures of shelter costs lag many of the more-up-to-date private surveys of rental trends. We believe that we detected in the latest October CPI figures trends that could be interpreted as substantiating our notion of slowing inflationary trends.
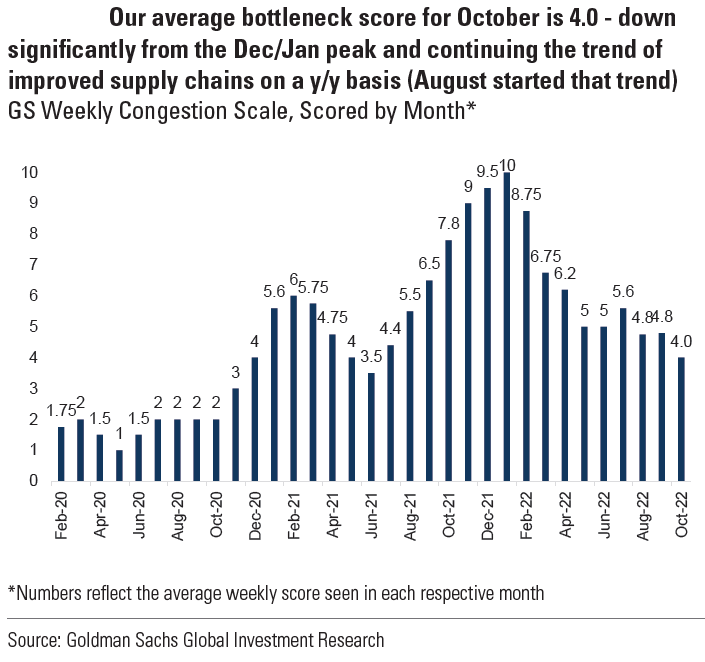
Source: Goldman Sachs, GS Supply Chain Congestion Scale: Nov 7th; Index Up Slightly W/W, but Scale Unchanged at ‘4’ (11-7-2022)
Analysis of CPI – More Favorable Trends Under the Surface
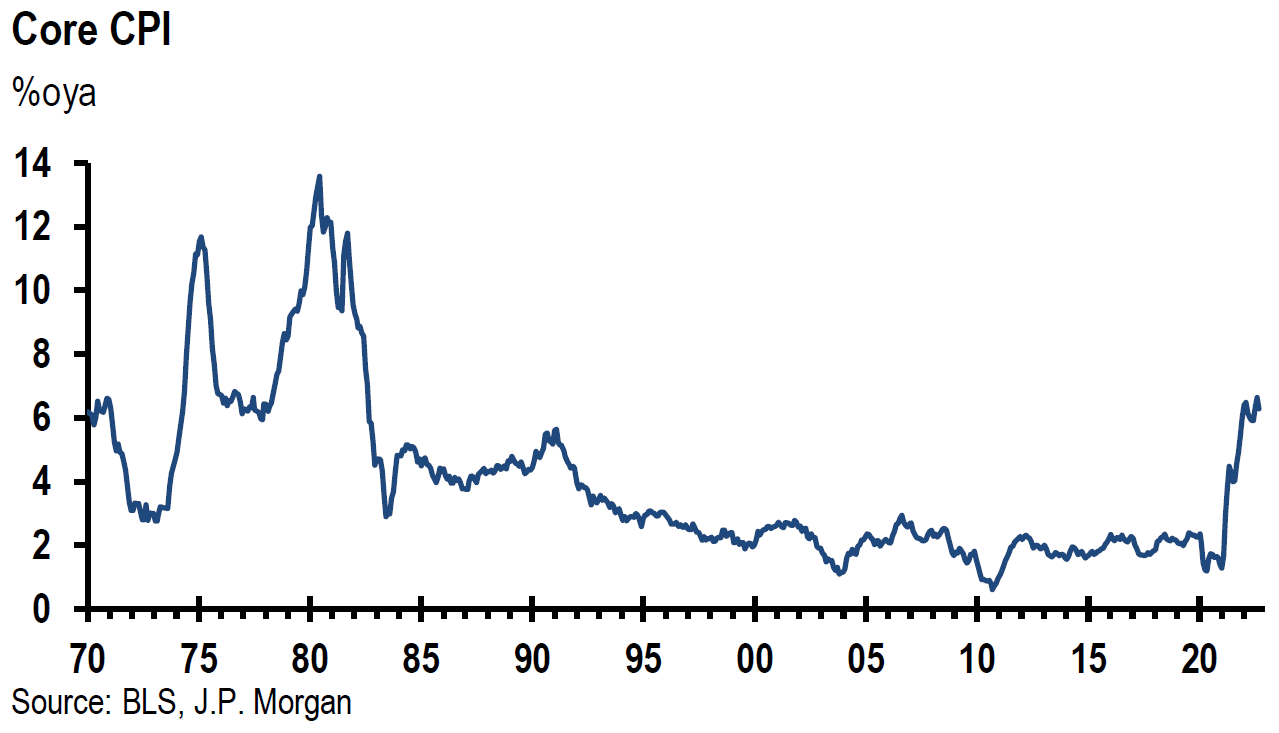
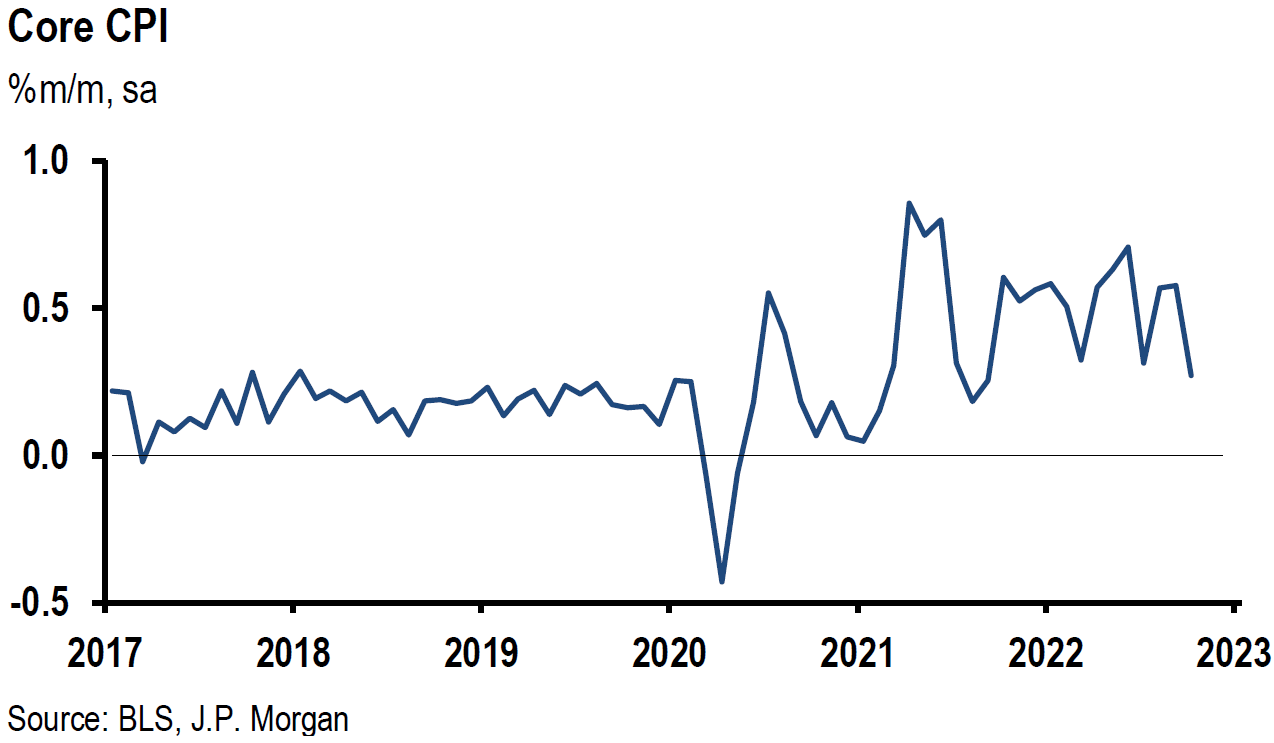
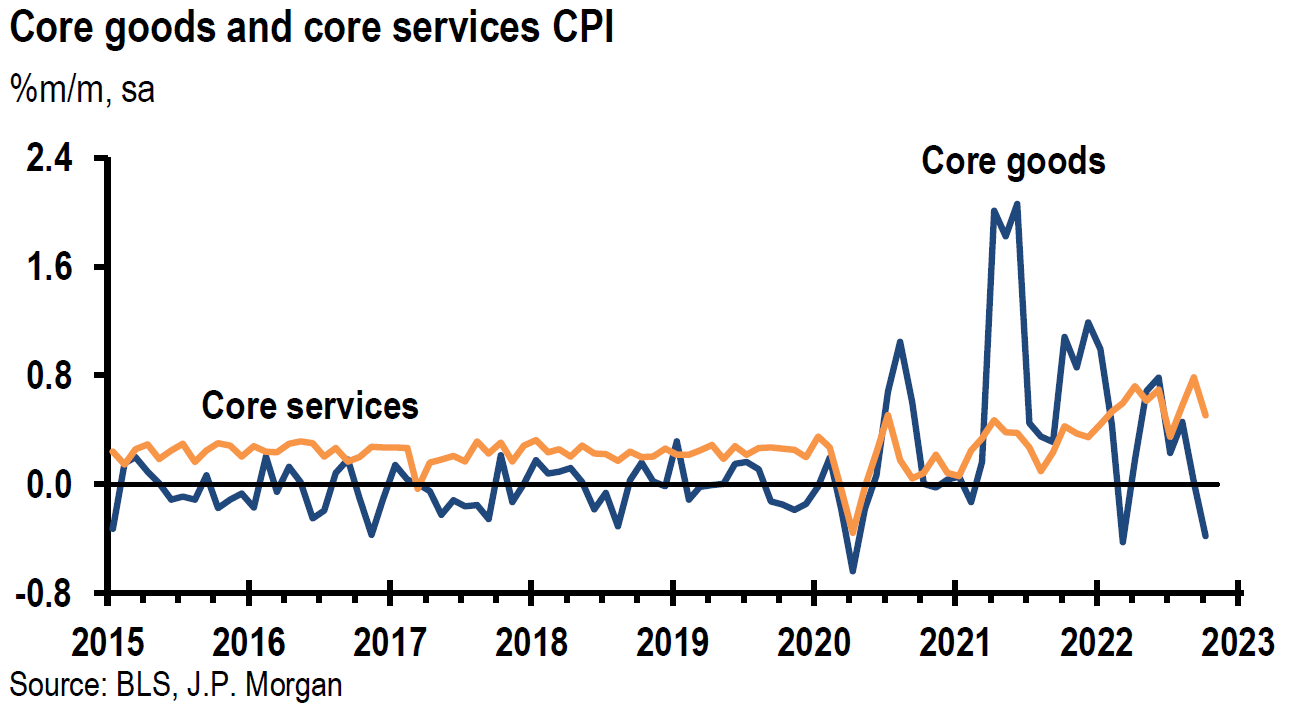
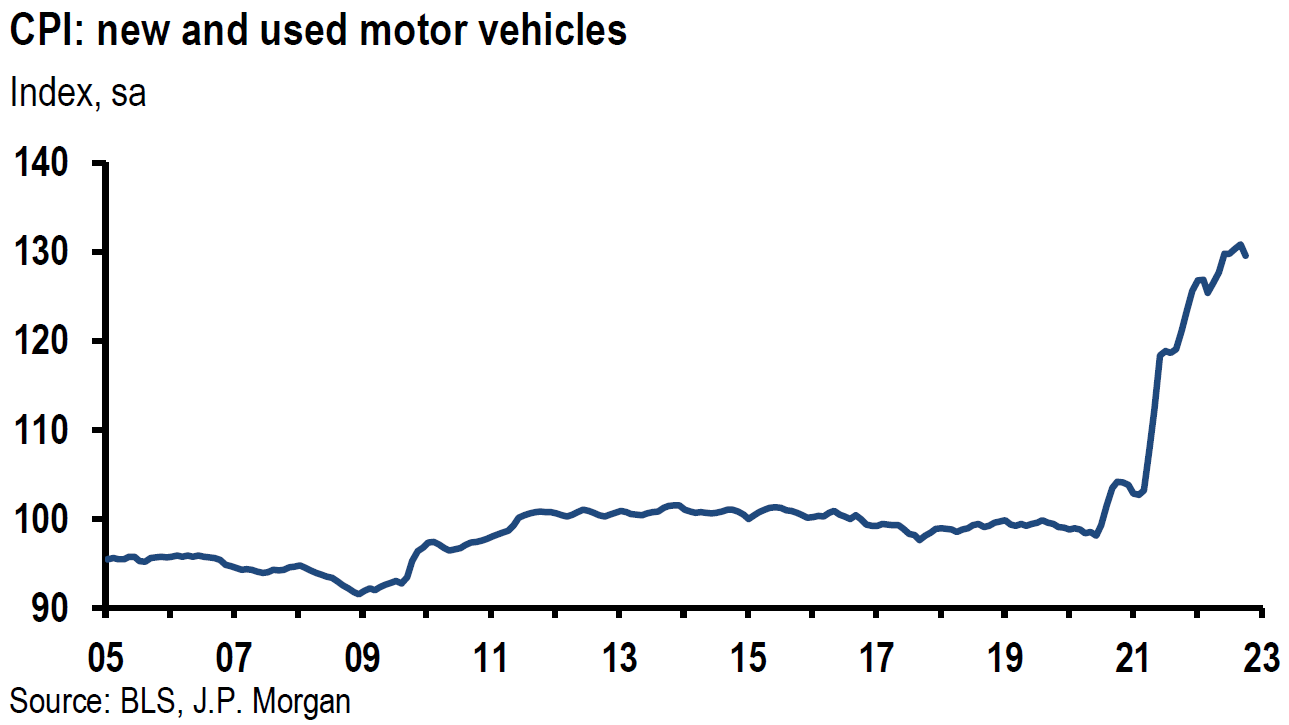
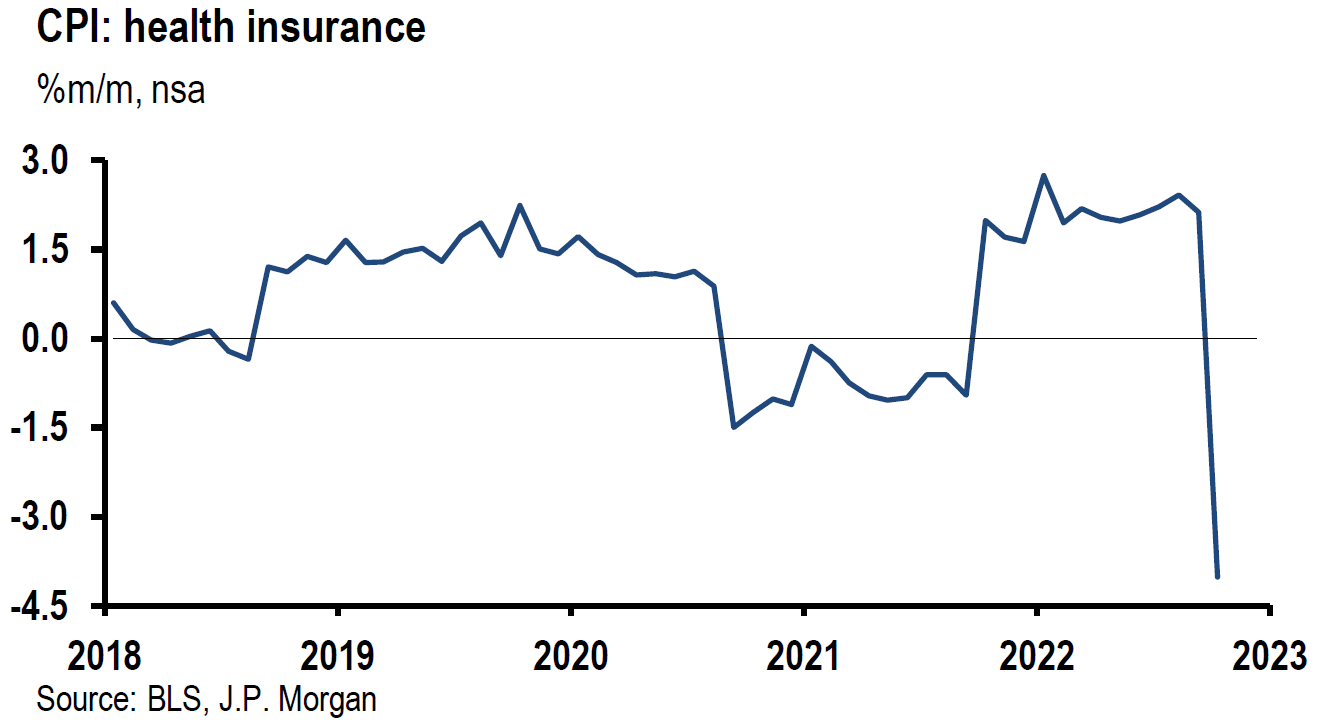
The October headline CPI was 0.4% higher month-over-month (m/m) and 7.7% higher year-over-year (y/y) versus expectations of +0.6% m/m and +7/9% y/y. The 7.7% y/y increase was the slowest twelve month increase since January 2022. Core CPI, which excludes food and energy, was +0.3% m/m and +6.3% y/y versus expected +0.5% m/m and +6.5% y/y. Shelter costs are considered generally one of the “stickiest” – most slow to diminish – components of inflation. It corresponds to roughly 40% of core inflation and 30% of headline inflation. But according to the Bureau of Labor Statistics (BLS), October shelter costs contributed over half of the monthly headline inflation increase. Shelter costs were 0.8% higher m/m and +6.9% y/y in October versus 0.7% higher m/m in September. The monthly increase in shelter inflation was the largest monthly gain since August 1990. On the surface, this looks like shelter costs are increasing at a faster pace. But a much more benign trend of shelter inflation is revealed on closer examination. The October rent component of shelter rose 0.69% m/m versus 0.84% m/m in September and owners’ equivalent rent (OER) rose 0.62% m/m in October versus 0.81% m/m in September. So, how could the monthly pace of shelter inflation have risen in October? The answer lies in the very volatile component of lodging away from home – hotels, etc. – which rose 4.9% compared to a decrease of 1.0% m/m in September. We remain hopeful that the rental and OER measures of shelter inflation will continue to show a decelerating trend of monthly increases. The Fed has acknowledged recently its awareness of the quicker trajectory lower of rental measures in the more up-to-date private rental data. In fact, excluding shelter costs, the core CPI was 0.1% lower m/m in October, which was one of the softer monthly changes reported in recent decades. The core goods inflation was particularly soft, showing a monthly decline of 0.4% that was the largest such decline since March. The decrease in goods inflation largely reflected a monthly decline of 2.4% for used cars and trucks, as well as a 0.7% decline for apparel. New car prices rose 0.4% m/m – slowest pace since March – versus +0.7% in September m/m with more incentives offsetting higher sticker prices. Yet another factor that pushed down core inflation was the 4.0% decrease m/m of health insurance that led to a 0.5% m/m decrease in medical care. This aggregate averaged a monthly gain of 0.5% over the past twelve months, and is expected to show an average monthly decrease of similar size over the next twelve months. Headline inflation for October was exacerbated by the 1.8% m/m increase in energy prices that included increased gasoline and electricity prices. This was the first month of energy price increases after three consecutive monthly declines. Monthly food increases of 0.6% m/m also contributed to headline CPI.
Source: JP Morgan, US: CPI data (finally) below expectations (11-10-2022)
China PPI – Relevant for U.S. CPI?
Many economists believe that China’s Producer Price Index (PPI) tends to precede similar changes in the U.S. by one or two months. Given China’s October PPI, this would be an encouraging sign for a decelerating pace of U.S. inflation. China’s October PPI dropped 1.3% y/y – the first y/y decrease since December 2020. Iron, steel and coal saw the sharpest declines in China’s October PPI. We assume that these decreases were related to the dearth of new projects in China’s property sector. Therefore, we do not think that the relationship of China’s PPI to U.S. inflation will be very instructive under these circumstances.
U.S. Midterm Elections
The U.S. midterm elections were much anticipated as well. We surmise that the assumed narrow Republican majority of the House of Representatives will be sufficient to stymie expansive fiscal policy measures. The presumed “red wave” of Republican victories never materialized. Many blamed former president Donald Trump’s presence and his preferred candidates’ poor showing as contributing to this outcome. Many political pundits thought that Trump’s influence in the Republican Party and his prospects for winning the Republican nomination for the presidency in 2024 could be diminished by the election results. As of this writing, control of the Senate was still not decided. Many pundits expressed concern that this divided Congress might face a severe challenge in increasing the U.S. debt limit by the presumed deadline of late next year. Social issues such as the Roe v. Wade decision, other abortion issues and character also seemed to weigh on election results. The larger-than-expected turnout of young adults was attributable largely to such issues.
Slowing U.S. Economy
Other than the much-anticipated release of October CPI data, this was a relatively light week for U.S. economic data. But most of the released data was consistent with our prior commentaries’ depiction of a slowing economy and a slower pace of inflation increases.
Fed’s Senior Loan Officer Survey
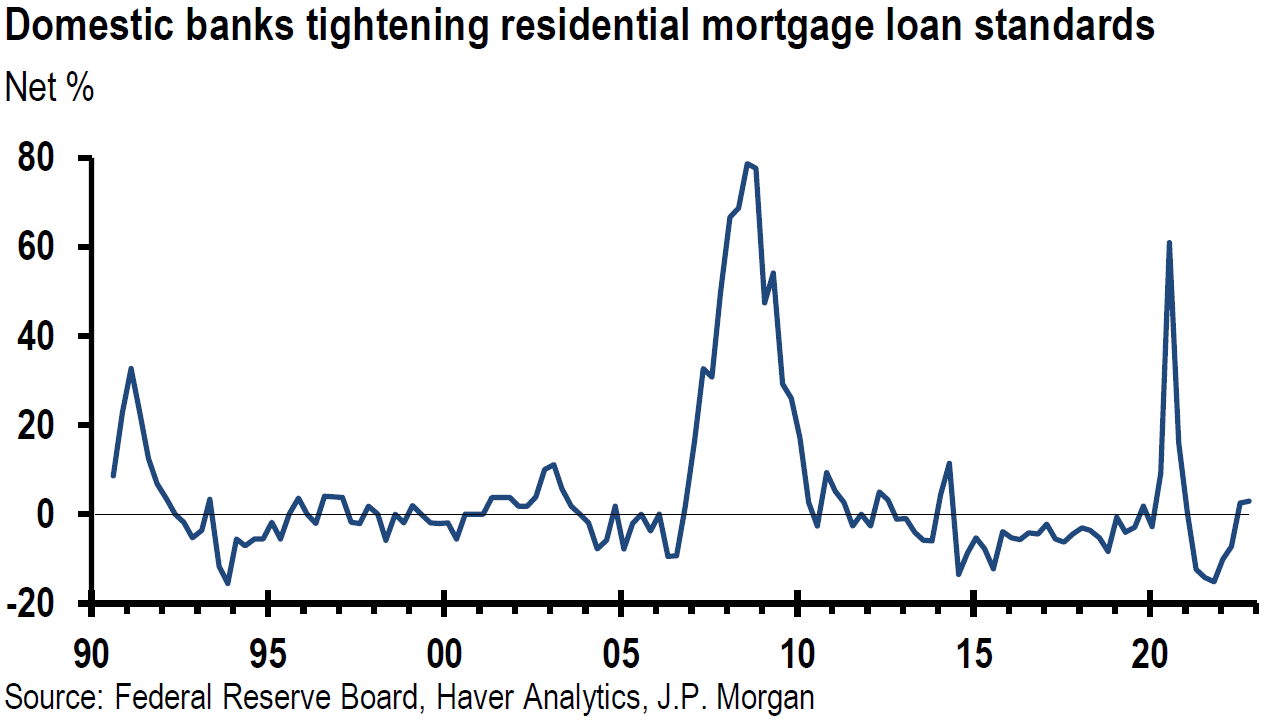
The Fed’s Senior Loan Officer Opinion Survey (SLOOS) for Q3 was released early this week. In general, this survey showed tighter lending standards by banks and weaker demand when compared to the Q2 survey. These findings supported our “findings” of a weakening U.S. economy and rising risks of recession. Most banks reported at least a 40% probability of a U.S. recession over the next twelve months. But household demand for credit card loans increased, was unchanged for other consumer loans and weakened for auto loans. Eighty percent of banks reported decreased demand for residential mortgages. All banks that tightened standards on commercial and industrial loans (C&I) or credit lines for businesses cited less favorable or more uncertain economic outlook as playing a role. Demand for business loans was lower in general. These are examples of the tighter financial conditions that the Fed was seeking in their attempt to slow the economy and rein in inflation.
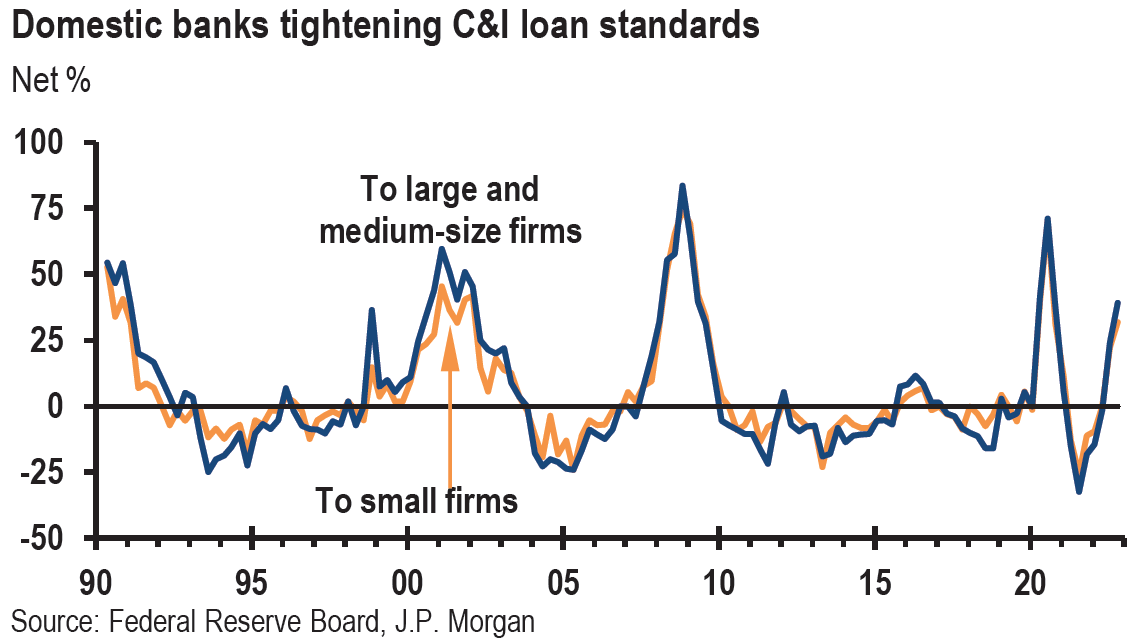
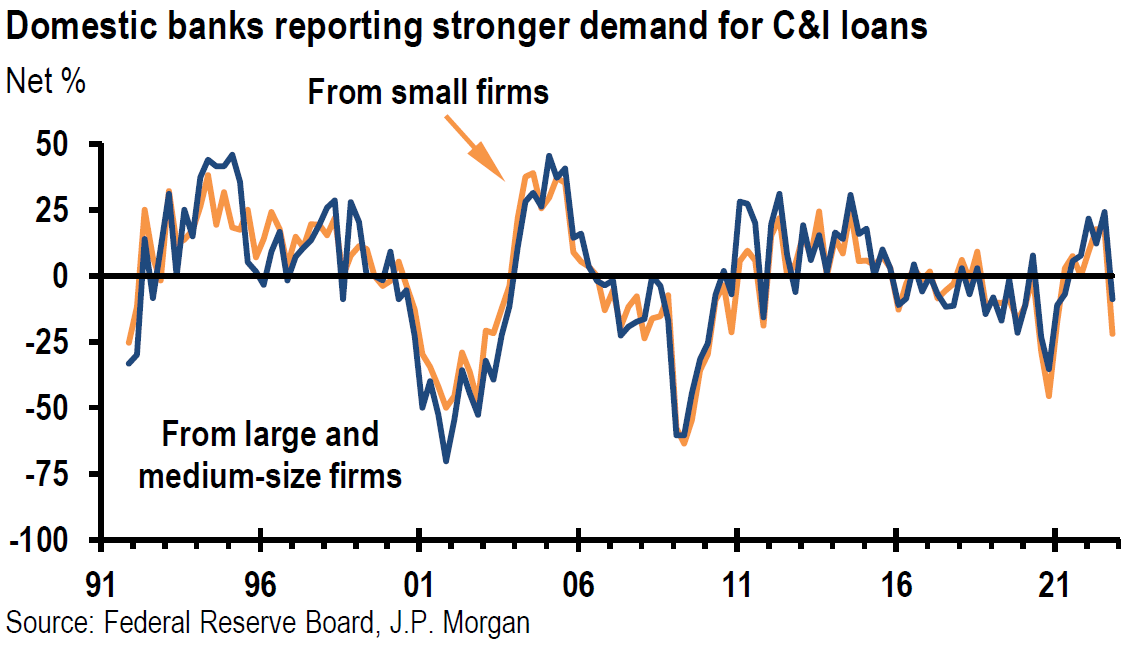
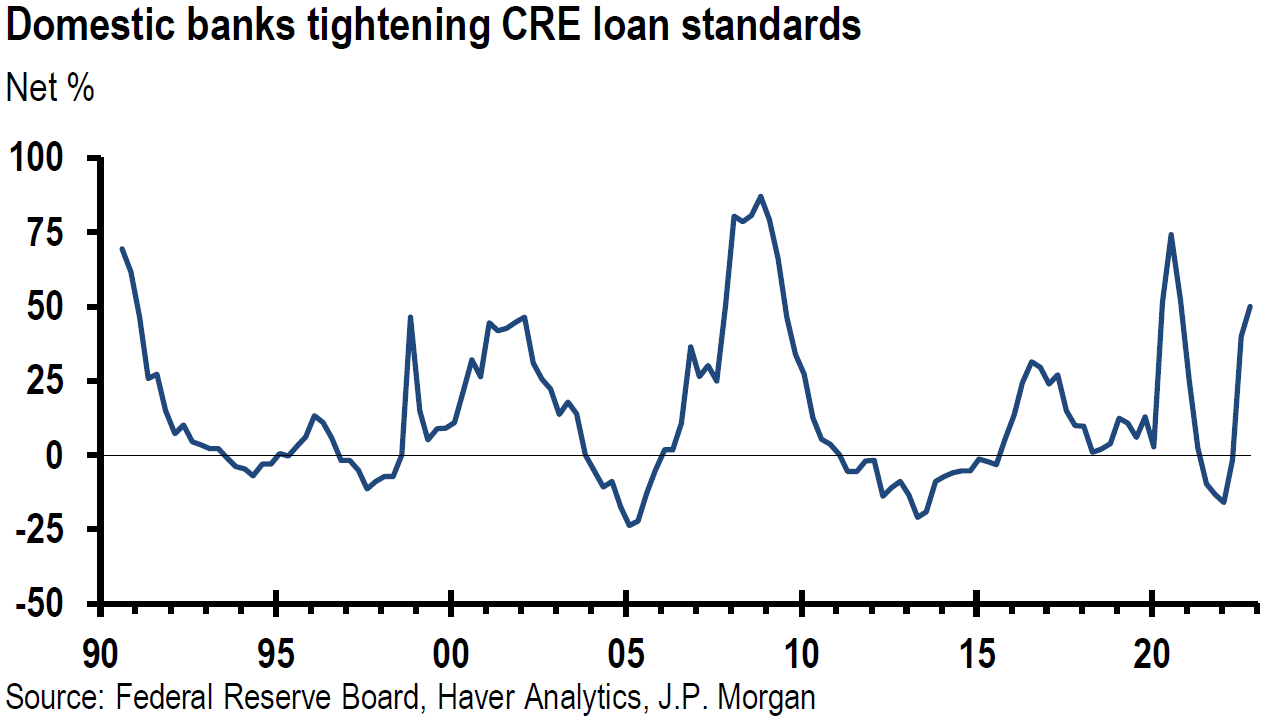
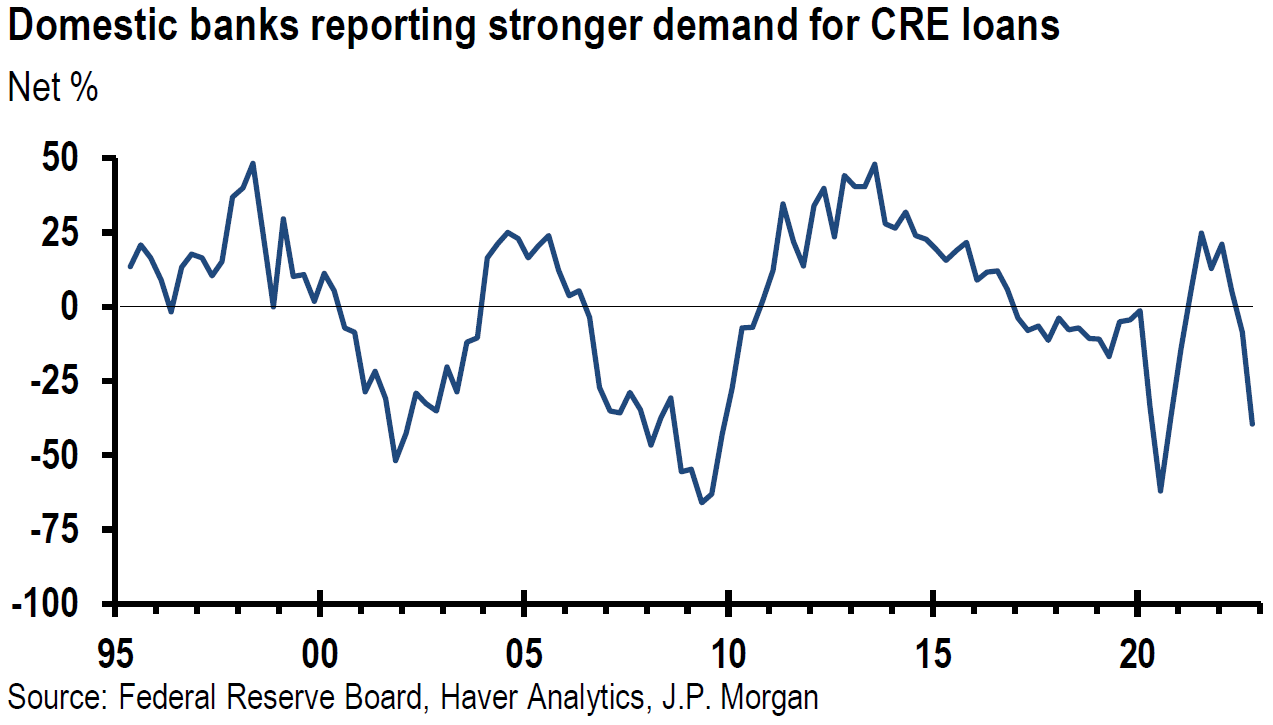
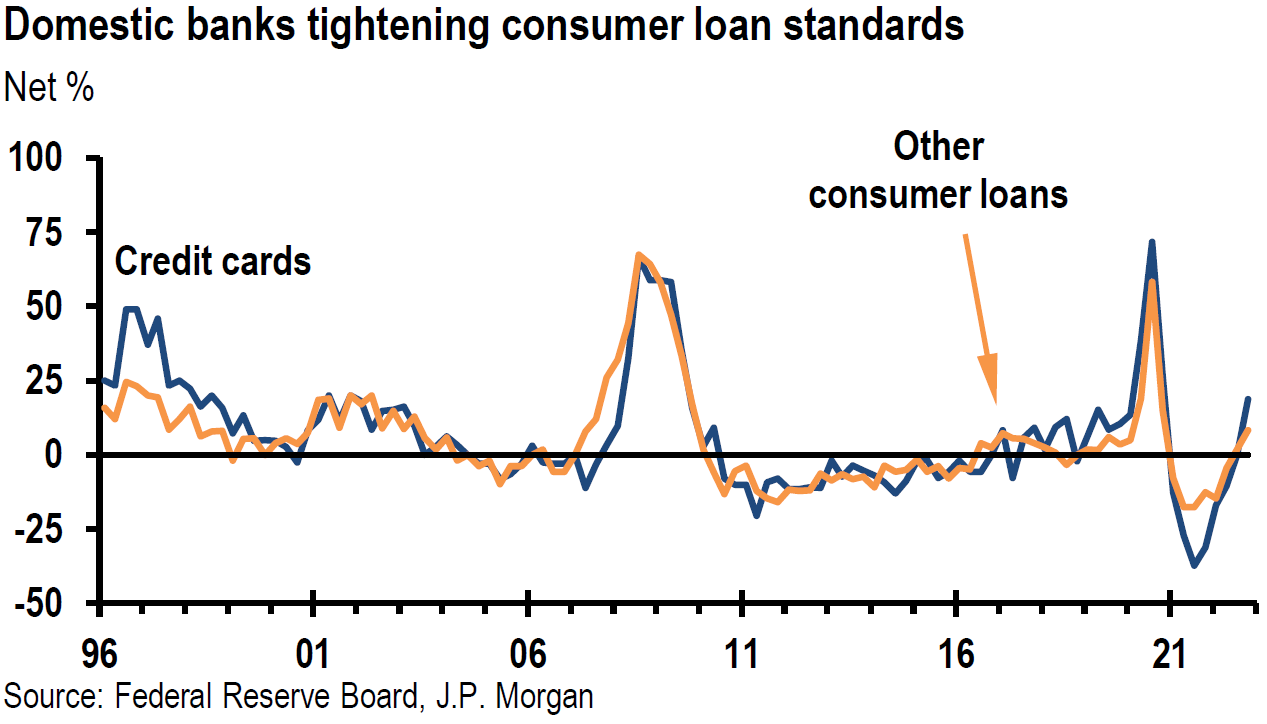

Source: JP Morgan, US: SLOOS shows tighter lending standards and weaker demand (11-7-2022)
U.S. Consumer Credit
Although consumer credit grew by $24.98 billion m/m in September, it was less than the expected $30.0 billion increase and smaller than the $30.18 billion increase in August, which was revised lower from $32.24 billion. Consumer borrowing rose at a seasonally-adjusted rate of 6.4%. Revolving debt, which includes credit cards, grew 8.7% and non-revolving credit, which includes auto loans and student loans, increased 5.7%. We believe that these figures are somewhat consistent with the Fed’s loan officer survey.
U.S. Housing Market
According to Fannie Mae’s latest monthly survey, consumer confidence in the housing market hit a new low in October. Sixteen percent of consumers thought it was a good time to buy a home now, which was the lowest level since 2011 when the survey began. According to Black Knight – provider of data and analytics to mortgage lending and real estate industries – 37% of consumers expect lower home prices over the next twelve months, compared to 35% in September. Home prices for the three-month period since June were 2.6% lower. This was the first three-month period of lower home prices since 2018 and was the worst three-month decline since early 2009. But perhaps the dramatic drop in the average rate on the 30-year fixed rate mortgage, if sustained, might make consumers more sanguine about the housing market. According to Mortgage News Daily, the average 30-year mortgage dropped 60 bps from 7.22% to 6.62% on CPI-day. This matched the record one day drop at the beginning of the pandemic. However, this lower rate was still double that of the beginning of this year.
NFIB Small Business Optimism Index Continues Negative Trend
The National Federation of Independent Business (NFIB) small business optimism fell 0.8 points in October to 91.3 – its tenth consecutive month below the 49-year average of 98. According to NFIB’s chief economist, “Owners continue to show a dismal view about future sales growth and business conditions, but are still looking to hire workers.” The number of employers who expected to increase their employees over the next three months fell to 20%. Inflation, supply chain disruptions and labor shortages continued to hinder small firms’ production. Owners expecting better business conditions over the next six months fell another two points from September to a net negative thirteen. Forty-six percent of owners claimed that job openings were hard to fill.
U.S. Jobless Claims
For the week that ended November 5, initial jobless claims for unemployment insurance rose by a more-than-expected 7,000 to 225,000. For the week that ended October 29, continuing claims edged higher, from 1.487 million to 1.493 million. This data may indicate some cooling off in the U.S. labor market, even though we would characterize it as a very slight cooling. As indicated in other surveys examined in our prior commentaries, we deem other measures of a cooling labor market as exemplifying this trend in a more clear manner.
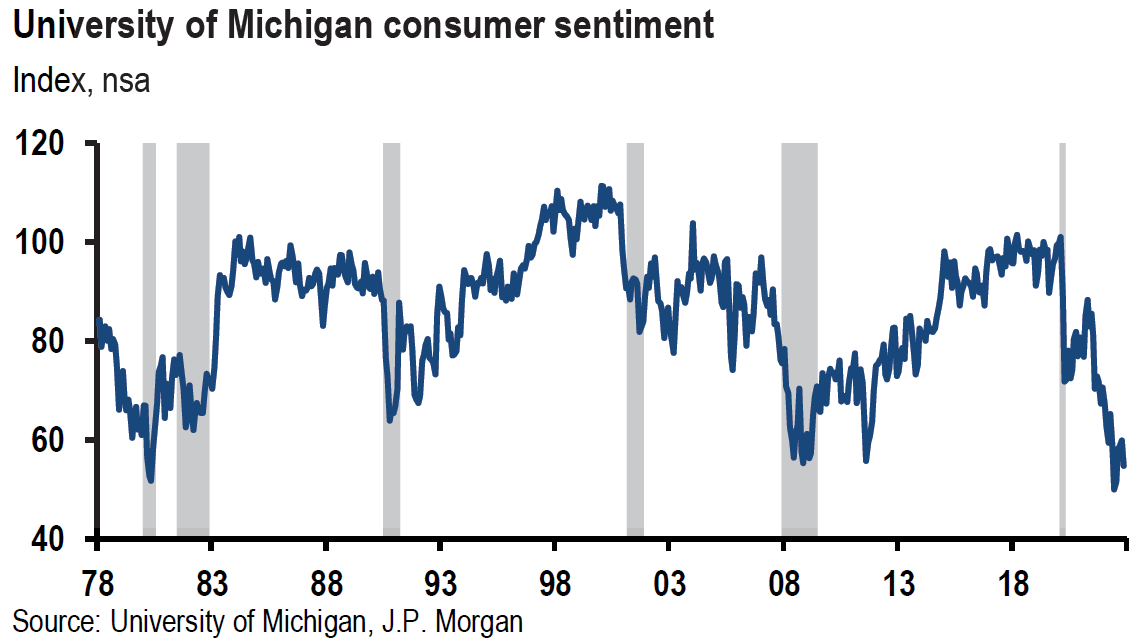
Consumer Sentiment – U. of Michigan Preliminary November Survey Disappoints
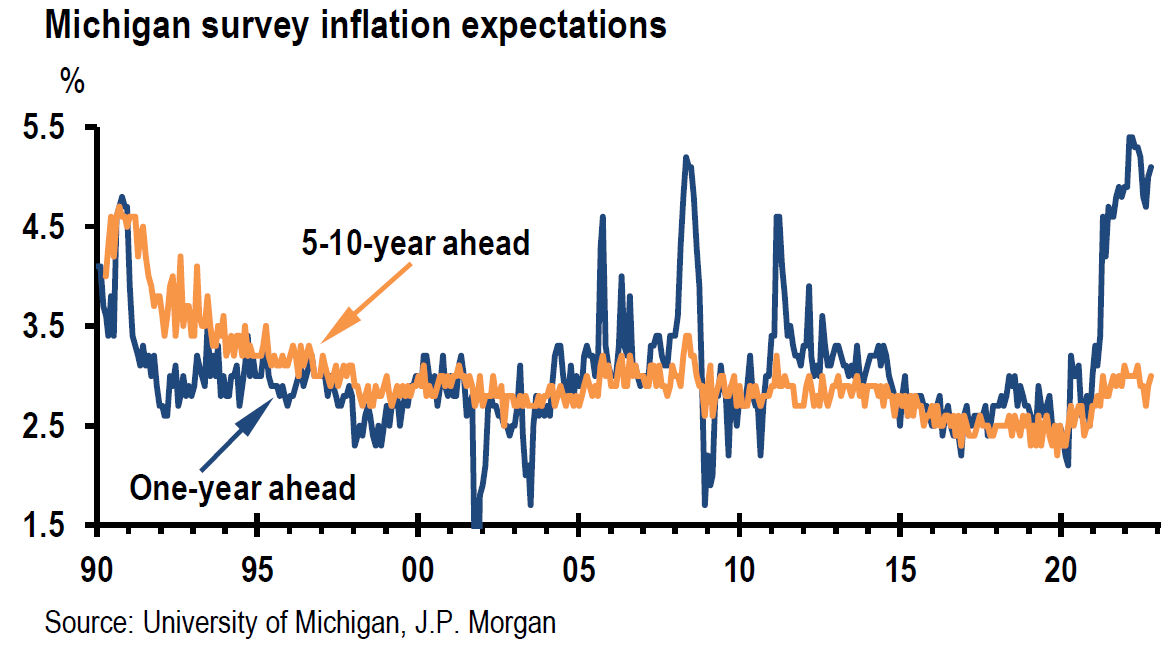
Consumer sentiment in the U.S. fell to 54.7 (lowest since July) from 59.9 in October. The current economic conditions index fell from 65.6 to 57.8 and expectations dropped to 52.7 from 56.2. Year ahead inflation expectations increased to 5.1% from October’s reading of 5.0%. Five-year ahead inflation expectations increased to 3.0% from 2.9%. According to the director of Surveys of Consumers: “All components of the index declined from last month, but buying conditions for durables, which had markedly improved last month, decreased most sharply in November, falling back 21% on the basis of high interest rates as well as continued high prices. Instability of sentiment is likely to continue, a reflection of uncertainty over both global factors and the eventual outcomes of the elections.” This is yet another example of how quickly things can change in the current economic environment and of the volatility of any changes. We continue to highlight “rapidity of change” as a hallmark of this period since the pandemic began and the Russian invasion of Ukraine.
Source: JP Morgan, US: Consumer sentiment drops again (11-2-2022)
Bottom Line
For the time being, we are maintaining our basic investment approach as expressed in last week’s commentary. We continue to prefer high quality big cap stocks that offer good balance sheets, as well as relatively stable cash flows and profit margins. We expect volatility across virtually all financial markets to continue. However, after Thursday’s dramatic movements in financial markets, we believe that there is a high probability that these movements in U.S. equities, interest rates and USD could continue until mid-December.
A lower USD helps commodity prices and U.S. companies with overseas revenues. Many emerging markets have shown dramatic increases in their equity prices recently alongside USD decreases. A “reopening” of China should also help boost commodity prices – especially for base metals such as copper. Lower Treasury yields should be beneficial for equity valuations, and in particular growth stocks. We continue to view the 10-year Treasury with a yield close to 4.2% as a possible hedge against a recession in a diversified portfolio for those so inclined. This week’s trading and rapid changes among sectors and various financial markets illustrates the advantage of a diversified portfolio for long term investors. The rapidity of change might often preclude attractive entry points for desired long-term positions.
We remain wary of anticipated downward revisions in earnings and margins of many companies. The extent of the Fed’s tightening policies could be determinative of these revisions. To what extent the Fed will “cause” a recession and to what extent a recession would be “shallow” or “severe” remains an open question. A severe recession might require more drastic future revisions. Extreme equity rallies such as Thursday’s rally, are historically more typical of bear markets.
We think that a 50 bps hike in the federal funds rate at the Fed’s mid-December meeting is even more likely after this week’s CPI announcement. We continue to anticipate 25 bps hikes in February and March are still probable given the Fed’s stated preference for erring on the side of “over-tightening.” This is in spite of our belief that a more evident and rapid deceleration of U.S. inflation could occur at any time.

Definitions
Headline Consumer Price Index (Headline CPI) – Headline inflation is the raw inflation figure reported through the Consumer Price Index (CPI) that is released monthly by the Bureau of Labor Statistics (BLS). The CPI calculates the cost to purchase a fixed basket of goods to determine how much inflation is occurring in the broad economy. The CPI uses a base year and indexes the current year’s prices, according to the base year’s values.
Core Consumer Price Index (Core CPI) – Core inflation removes the CPI components that can exhibit large amounts of volatility from month to month, which can cause unwanted distortion to the headline figure. The most commonly removed factors are those relating to the costs of food and energy. Food prices can be affected by factors outside of those attributed to the economy, such as environmental shifts that cause issues in the growth of crops. Energy costs, such as oil production, can be affected by forces outside of traditional supply and demand, such as political dissent.
Federal Funds Rate – The term federal funds rate refers to the target interest rate set by the Federal Open Market Committee. This target is the rate at which commercial banks borrow and lend their excess reserves to each other overnight.
U.S. Dollar Index (DXY) – The U.S. dollar index is a measure of the value of the U.S. dollar relative to a basket of foreign currencies.
Shelter Costs – Shelter costs are mortgage payments, property insurance (if required), homeowner association dues, rent, gas, electricity, heating fuel, water, sewer, garbage collection service, and real property taxes.
Owners’ Equivalent Rent (OER) – Owners’ equivalent rent is the amount of rent that would have to be paid in order to substitute a currently owned house as a rental property. This value is also referred to as rental equivalent.
Producer Price Index (PPI) – The producer price index (PPI), published by the Bureau of Labor Statistics (BLS), is a group of indexes that calculates and represents the average movement in selling prices from domestic production over time. It is a measure of inflation based on input costs to producers.
Lodging Away from Home (In CPI) – Lodging away from home is a component of the shelter index in the Consumer Price Index (CPI). It has two components: (1) Housing at school, excluding board, and (2) Other lodging away from home including hotels and motels.
Basis Points (bps) – A basis point is one hundredth of one percent, used chiefly in expressing differences of interest rates.
S&P 500 – The S&P 500 is a total return index that reflects both changes in the prices of stocks in the S&P 500 Index as well as the reinvestment of the dividend income from its underlying stocks.
NASDAQ – The Nasdaq Composite Index is the market capitalization-weighted index of over 2,500 common equities listed on the Nasdaq stock exchange.
Dow Jones Industrial Average (DJIA) – The DJIA is a stock market index that tracks 30 large, publicly owned blue-chip companies trading on the New York Stock Exchange and Nasdaq.
Senior Loan Officer Opinion Survey (SLOOS) – The Senior Loan Officer Opinion Survey on Bank Lending Practices is a quarterly survey of up to eighty large domestic banks and twenty-four U.S. branches and agencies of foreign banks that is conducted by the Federal Reserve.
Fed-speak – Fed-speak is a technique for managing investors’ expectations by making deliberately unclear statements regarding monetary policy to prevent markets from anticipating, and thus partially negating, its effects.
IMPORTANT DISCLOSURES
The views and opinions included in these materials belong to their author and do not necessarily reflect the views and opinions of NewEdge Capital Group, LLC.
This information is general in nature and has been prepared solely for informational and educational purposes and does not constitute an offer or a recommendation to buy or sell any particular security or to adopt any specific investment strategy.
NewEdge and its affiliates do not render advice on legal, tax and/or tax accounting matters. You should consult your personal tax and/or legal advisor to learn about any potential tax or other implications that may result from acting on a particular recommendation.
The trademarks and service marks contained herein are the property of their respective owners. Unless otherwise specifically indicated, all information with respect to any third party not affiliated with NewEdge has been provided by, and is the sole responsibility of, such third party and has not been independently verified by NewEdge, its affiliates or any other independent third party. No representation is given with respect to its accuracy or completeness, and such information and opinions may change without notice.
Investing involves risk, including possible loss of principal. Past performance is no guarantee of future results.
Any forward-looking statements or forecasts are based on assumptions and actual results are expected to vary from any such statements or forecasts. No assurance can be given that investment objectives or target returns will be achieved. Future returns may be higher or lower than the estimates presented herein.
An investment cannot be made directly in an index. Indices are unmanaged and have no fees or expenses. You can obtain information about many indices online at a variety of sources including: https://www.sec.gov/fast-answers/answersindiceshtm.html or http://www.nasdaq.com/reference/index-descriptions.aspx.
All data is subject to change without notice.
© 2024 NewEdge Capital Group, LLC


