

Weekly Summary – April 3-7
Key Observations:
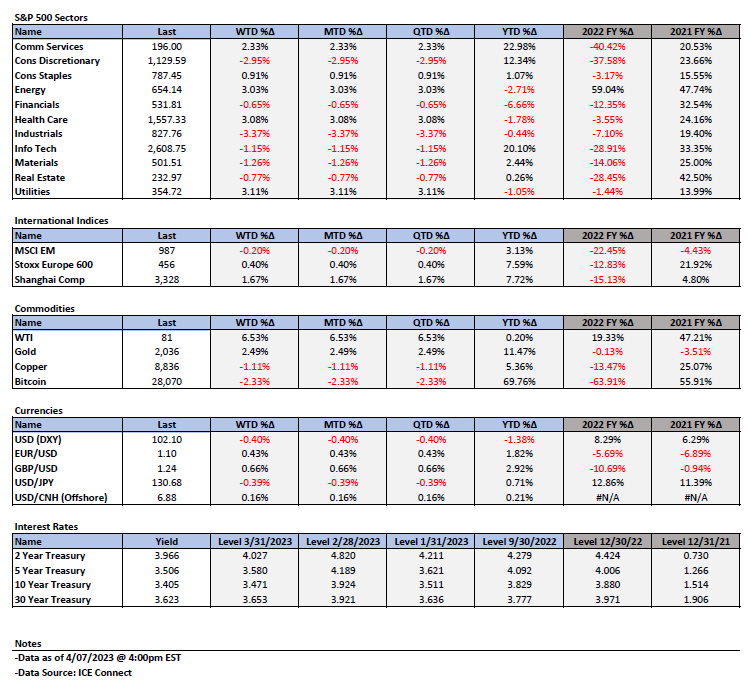
- The recession concerns of last week seemed to intensify markedly this week as most of the economic data analyzed this week was “worse” than expected. The general movement of lower interest rates this week appeared to substantiate this view. Two (health care and utilities) of the top three performing S&P 500 sectors in terms of price suggested that equities were in agreement generally as well. Energy was the other top performing sector and was rebounding from a dismal Q1 performance. It was also assisted by OPEC’s surprise decision to cut its oil production.
- China’s March PMI data was supportive of the view generally that China’s “reopening” was driven mostly by its services sectors. We suppose that an economic rebound in China that was driven more by its manufacturing sectors would have been more supportive of commodity prices. Nevertheless, we view the surprising strength of China’s services sectors as an accelerant of global economic growth.
- U.S. financial markets this week appeared to diverge increasingly from a more hawkish Federal Reserve (Fed) as most of the economic data analyzed this week was weaker than expected. Fed speakers this week seemed determined to raise the federal funds rate above 5% and maintain that level for “some time.” The apparent stability of the banking crisis might embolden Fed officials to raise rates further. Fed officials have indicated repeatedly that they would rather err on the side of “overtightening” to rein in inflation. To diverge from this stance, it is likely that Fed officials must be convinced that the disinflationary process is on a “sustained” downward trajectory. The March U.S. nonfarm payrolls data released on Friday looks as if it might have better aligned financial markets with the Fed’s stated preference of a further hike in rates. After this release, financial markets raised the probability of a hike in the federal funds rate to roughly 70% at the Fed’s next meeting in May. At this point, we also agree that a hike is likely at such time.
- The Fed remains focused on services core inflation, which they understand needs a less tight U.S. labor market with a slower rate of wage growth that might be compatible with a 2% rate of inflation. We surmise that this week’s data showed some “cracks” that could lead to those achievements. We foresee the U.S. economy on a slowing trajectory. In such an environment high quality growth and tech stocks should continue to command premium valuations. However, we remain convinced that after substantial gains this year some of these holdings could be trimmed because in our view, the risk-reward no longer justifies maintaining “full” positions.
The Upshot: Our general investment approach remains the same as depicted in last week’s commentary. We maintain our preference for quality stocks with good balance sheets, relatively stable cash flows with stable margins. Volatility across sectors continues to be supportive of a diversified global portfolio for long term investors. We continue to stress that stock selectivity in the current environment is of paramount importance. We forecast continued financial markets volatility.
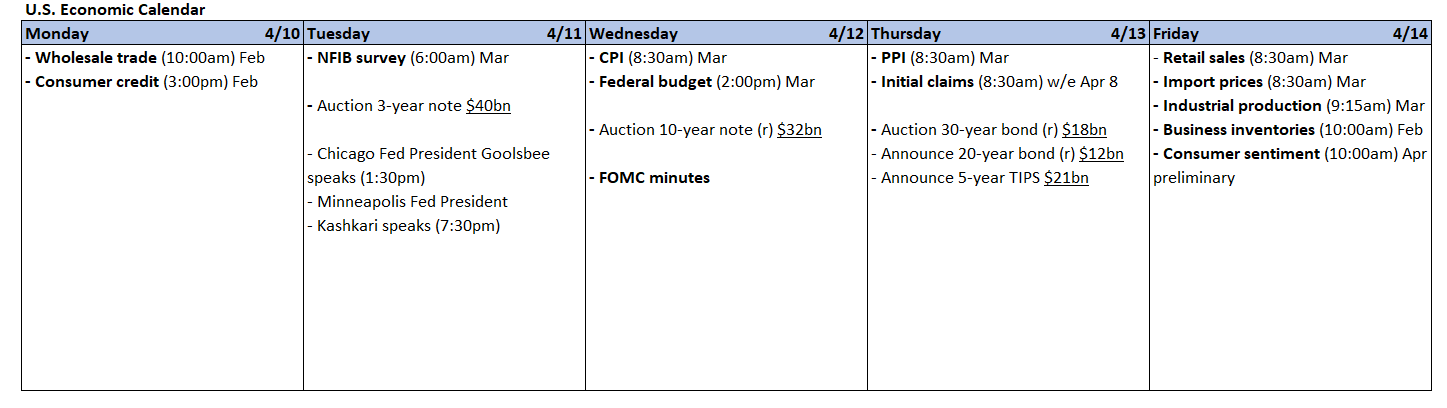
We are not assuming that the banking crisis is behind us and remain concerned that credit contraction might lead to unforeseen outcomes. This could be true especially for smaller companies that rely on funding from regional banks, as well as for certain commercial real estate holdings and developments. We assume that credit contractions might affect certain companies and industries in an uneven manner. Such credit contractions could disproportionately adversely affect smaller companies that have historically been the largest creators of jobs. We are hopeful that we get more clarity on some of these issues when banks begin reporting their Q1 earnings next week.
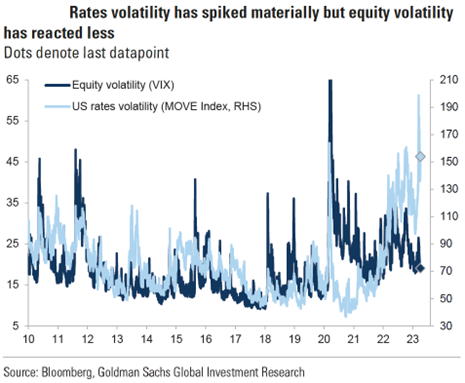
Source: Goldman Sachs, Global Markets Daily: Lower Vol is Not Lower Risk — Assessing the Equity Vol Regime (Mueller-Glissmann/Ferrario) (6-6-2023)
Cracks in the “Castle of Glass” Becoming More Noticeable
We have stated for quite some time that a principal hallmark of the period beginning with the onset of the pandemic has been the “rapidity of change.” In our March 24 weekly commentary, we noted that we did not foresee a linear and predictable pattern for an economic slowdown. Instead, a “bumpy” economic downturn could be more likely – much like the “bumpy” slowdown of inflation rates. We could see an economic slowdown “adhering to an irregular ‘step function’ in which sudden changes might occur. We have little doubt that many ‘surprises’ and uncertainties remain ahead.” The most notable recent “crack” in the financial environment occurred with the “banking crisis” that we have discussed in our previous commentaries. The cracks in the high inflation, tight labor market and relatively robust economy narrative have begun to accelerate seemingly. In this context, we were reminded of Linkin Park’s song “Castle of Glass.” The possible crumbling of this narrative might have already begun with “only a crack in this castle of glass; Hardly anything there for you to see.” It is our contention that the edifice of inflation has developed some structurally “sound” components that could stall the downward inflation trajectory at some point, but that many connected components could become unglued relatively quickly once “cracks” started to develop. We believe that this process has already begun and that it has accelerated this week. We do not see it is a coincidence that many signs of a weakening economy, a less tight labor market and diminishing inflationary pressures all appear to be showing cracks that are coalescing. Hopefully when things seem to be in better balance again in a more sustainable manner, the economy will figure out “how to be whole again.”
In last week’s commentary, we highlighted a few more cracks in the “castle of glass” too-high-inflation narrative. We showed that even as consumers’ sentiment exhibited some disappointing aspects, their expectations for year ahead inflation were diminishing. The Conference Board’s labor market differential indicated a somewhat less-optimistic assessment of the labor market. Moreover, the Fed’s preferred measure of inflation, the various Personal Consumption Expenditures (PCE) price indexes generally were lower than expected. We also thought that the increased uncertainty in regard to tightening credit conditions due to the banking crisis and possible regulatory changes could lead to more problematic earnings guidance.
Most of this Week’s Economic Data Seemed to Heighten Recession Risk Concerns
Virtually all of the key economic data revealed this week through Thursday was disappointing relative to expectations and appeared to increase the financial markets’ assessment of recession risk probabilities. The most evident reflection of this assessment was the downward trajectory of interest rates this week through Thursday. The two-to-10 -year Treasury yield curve became less inverted and could be characterized as a “bull steepening” move in the yield curve, as explained in our March 24 commentary. Through Thursday, both the two- and five-year Treasury yields dropped about 20 basis points (bps). The 10-year Treasury yield decreased more than 16 bps and the 30-year yield was lower about 10 bps. Financial markets also priced in a lower likelihood – closer to 50% probability – that the Fed would raise the federal funds rate at its next meeting in May. Although they are not entitled to vote this year, two rather outspoken Fed members saw it differently than the markets. Both the Cleveland Fed president Loretta Mester and the St. Louis Fed president James Bullard continued to see the need for further interest rate hikes to rein in inflation. The members of the Fed continue to show a remarkable cohesiveness on this view, almost irrespective of the incoming economic data. In our opinion, the financial markets and the Federal Open Market Committee (FOMC) continue to have apparently different views on how to interpret the latest economic data. The financial markets see an increased risk of a U.S. recession and a disinflationary trend continuing. Most Fed governors appear to remain unconvinced that inflation is on a sustained downward trajectory and are more sanguine about the U.S. economy. We surmise that most FOMC participants would still prefer to err on the side of “overtightening.” At the present time, it appears that most participants do not view the incoming data as sufficiently convincing of a sustained downward inflation rate trajectory. The financial markets appear to disagree. The extent of the Fed’s self-characterization of their monetary policies as being “data dependent” remains unclear to us.
Surprise Cut in Its Oil Production Announced by OPEC
On Sunday, before this week’s trading in financial markets began, the Organization of the Petroleum Exporting Countries (OPEC) announced that it would cut its oil production by about 1.1 million barrels-per-day (bbl/d) beginning in May. Saudi Arabia pledged to cut its own production by 500k bbl/d as part of this “voluntary’ agreement. Saudi’s ministry of energy office announced that this was a “precautionary measure aimed at supporting the stability of the oil market.” The head of global commodities at RBC capital markets Helima Croft thought that the actual cuts in OPEC production would be closer to 700,000 bbl/d, given that some producers were already producing below their allotted quotas. This announcement was very unexpected. It came one day before a scheduled OPEC meeting and it was made after assurances by OPEC that there were no plans to further cut production. Some possible explanations for this surprise included that the Saudi’s were disappointed that the U.S. did not follow through on its planned purchases to replenish the U.S. Strategic Petroleum Reserves (SPR) when crude prices dipped below $70/bbl. Another “theory” was that the Saudi’s felt that the financial markets did not properly reflect the oil market “fundamentals,” and that the Saudis wanted to “punish” the “shorts” in crude oil trading markets. Crude oil prices rose initially about 8% on the Sunday announcement and both West Texas Intermediate (WTI) crude and Brent crude oil spent most of Monday trading almost 6% higher than the Friday’s closing prices. Also on Monday, interest rates initially traded higher on the assumption that higher oil prices would be inflationary, which could lead the Fed and other major central banks (CBs) to hike rates more than expected. Almost immediately after the disappointing ISM manufacturing PMI was announced on Monday morning, inflation concerns were transformed quickly to concerns about recession risks. Interest rates then promptly traded lower. We highlighted in last week’s commentary that we thought early Friday, March 24 that energy stocks looked like they could be ‘bottoming.’” Many energy stocks have rebounded substantially since then. We do not see much further upside in the short term from the peak energy prices of this week, as recession concerns increase.
Weaker March ISM Manufacturing PMI
The Institute for Supply Management (ISM) March manufacturing Purchasing Managers’ Index (PMI) was the first major disappointment of this week on Monday, and it set the tone for lower interest rates and increasing risk of U.S. recession concerns. This index declined from 47.7 in February to 46.3 in March and versus an expected 47.5 level. This was the fourth consecutive month of decline for this survey – under the 50 level – and it was the lowest PMI since May 2020. New orders fell from February’s 47.0 reading to 44.3, and the employment component fell 2.2 points to 46.9. Prices paid fell 2.1 points to 49.2 as the supplier delivery index fell from 45.2 to 44.8, indicating faster delivery times, as well as the fastest delivery times since March 2009. Both export orders and imports contracted further into negative territory, indicating additional weakening in demand. This month was the first time since 2000 that all subcomponents of ISM manufacturing PMI were below 50, indicating that all of them were contracting. We interpreted the results of this survey as confirmation that higher interest rates and growing concerns of a U.S. recession were taking their toll on U.S. business.
Weaker March ISM Services PMI
The ISM services PMI fell from 55.1 in February to 51.2 and was well below expectations of 54.5. This level marked the slowest services growth in three months. New orders dropped precipitously from 62.6 in February to 55.2. Prices paid for inputs fell from 65.6 to 59.5, which was the lowest price growth since September 2020. Some economists view prices paid as a good predictor of PCE inflation. Supplier deliveries fell from 47.6 in February to 45.8, and reflected the fastest delivery performance since April 2009. Employment growth fell from 54 to 51.3, showing a moderating growth rate of employment and a loosening of labor market tightness. We view the services sector as being supported somewhat by consumers switching spending from goods to services. The new export index saw a very dramatic 18-percentage-point drop from 61.7 to 43.7. Imports also contracted after six consecutive months of growth, registering a 9-percentage-point drop from 52.6 to 43.6. We view many of these precipitous and sudden drops as confirmation of our “step-function,” and non-linear downward trajectory of economic data in the U.S.
February JOLTS Data Showed an Unexpected and Dramatic Drop in Job Openings
The Job Openings and Labor Turnover Survey (JOLTS) showed that job openings or “vacancies” dropped 632,000 to 9.931 million on the last business day of February versus an expected reading of 10.4 vacancies. This was the lowest number of job openings since May 2021. Until 2021, job vacancies had never surpassed 10 million. There were 1.7 jobs offered for every unemployed worker compared to January’s ratio of 1.9. While the number of hires changed little from January levels, it was the lowest since mid-2021, but lowest barely by a very small margin. In February, the number of total separations changed little at 5.8 million. This included an increase of 146,000 in the number of “quits.” More quits are taken generally as a sign of a tight labor market, since quits are generally at the initiation of an employee who is confident on finding another job. By examining in which sectors quits increased the most, perhaps we can gauge where the labor market is most “tight.” But given the large decrease in job openings, we interpret this survey as an indication that the job market is generally cooling. Quits increased in professional and business services (+115,000), accommodation and food services (+93,000), wholesale trade (+30,000) and educational services (+18,000). Much to our surprise, the largest decreases in job openings (-278,000) were in professional and business services – the same sector that saw the highest number of quits. Evidently, a much closer examination is warranted before many conclusions can be drawn from the overall data. But given the large decrease in job openings, we interpret this survey as an indication generally of a cooling job market.
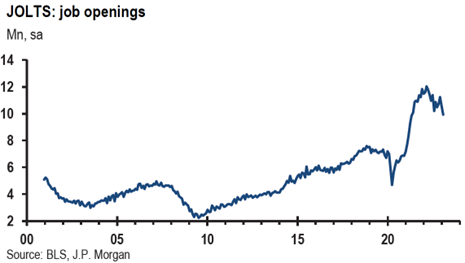
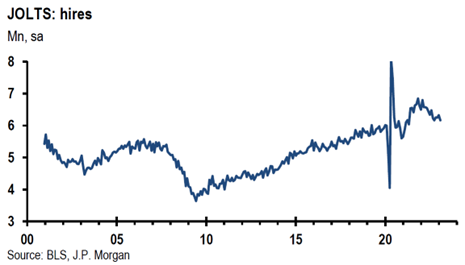
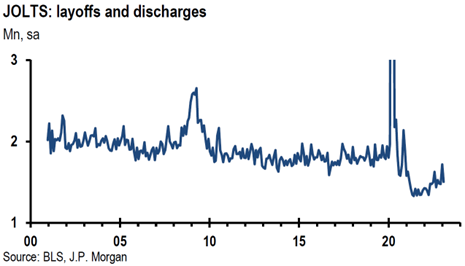
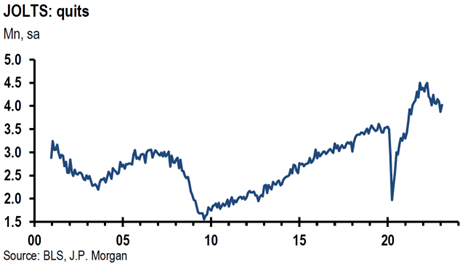
Source: JP Morgan, US: JOLTS data show drop in openings; mixed details overall (4-4-2023)
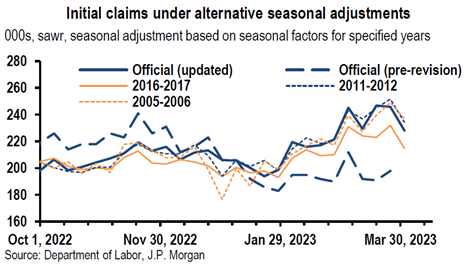
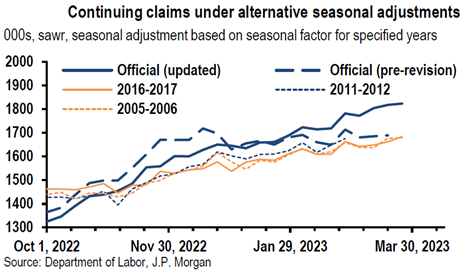
Department of Labor Revises Methodology to Seasonally Adjust Jobless Claims – Now Higher
Starting with the release on Thursday, April 6, the Department of Labor (DOL) changed the methodology used to seasonally adjust both the national initial jobless claims (for unemployment insurance) and the continuing jobless claims data. Prior to this change, the seasonal adjustments reflected a generally lower level of jobless claims due to the wild swings of claims during the height of the pandemic. The DOL identified this period as running from March 2020 to June 2021. We have been leery of relying on seasonally adjusted numbers in many other series of data as well. In particular, we were suspicious of the much higher than expected increase in January’s nonfarm payroll data as well as higher than expected inflation data. Trying to be data dependent was made more difficult by seasonal distortions. Under the new methodology for the week ending April 1, initial jobless claims were 228,000 – a decrease of 18,000 from the previous week’s upwardly revised level of 246,000, which was revised higher by 48,000. Continuing jobless claims for the week ending March 25 were 1,823,000, an increase of 6,000 from the upwardly revised by 128,000 level from the prior week. The revised claims data seem to suggest a softening in the U.S. labor market over the past few months. The four-week moving average of initial claims moved up from about 200,000 in late January to about 238,000 including the revised data for the week ending April 1.
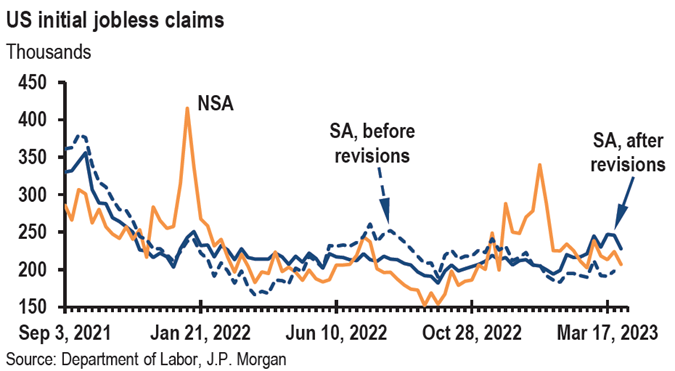
Source: JP Morgan, Daily Economic Briefing (4-6-2023)
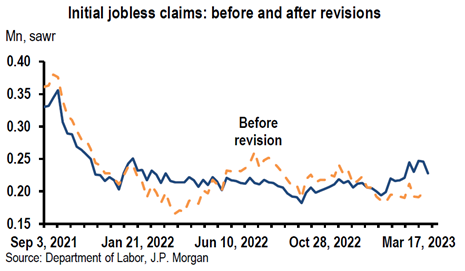

Source: JP Morgan, Focus: Upward trends for claims after update to seasonals (4-6-2023)
Challenger March Report Confirms Softening U.S. Labor Market
Challenger Gray & Christmas, Inc. (Challenger), a Chicago based outplacement services firm, released its latest report on U.S. job cuts on Thursday. According to this report, U.S. based employers announced close to 90,000 cuts in March, about 15% higher than February’s total and 319% higher year-over-year (y/y) for March. March was the third consecutive month this year when job cuts were higher when compared to the same month from the prior year. There were 270,416 job cuts for Q1 in total, a 396% increase when compared to Q1 2022. This was the highest Q1 total of job cuts since Q1 2020. Andrew Challenger, senior vice president of Challenger summarized the findings: “We know companies are approaching 2023 with caution, though the economy is still creating jobs. With rate hikes continuing and companies reigning in costs, the large-scale layoffs we are seeing will likely continue.” He then added that “the Technology sector is leading all industries. And this talent is in demand across industries. In fact, 38% of all cuts are in the Tech sector.” Financial companies announced the second most number of job cuts for Q1. U.S. companies announced plans to hire 9,044 workers in March, down from February’s 28,830 total, which was the lowest March total since 2015. There was a total of 70,638 plans to hire in Q1, the lowest Q1 total since 2016.
Atlanta Fed GDPNow Estimate for Q1 Continued to be Revised Lower
The Atlanta Fed emphasizes that its GDPNow real GDP estimates are not official forecasts of the Atlanta Fed. The GDPNow forecast “is best viewed as a running estimate of real GDP growth based on available economic data for the current measured quarter … the estimate is based solely on the mathematical results of the model.” For Q1 2023 the GDPNow forecast for real GDP growth has fluctuated between as low as 0.7% (annualized rate of growth) and as high as 3.5%, last seen on March 23. A steady deterioration of this forecast began last week, and the downtrend accelerated this week. Last Friday’s reading of 2.5% dropped to 1.7% on Monday and fell to 1.5% on Wednesday. The disappointing data released this week was having a noticeable impact on the GDPNow forecasts. The cracks in the castle of glass of inflation and economic growth seemed to be proliferating. “Rapidity of change” was becoming increasingly evident.
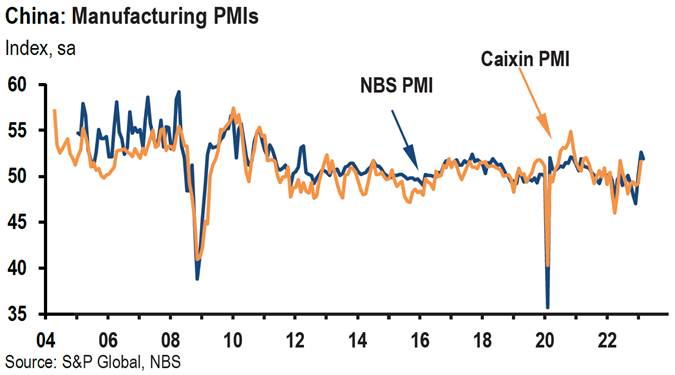
China March Manufacturing PMI Weaker
We, along with the rest of the world, have long been anticipating China’s “reopening” after its severe lockdowns to fight the coronavirus. China’s manufacturing data have been disappointing somewhat, which in turn has caused sluggish pricing in many commodities this year. The performances of some emerging market countries (EMs) have also been adversely affected. The official March National Bureau of Statistics of China (NBS) manufacturing PMI fell 0.7% month-over-month (m/m) and was in line with expectations to 51.9 from an eleven year high in February. There appeared to be easing of the underlying components of output, new orders and export orders. The private Caixin manufacturing March PMI was released on Monday and dropped more than expected to 50.0 from 51.6 in February and lower than the expected 51.4 level. Caixin PMIs are tilted to smaller and more export oriented private enterprises in contrast to the larger and state-controlled enterprises covered by NBS. The contrast between the NBS and Caixin manufacturing PMIs seems to indicate that domestic demand has been the driver of manufacturing recovery while external demand has appeared more uncertain. Both manufacturing surveys suggest a slowing growth rate of manufacturing after a strong February rebound.
Source: JP Morgan, China (3-31-2023)
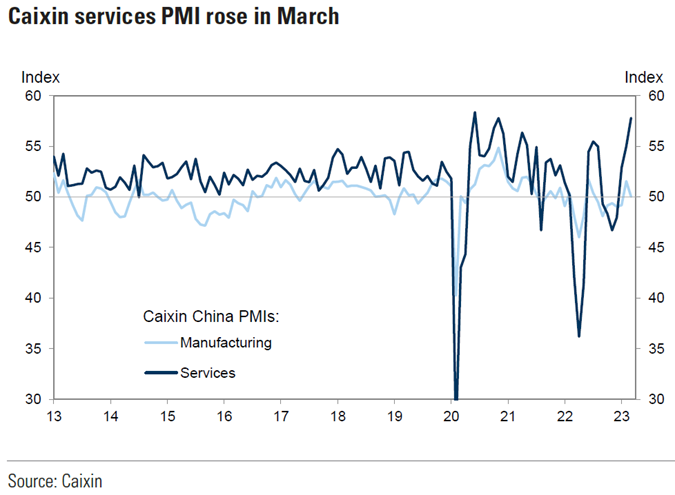
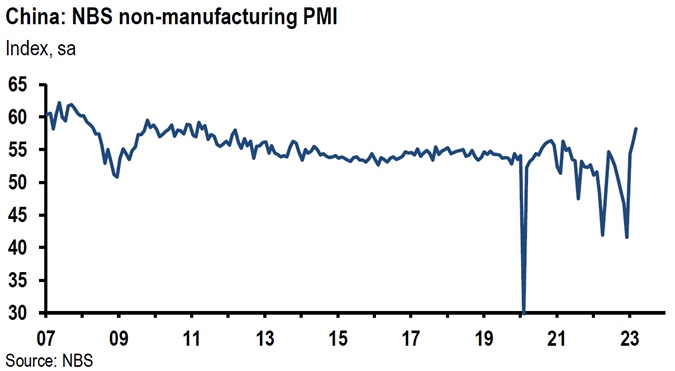
China March Services PMI Stronger
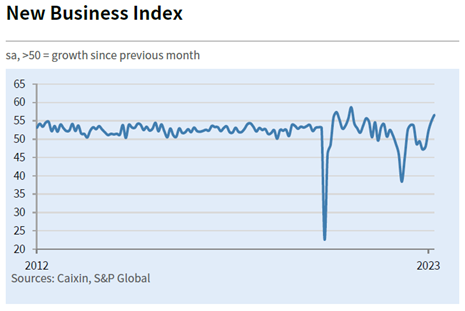
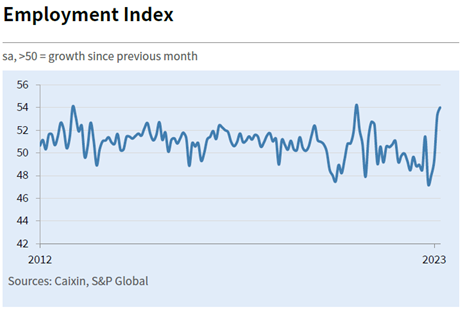
The China reopening recovery appears to be increasingly led by strength in services related sectors. The official NBS services PMI rose 1.9% to a twelve year high of 58.2. Retail sales and travel related services were especially strong. Front-loading policy support helped construction activity jump 5.4% to 65.6. The Caixin general services PMI increased to 57.8 from February’s reading of 55.0, which was also the expected level for March. Other than the exit from the early pandemic lockdowns, this was the second highest reading since 2010. The improvement in customer demand and business operations was notable. Surveyed companies noted the reduced disruptions to business operations following the removal of zero-COVID-19 policies. The new export orders sub-index rose to a new record of 56.9 from February’s reading of 54.9. The employment sub-index rose to 54.0 from 53.2, which was its highest level since November 2020. Input cost inflation accelerated to a seventh month high due to higher wage costs and higher prices for materials. Output cost inflation rose only marginally as many firms found it more difficult to pass on their higher costs. We view this services report as a strong support for global economic growth.
Source: Goldman Sachs, China: Caixin services PMI rose to near a decade high in March (4-6-2023)
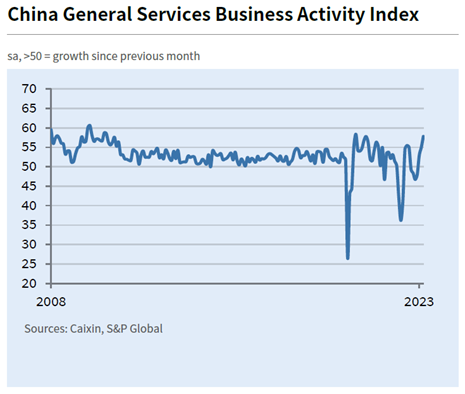
Source: Caixin & S&P Global, Caixin China General Services PMI (4-5-2023)
Source: JP Morgan, China (3-31-2023)
March U.S. Job Growth Continues to Show Resilience and was Close to Expectations Generally
U.S. nonfarm payrolls rose by 236,000, close to expectations. This total was the lowest monthly gain since December 2020 and was below the average monthly job gains of 334,000 over the prior six months. February’s total was revised higher and January lower for a net loss of 17,000 jobs. The unemployment rate fell to 3.5% from 3.6% in February and the labor force participation rate continued to edge higher as it reached 62.6%, from 62.5% in February and 62.4% in January. An increase in the labor force participation rate means that more people are entering the workforce, suggesting a loosening of the still tight U.S. labor market. Average hourly earnings rose 0.3% m/m, higher from the 0.2% m/m increase in February. But the average hourly earnings on a y/y basis dropped to 4.2% from a 4.6% y/y increase in February. The average workweek for all employees on private nonfarm payrolls edged down by 0.1 hour to 34.4 hours in March. We thought it was noteworthy that total private nonfarm payrolls increased by only 189,000 as government jobs added 47,000 jobs. Private service providing jobs grew by 196,000 as the goods producing sector lost 7,000 jobs. The leisure and hospitality sector was once again the leading job gainer with 72,000 new jobs added, but was below the average 95,000 of the prior six months. Even after its recent robust job gains, the leisure and hospitality sector remained 368,000 jobs (or 2.2%) short of its pre-pandemic February 2020 levels. The early reaction to the jobs data was higher equity futures prices, higher Treasury yields and an increase in USD. According to CNBC, the financial markets priced in a higher probability that the Fed would raise the federal funds rate at its next meeting in May – raising the probability from about 55% to 70%. Financial markets were rather illiquid as U.S. equity markets were closed in observance of Good Friday, and the bond market was scheduled for an early close.
Bottom Line
For the time being, we are maintaining our basic investment approach as expressed in last week’s commentary. We continue to prefer high quality stocks that offer good balance sheets, as well as relatively stable cash flows and profit margins. We prefer a diversified global portfolio for long term investors. We continue to stress that stock selectivity in this current environment is of paramount importance. We forecast continued financial markets volatility.
We are not assuming that the banking crisis is behind us, and remain concerned that credit contraction might lead to unforeseen outcomes. We are hopeful that we get clarity on some of these issues when banks begin reporting their Q1 earnings next week.
Definitions:
Real GDP – Real gross domestic product (GDP) is an inflation-adjusted measure that reflects the value of all goods and services produced by an economy in a given year. Real GDP is expressed in base-year prices. It is often referred to as constant-price GDP, inflation-corrected GDP, or constant dollar GDP. Put simply, real GDP measures the total economic output of a country and is adjusted for changes in price.
Basis Points (bps) – A basis point is one hundredth of one percent, used chiefly in expressing differences of interest rates.
ISM Manufacturing PMI – The ISM manufacturing index, also known as the purchasing managers’ index (PMI), is a monthly indicator of U.S. economic activity based on a survey of purchasing managers at more than 300 manufacturing firms. It is considered to be a key indicator of the state of the U.S. economy.
ISM Services PMI – The Institute of Supply Management (ISM) services PMI (formerly known as Non-Manufacturing Index) is an economic index based on surveys of more than 400 non-manufacturing (or services) firms’ purchasing and supply executives.
China Reopening – A “reopening” in China means an easing of their zero-covid policy which includes a relaxation of travel rules and domestic travel.
Inverted Yield Curve – An inverted yield curve describes the unusual drop of yields on longer-term debt below yields on short-term debt of the same credit quality. Sometimes referred to as a negative yield curve, the inverted curve has proven in the past to be a relatively reliable lead indicator of a recession.
Steeper Yield Curve – If the yield curve steepens, this means that the spread between long- and short-term interest rates widens. It typically indicates stronger economic activity and rising inflation expectations, and thus, higher interest rates. When the yield curve is steep, banks are able to borrow money at lower interest rates and lend at higher interest rates.
Bull Steepener Yield Curve – A bull steepener is a change in the yield curve caused by short-term interest rates falling faster than long-term rates, resulting in a higher spread between the two rates.
Job Openings and Labor Turnover Survey (JOLTS) – The job openings and labor turnover survey are a monthly report by the Bureau of Labor Statistics (BLS) of the U.S. Department of Labor counting job vacancies and separations, including the number of workers voluntarily quitting employment.
Atlanta Fed GDPNow – The GDPNow is a running estimate of real gross domestic product (GDP) growth during the current quarter, as opposed to the official GDP numbers which are released by the U.S. Bureau of Economic Analysis (BEA) with a significant delay that can impact policy decisions.
S&P 500 – The S&P 500 is a total return index that reflects both changes in the prices of stocks in the S&P 500 Index as well as the reinvestment of the dividend income from its underlying stocks.
Organization of the Petroleum Exporting Countries (OPEC) – The Organization of the Petroleum Exporting Countries is a cartel consisting of 13 of the world’s major oil-exporting nations. OPEC aims to regulate the supply of oil in order to set the price on the world market.
IMPORTANT DISCLOSURES
The views and opinions included in these materials belong to their author and do not necessarily reflect the views and opinions of NewEdge Capital Group, LLC.
This information is general in nature and has been prepared solely for informational and educational purposes and does not constitute an offer or a recommendation to buy or sell any particular security or to adopt any specific investment strategy.
NewEdge and its affiliates do not render advice on legal, tax and/or tax accounting matters. You should consult your personal tax and/or legal advisor to learn about any potential tax or other implications that may result from acting on a particular recommendation.
The trademarks and service marks contained herein are the property of their respective owners. Unless otherwise specifically indicated, all information with respect to any third party not affiliated with NewEdge has been provided by, and is the sole responsibility of, such third party and has not been independently verified by NewEdge, its affiliates or any other independent third party. No representation is given with respect to its accuracy or completeness, and such information and opinions may change without notice.
Investing involves risk, including possible loss of principal. Past performance is no guarantee of future results.
Any forward-looking statements or forecasts are based on assumptions and actual results are expected to vary from any such statements or forecasts. No assurance can be given that investment objectives or target returns will be achieved. Future returns may be higher or lower than the estimates presented herein.
An investment cannot be made directly in an index. Indices are unmanaged and have no fees or expenses. You can obtain information about many indices online at a variety of sources including: https://www.sec.gov/fast-answers/answersindiceshtm.html or http://www.nasdaq.com/reference/index-descriptions.aspx.
All data is subject to change without notice.
© 2024 NewEdge Capital Group, LLC


