

Weekly Summary: August 1 – August 5, 2022
Key Observations:
- A critical component of our “soft” pivot narrative for the Federal Reserve (Fed) expounded in last week’s narrative is our assumption that the U.S. economy continues to slow. The economic data we reviewed this week confirms our view.
- The Fed’s tightening monetary policy is already having an effect through financial conditions tightening, such as higher mortgage rates dampening housing demand and U.S. banks tightening certain lending standards – especially with respect to certain business loans.
- With the exception of China, most major Purchasing Managers’ Indexes (PMIs) suggest weakening economic trends, and softening of inflationary and wage pressures. The principal outlier to this narrative was the ISM services July PMI for the U.S. The composition of this particular PMI might account for its very positive depiction of the U.S. service economy. We will monitor closely the future trend of this survey. This could also be an example of why we need to see more than one month’s data before we change our opinion. We will continue to analyze data with a “cold heart.”
- As expected, the Bank of England raised its key policy interest rate by 50 basis points (bps) this week. It increased its assumption of peak inflation in October to 13.3% year-over-year (y/y). It reiterated its commitment to a 2% target for UK inflation even as it projected that the UK will enter a recession in Q4 2022 that will persist through a total of five quarters. This is the first major central bank we are aware of that explicitly is raising rates aggressively into a projected recession.
The Upshot: Our general investment approach remains the same as depicted in last week’s commentary. Much of corporate managements’ remarks on Q2 earnings conference calls mirrored our assessments of a slowing economy as suggested by most PMI surveys. Many managements noted easing labor shortages and tentative signs of peaking wage growth. According to Goldman Sachs on August 1, “wage growth needs to slow from the current 5.5% pace to about 3.5% to be compatible with FOMC’s 2% target for inflation.” Goldman forecasts wage growth slowing to 4.6% by year end and under 4% by the end of 2023. The Conference Board’s latest CEO confidence survey already indicates that CEO confidence has fallen to levels compatible with a recession. It would not be surprising to see a slowdown in business investment.
A delineation of our recommending certain high quality tech stocks and growth stocks on June 16 might be helpful as an example of why having a “cold heart” in making investment decisions should always be the preferred investment posture, in our opinion. The key was that we maintained an open mind as to which stocks and/or sectors to recommend for long-term investors at the most opportune time. The 10-year Treasury yield had just surged to a peak just under 3.5% on June 14. This was an important piece of our analysis. We supposed that long duration stocks such as high tech and other growth stocks could have over-discounted the negative effects of higher real interest rates in their valuations. We also foresaw a slowing of U.S. economic growth that could help rein in U.S. inflation. We postulated that in a slowing economy, that selected growth stocks should trade at a “premium” valuation since growth in a slowing economy would be more difficult to ascertain. We also surmised that most of the potential “bad” news was reflected in selective tech and growth stocks. Although we did not anticipate that the Fed will cut interest rates in the foreseeable future, we did project that the Fed could slow the rate of further interest rate hikes.
In last week’s commentary, we stated that “we do not anticipate any more hikes as large as 75 bps for the duration of this cycle.” Friday’s BLS release of the U.S. July nonfarm payroll report that showed a gain of 528,000 jobs, which was more than twice expectations of roughly a gain of 250,000 jobs, might make this assumption more questionable. The risk is now more skewed to the possibility of another 75bps hike in September. We chose to not change our assumption based on one month’s data. We will wait for more incoming data. In the meantime, we are maintaining our expectation of a 50 bps increase at the Fed’s next meeting in September. Employment gains were very broad based in Friday’s employment report, as almost 69% of industries added jobs. Average hourly earnings increased at a better than expected 0.5% m/m rate and rose by 5.2% y/y. We characterize virtually all of the details of this report as very strong. However, almost all of the other data that we have analyzed continues to point to a slowing economy. Most of the job gains were attributed to various service sectors. Many service oriented employers have found it difficult to attract and retain workers. Perhaps some employers have chosen to provide themselves with an “employee cushion.” But again, we are reluctant to change our view that the U.S. economy is in the process of slowing based on just one month’s data. We simply need to see more incoming data. If the data justifies a change in our opinion, we will modify our views and assumptions at the “appropriate” time.
On July 29, Goldman Sachs observed “return dispersion” recently dropped in the S&P 500 Index as stock correlations within sectors increased. This development would make it more difficult for stock picking to outperform. “Stocks with high dispersion scores are more likely to have heightened responses to idiosyncratic news and present the best alpha generation opportunities.” Goldman Sachs produced a screen of S&P 500 stocks with the highest dispersion scores. Many of the stocks enumerated on this list are growth stocks in the Consumer Discretionary, Tech and Communication sectors. These stocks typically have higher rates of sales and earnings growth than the average S&P 500 stocks. These stocks typically trade at premium valuations. Our June 16 recommendation can be enhanced by selective stock picking. In contrast, Energy and Utility stocks are currently the most macro-driven sectors. We also still favor selected energy stocks due to their “cheap” valuation relative to energy prices and our long-term favorable disposition to their long-term positive fundamentals as we view them. We also view the energy sector as a hedge against tech and other growth stocks. To the extent energy rebounds, headline inflation can be expected to rise which might necessitate more Fed rate hikes. In such a scenario, energy securities should benefit while tech and growth stocks, most likely, would come under pressure.
The financial market reaction to this much better than expected payroll number was somewhat predictable. Interest rates rose with the 2s/10s Treasury yield curve becoming more inverted. The USD rose, as exemplified by DXY. The Nasdaq underperformed other major U.S. stock indexes. Through midday on Friday, energy was the best S&P performing sector while the technology sector was the third worst performing sector. At least for part of one day, our notion that energy securities could act as a hedge against high quality tech and growth stocks appeared to be “working.” We were somewhat encouraged by the resiliency of selected high-quality tech and growth-type stocks given the upward move in interest rates.
We continue to foresee continued financial market volatility and we maintain our conviction that equities should only be purchased on downturns.
Fed’s “Soft” Pivot, Fed’s Senior Loan Officer Survey
A critical component of our “soft” pivot notion by the Fed as depicted in last week’s commentary, is that most of the recent incoming data we have examined continues to show weakening U.S. and global economies. We suppose that these weakening trends should continue in the U.S., and globally. It appears that the Fed’s tightening monetary policies are beginning to take effect, especially through a more general tightening of financial conditions. Examples of such conditions include higher mortgage rates and higher interest rates in many other types of loans as well. The Fed’s July national Senior Loan Officer Opinion Survey on Bank Lending Practices depicts how banks help to implement the Fed’s tighter monetary policies. This survey “addressed changes in the standards and terms on, and demand for, bank loans to businesses and households over the past there months, which generally correspond to the second quarter of 2022.” In general, the survey reported tighter standards for loans to business. Additionally, the survey reported also stronger demand for commercial and industrial loans (C&I) loans and weaker demand for most commercial real estate categories (CRE) loans – except for those secured by multifamily residential properties. Unchanged standards for most categories of residential real estate (RRE) loans to households showed weaker demand for such loans. In contrast, home equity lines of credit showed tighter standards but stronger demand. Standards for all other consumer loan categories remained unchanged – including credit card loans, auto loans, and other consumer loans. Demand weakened for auto loans and strengthened for credit card and other consumer loans. Tighter lending standards can be expected to slow economic growth.
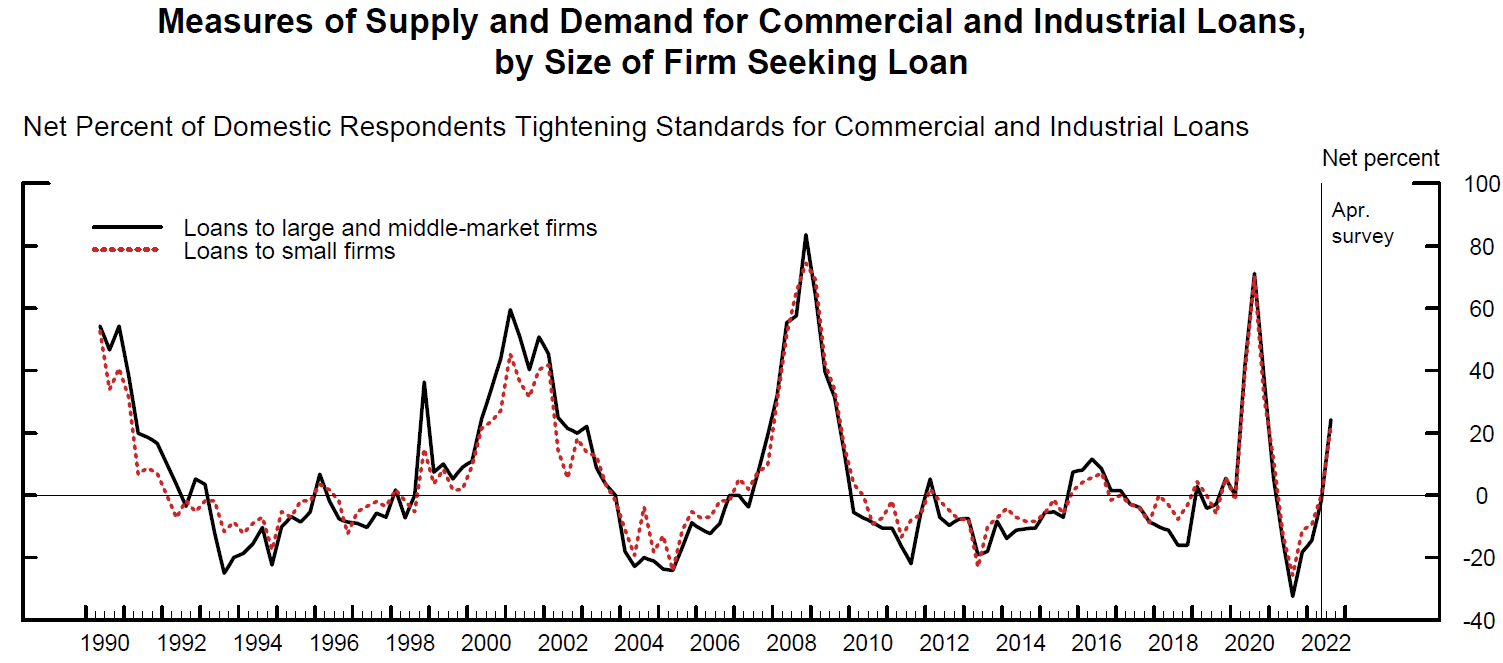
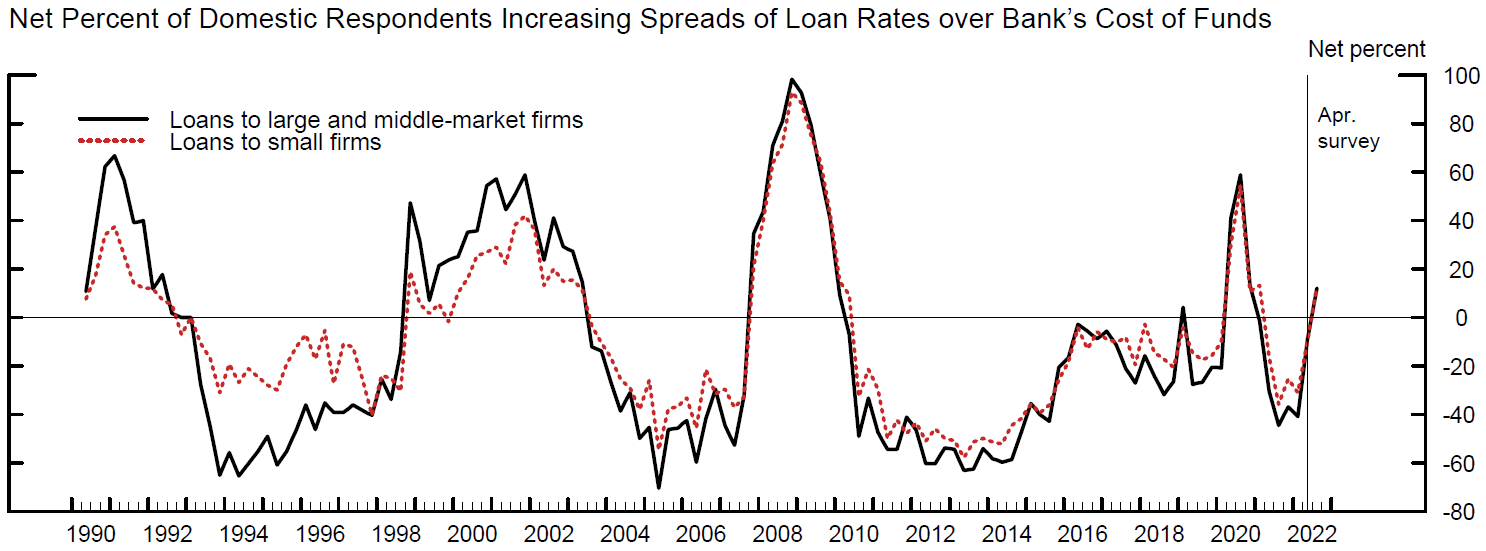
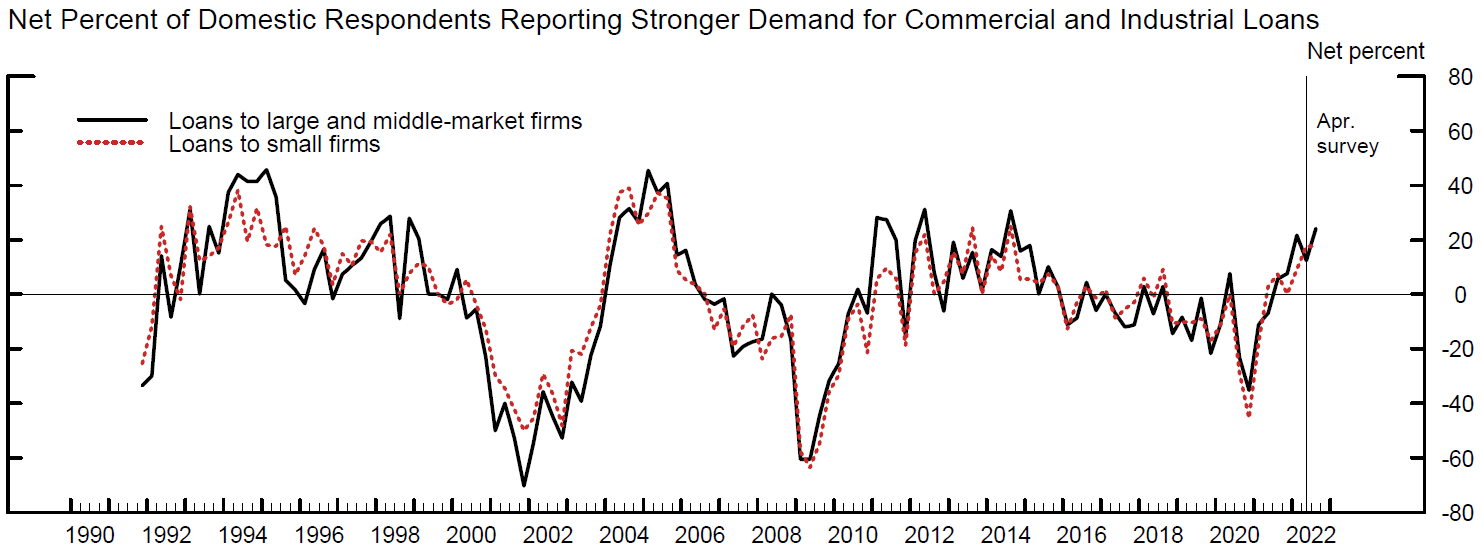
Source: Board of Governors of the Federal Reserve System, July 2022 Senior Loan Officer Opinion Survey on Bank Lending Practices, (8-1-2022)
Analyzing Data with a “Cold Heart”
Incoming data comes in many forms. Some are more quantitative and some more qualitative, such as a survey of senior bank loan officers. We have often stressed that we are very data dependent, much like the Fed’s current self-characterization. Additionally, we are very cognizant that one month’s data does not make a trend. That’s why we find the Fed’s senior loan officer survey that covers a three-month period particularly noteworthy. We are vigilant to keep an open mind to consider all relevant data with as few preconceptions or biases as possible. We try to look at any data with a “Cold Heart” as depicted in the song by Dua Lipa and Elton John. For those investors not yet “hardened” by financial markets “when things go wrong,” they might be musing “I think it’s gonna be a long, long time; ‘Til touchdown brings me ‘round again” so as to have conviction in the benefits of investing for the long-term. It is our long-held belief that to be an effective investor, one must examine all the factors that could lead to a profitable investment with a “cold heart”. In our opinion, it is critical to keep an open mind, and to have as few preconceptions as possible. Let the incoming data show the way. Be ready to change opinions when the facts change. Be mindful of how stocks and sectors react to various news items. Always ask: What assumptions are reflected in prices of financial markets? Do you agree with these assumptions? Be ready to act quickly when most of the “good” or “bad” news is reflected in prices. Try to anticipate which factors will be determinative for a profitable investment idea. We have always maintained that “price does matter.” A purchase at the “right” price can make it much easier to hold an investment for the long term. Risk and reward should always be considered as investments fluctuate in price. Each investor should assess their own tolerance for risk and adjust investment posture accordingly.
Data Continues to Confirm Slowing Economic Growth
We will highlight now the data released this week that depicts generally weakening U.S. and global economic growth. The data also has shown a general lessening of inflationary pressures and a weakening but still tight labor market. Interest rates were well contained this week through Thursday as the Treasury yield curve inverted further.
S&P Global Eurozone Manufacturing PMI
The S&P Global Eurozone manufacturing PMI declined into a contractionary territory in July as recession risks intensified. The headline PMI number declined from 52.1 in June to a 25-month low of 49.8 for July. Manufacturing output declined even more and fell from June’s level of 49.3 to a 26-month low of 46.3 last month. Other than the figures shown during the time of pandemic restrictions, new orders declined at the quickest pace since Europe’s (EU) 2012 sovereign debt crisis. Prices paid and received rates of increase were the slowest in over a year as inflationary pressures eased somewhat. The year ahead outlook for manufacturing output dipped to contractionary levels below 50 for the first time since May 2020.
S&P Global U.S. Manufacturing PMI
The S&P Global U.S. manufacturing PMI moved down from June’s 52.7 level to 52.2 in July, which is the lowest level in two years. Both new orders and output fell in July. It was output’s first drop since June 2020 and new orders fell at the fastest pace in over two years. In particular, export orders fell at the fastest pace since May 2020. Prices paid and received also softened in July to the slowest rates of increase for over a year. Payroll growth slowed to its lowest pace in six months, even as some firms added employees to fill long-held vacancies. Much like EU’s manufacturing PMI’s, the one-year outlook remained at the lowest level since October 2020. Continuing inflation and supply chain concerns, as well as a more “gloomy” global economic view, played a role in these diminished expectations.
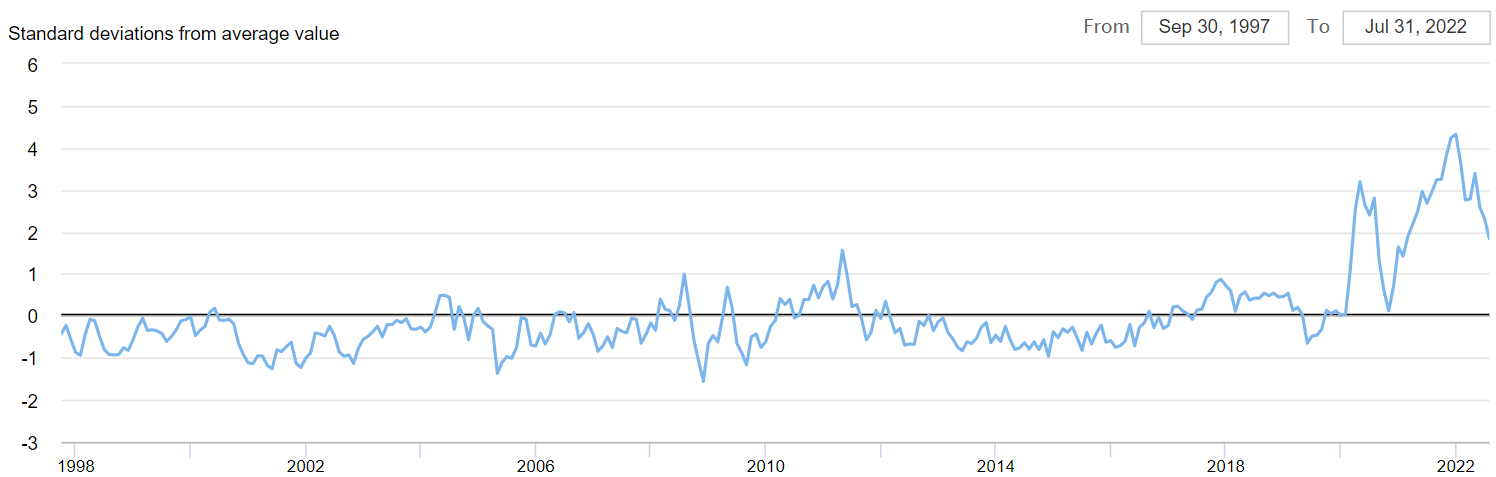
Source: Federal Reserve Bank of New York, Global Supply Chain Pressure Index (8-5-2022)
ISM U.S. Manufacturing PMI
The U.S. ISM manufacturing PMI survey showed results very similar to the S&P global PMI figures. The ISM headline came in at its lowest level since June 2020 of 52.8 for July, versus 53.0 in June. The new orders sub-index was 48.0 versus 49.2% for June. But the most “eye-catching” figure in this survey was the very steep decrease of 18.5% in the prices paid index down to 60 – the lowest level since August 2020. This sharp drop in prices paid mainly reflected a drop in energy and metals prices. Although the employment index remained in contractionary territory for the third straight month, it rose 2.6% in July to 49.9. Panelists also indicated an increase in their hiring ability in July. Supply chain constraints lessened in July as well. Excessive inventory levels became more of a concern.
U.S. Construction Spending
Against expectations of a very slight increase in U.S. construction spending for June, private nominal construction spending decreased 1.3% month-over-month (m/m) for the month. Residential construction spending declined the most as it fell 1.6%. Real construction spending decreased 2.5% as construction cost inflation rose 1.4% in June.
S&P Global EU Services PMI
The S&P Global EU services PMI for July came in at a six-month low of 51.2 from June’s reading of 53.0. Although services continued to expand in July, its rate of growth weakened to its slowest increase in output since January. Evidently, the post-pandemic reopening bounce began to fade at the beginning of the third quarter. Final EU composite output index came in at a 17-month low of 49.9, versus 52.0 in June. Services companies showed a slower uptick in outstanding business volumes. Incoming new business for service firms fell for the first time since April 2021. Higher prices were cited as the cause of demand “dampening.” Export orders also declined at the fastest pace since March 2021. Service company employment continued to increase but at the slowest pace in five months. Rates of inflation eased for both prices paid and received. Perhaps the most troublesome aspect of the EU series PMI was that business confidence slumped to a 21-month low “amid concerns regarding the underlying strength of the euro area and global economy.” Germany’s services PMI dipped from 52.4 in June into the negative territory of 49.7 in July. Italy’s slump was even worse as its services PMI Business Activity Index slipped from June’s level of 51.6 to 48.4 in July.
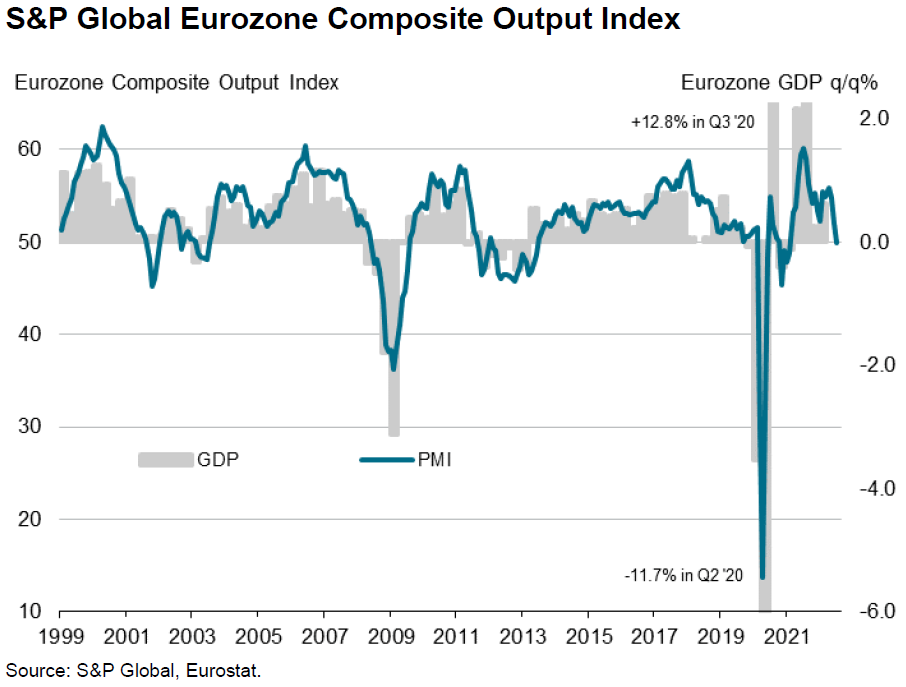
Source: S&P Global, S&P Global Eurozone Composite PMI (8-3-2022)
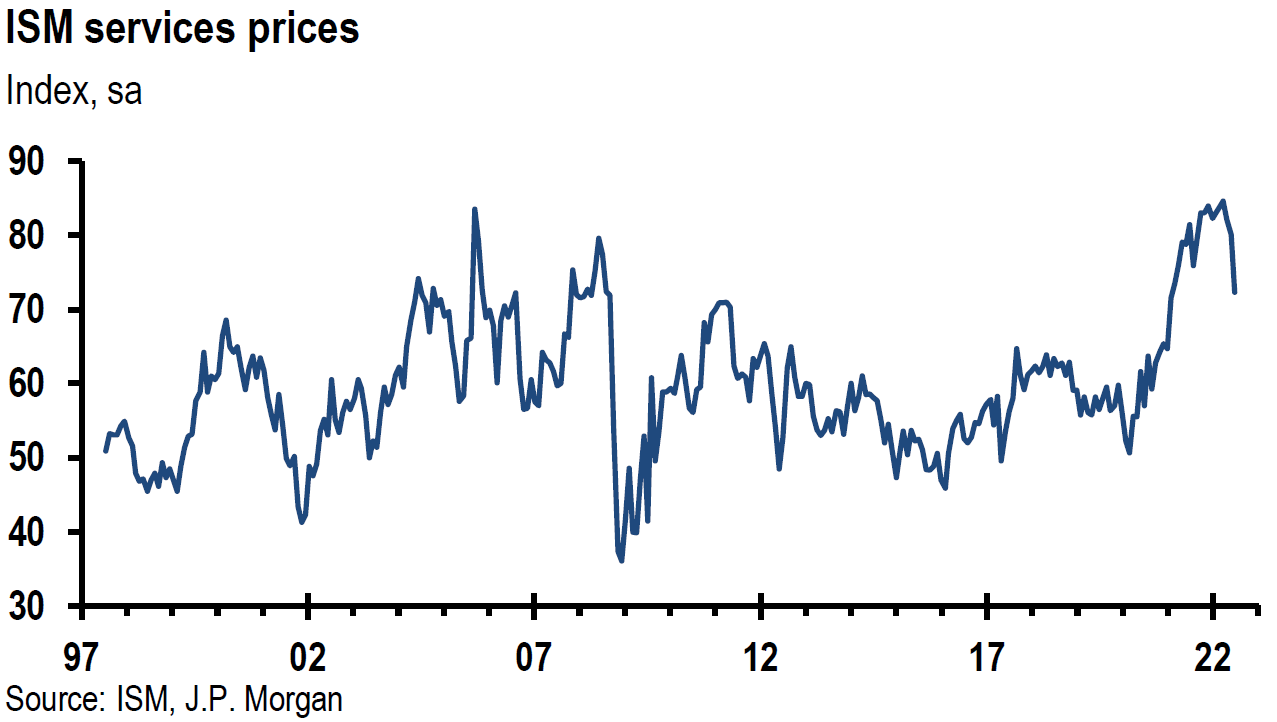
Comparing S&P Global and ISM U.S. Services PMIs
Unlike the close correlation of the S&P Global and ISM manufacturing PMIs that showed a rather close correlation, the services PMIs for these two surveys depicted a markedly different view of the U.S. July service sector. The S&P global survey showed a service sector in contraction territory of 47.3 in July, down from 52.7 in June. This signaled the sharpest fall in output since May 2020 and the decrease in business activity was the first since June 2020. Input costs increased at the slowest pace in five months and prices charged increased at the slowest pace in 16 months. Although overall new orders returned to growth, the pace was much slower than at the beginning of this year. Export orders contracted for the second consecutive month as they fell at the second fastest rate since December 2020. Future output expectations weakened as confidence dropped to a 22-month low. In contrast, the ISM services PMI came in at an above-expectation level of 56.7, versus 55.3 in June. Business activity increased 3.8 points to 59.9, new orders advanced 4.3 points to 59.9 and employment rose 1.7 points to 49.1. Inflationary pressures declined. The new export orders index increased 2.0 points to 59.5. This report shows clearly a much more robust U.S. service sector in July. How do these surveys differ? The ISM survey focuses on large multinational companies, whereas the S&P survey polls a more a mixed set of companies by size. Unlike the S&P survey, ISM includes the public sector, construction and mining sectors. The ISM gives an equal weight to its five underlying components, whereas S&P ascribes a higher weight to the more forward-looking components of its survey. The ISM services survey is clearly the outlier when compared to all of the other PMI surveys we have examined. We will assume that the S&P survey is the more accurate depiction of the U.S. service industry. We will closely monitor any future discrepancies in U.S. services surveys. This is but just one example of why more than one month’s data is required before jumping to any conclusions. We also note our observation that larger companies have mostly fared better than their smaller counterparts since the pandemic began.
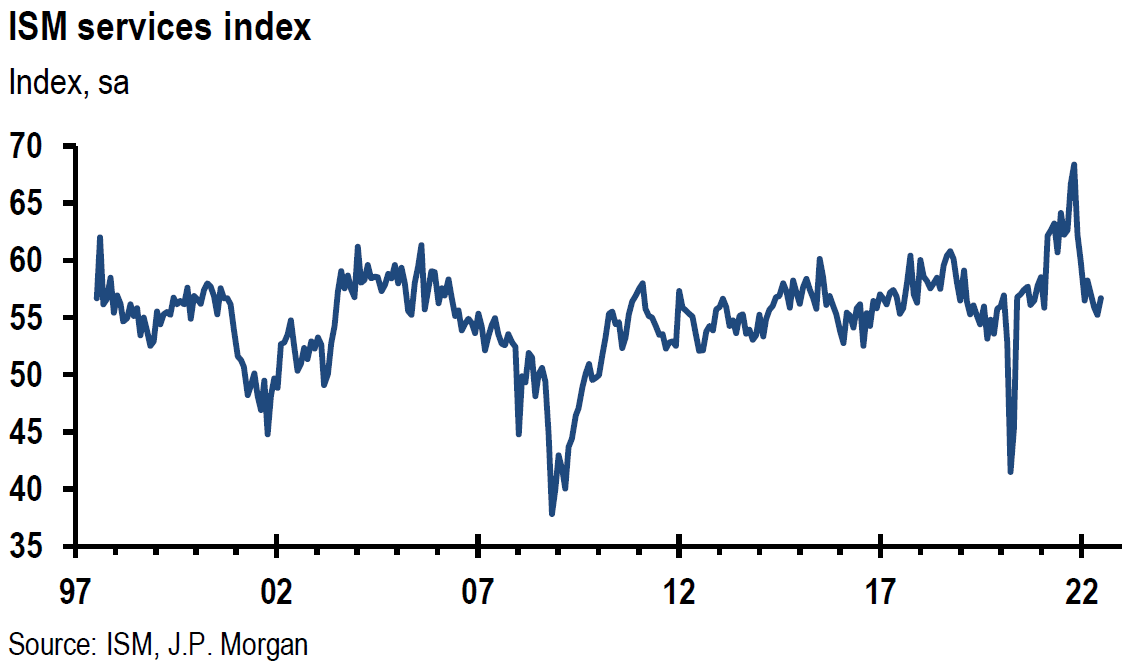
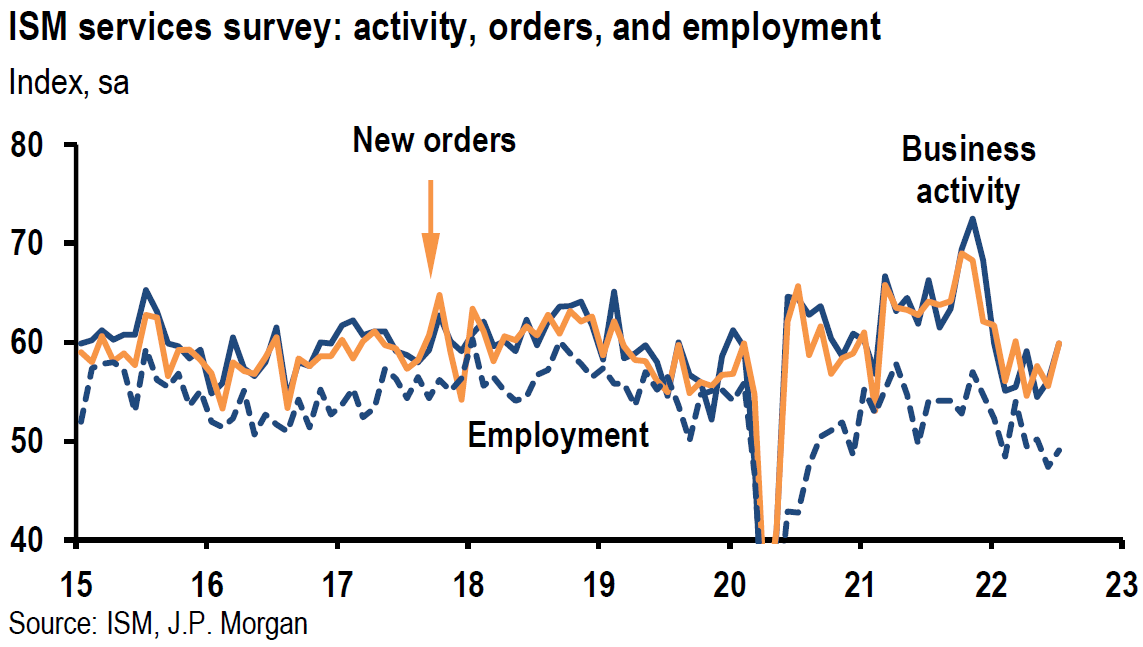
Source: JP Morgan, US: Services ISM beats expectations with July improvement (8-3-2022)
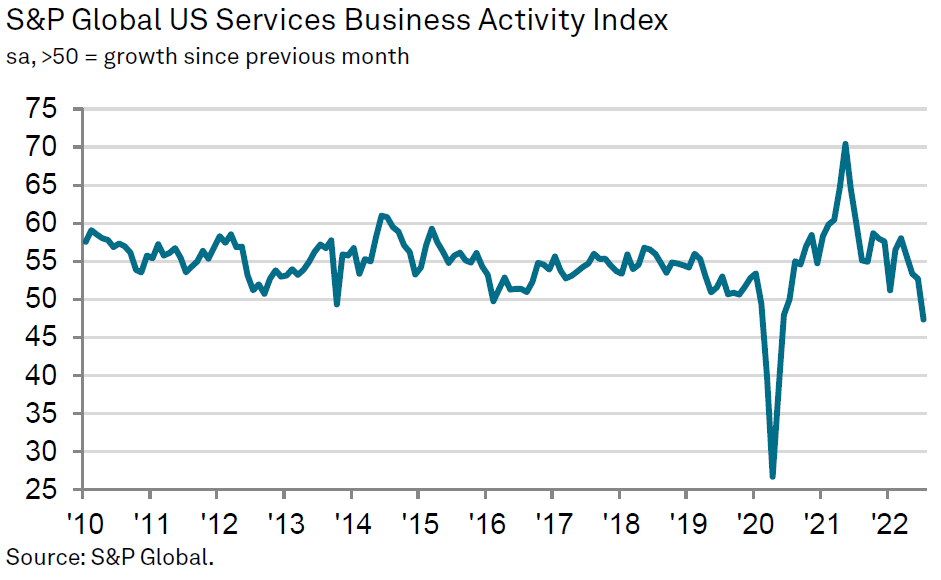
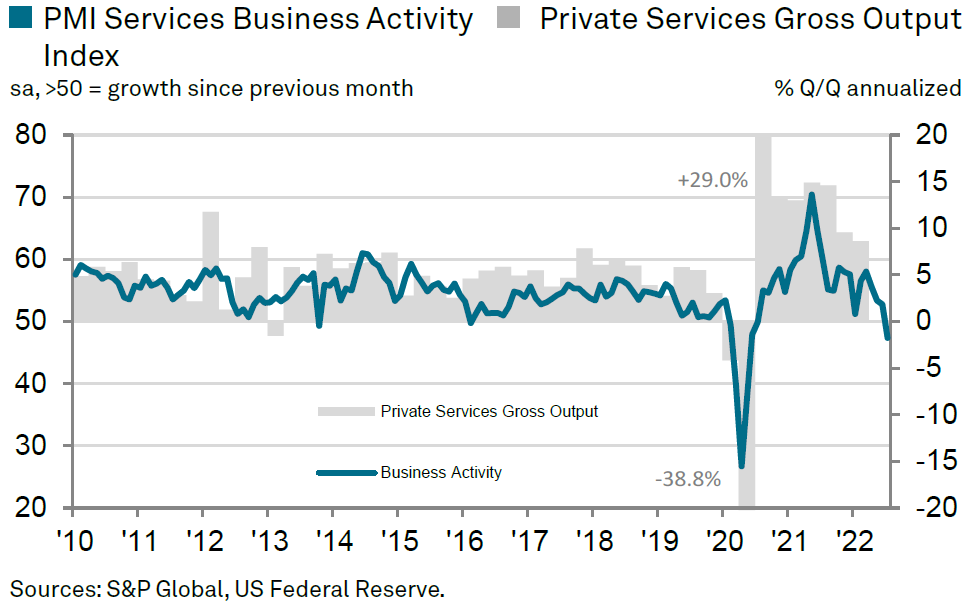
Source: S&P Global, S&P Global US Services PMI (8-3-2022)
Signs that U.S. Labor Market Less Tight
On Tuesday, the Bureau of Labor Statistics (BLS) released its Job Openings and Labor Turnover Survey (JOLTS) that reflects certain aspects of the U.S. labor market on the last business day of June. Job openings fell 605,000 from May’s level to 10.7 million, which was the fewest number of openings in the past nine months. This was the third consecutive month of declines since the record high of 11.855 million job openings were recorded in March. Over half of June’s decline was due to a decrease of 343,000 retail trade job openings. We expect wage growth to slow in the second half as the labor market becomes better balanced between demand and supply.
Initial jobless claims for unemployment insurance continued to increase for the week ended July 30 to 260,000. The increase was 6,000 from the prior week and was in line with expectations. It was 1,000 short of this year’s high recorded earlier in July. This compares to a 218,000 weekly average of initial jobless claims for the pre-pandemic year of 2019. Continuing jobless claims for the week that ended July 16, rose above expectations from 1.368 million the prior week to 1.416 million. We assume that the continuing recent rise in jobless claims is suggestive of a weakening U.S. labor market.
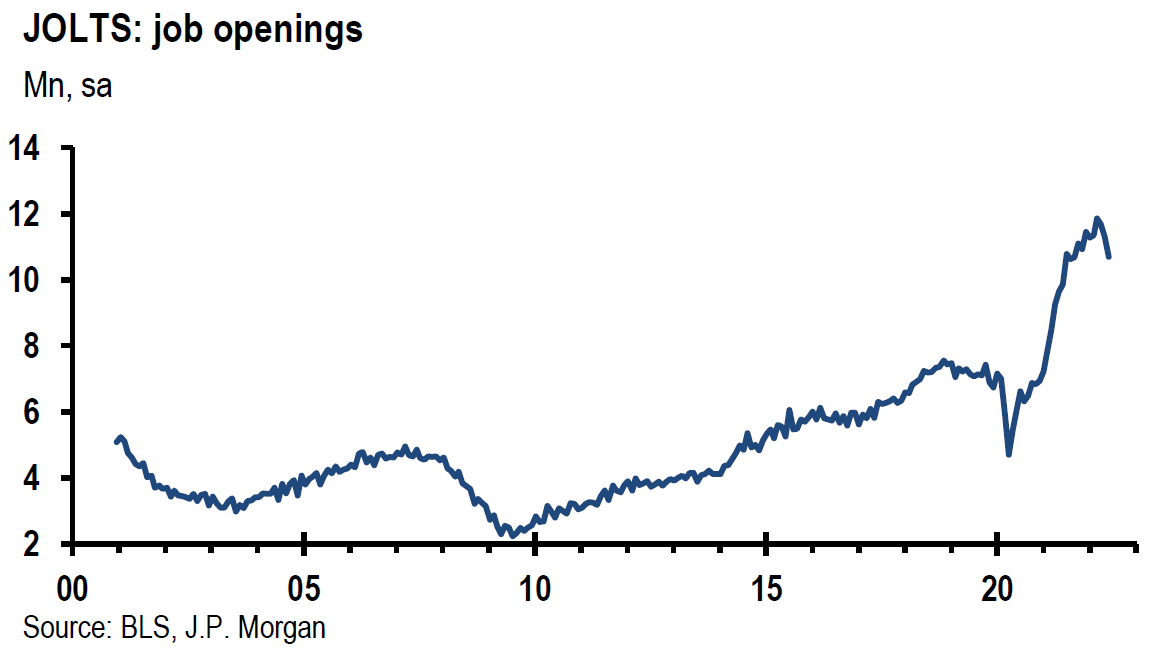
Source: JP Morgan, US: Job openings continue to come down, but stay high (8-2-2022)
U.S. Housing Data
U.S. housing prices continued to cool in June as rising mortgage rates and inflationary pressures in the wider economy caused a sharp decrease in June housing demand. The rate of price appreciation for U.S. homes fell from +19.3% y/y in May to +17.3% y/y in June. This drop of 2 percentage points month-over-month in the rate of house price appreciation was the largest monthly rate slowing of house price gains. Very low levels of U.S. housing vacancies remained near record-low levels at 0.8% in Q2. The rental vacancy level declined from 5.8% in Q1 to 5.6% in Q2. The Q2 result matched the lowest level of rental vacancies since the 1980s. We assume that these low vacancy rates and shortages of homes will continue to pressure upwardly shelter inflation for quite some time. Mortgage applications rose 1.2% during the last week of July. The average rate on a 30-year fixed rate mortgage fell 31 bps to 5.43% during that week. This was the largest weekly decline in this rate since 2020. The 30-year fixed rate mortgage rate, which started this year closer to 3%, breached 6% in June.
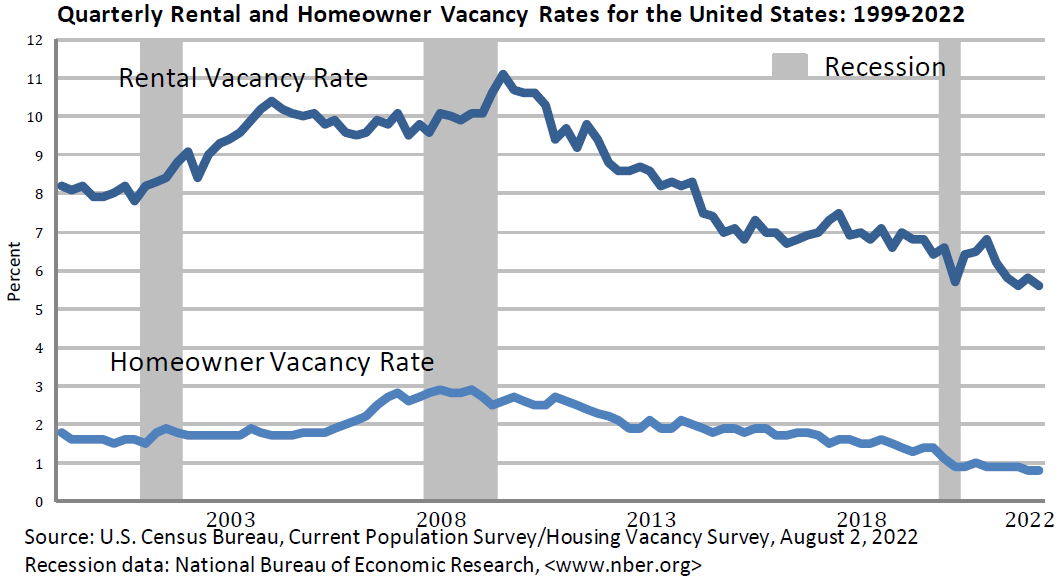
Source: US Census Bureau, Current Population survey/Housing Vacancy Survey (8-2-2022)
China PMIs
The July Caixin/Markit manufacturing PMI fell 1.3 points to 50.4 versus consensus expectations of 51.5. The June reading increased 3.6 points. The output component fell 4.4 points to 52.0, new orders dropped 0.9 points to 50.3 and export orders fell 1.6 points to 50.7. The National Bureau of Statistics (NBS) released the official manufacturing PMI for China. The NBS manufacturing PMI for July decreased 1.2 points to 49.0 versus a 0.6 rise in June. Both sets of PMI data suggest a slowing of industrial production in July. The Caixin output component was 4.4 points lower and fell to 52.0 in July, versus a 13.2-point gain in June. NBS output dropped 3 points to 49.8 versus a 3.1 gain in June. Caixin exports were 1.6 points lower to 50.7 in July versus a 7.6-point gain in June. NBS export orders decreased 2.1 points to 47.4 in July versus a 3.3-point gain in June. Input prices decreased in July as NBS input prices contracted more. The NBS survey is focused more on larger state-owned enterprises. The Caixin survey is focused more on smaller companies, many of which are coastal companies.
The Caixin July services PMI increased from 54.5 in June to 55.5 in July. The rate of growth was the sharpest since April 2021. The rate of output expansion quickened to a 15-month high. New orders also rose at a faster pace in spite of a fall in foreign demand. Input prices rose at a stronger pace while prices charged rose only slightly. In marked contrast to most other countries’ PMIs, firms were generally optimistic for business activity over the next year with overall sentiment hitting an eight-month high. The easing of COVID-19 restrictions played a significant role in these higher figures for services. The official non-manufacturing PMI released by NBS for July declined from a 13-month high of 54.7 in June to 53.8, reflecting rising COVID-19 infections and renewed curbs in some cities. The index for new orders dropped from 53.2 in June to 49.7, and export sales declined from 50.1 last month to 45.1 for July. Input costs decreased for the first time since December 2021, while prices charged decreased for the fourth consecutive month and dropped from 49.6 last month to 47.4 in July. Confidence declined from 61.3 to 59.1. We can observe that the Caixin surveys of smaller firms are generally more positive than the larger state-controlled companies.
Bank of England Hikes by 50 bps
On Thursday, the Bank of England (BOE) hiked its key interest rate 50 bps to 1.75%. This was the largest single hike since 1995. The BOE expects peak headline inflation of 13.3% y/y in October and that the UK will enter a recession in Q4 that will persist for five quarters. The Monetary Policy Committee (MPC) of BOE voted for the 50-bps hike by a vote of eight-to-one. The MPC cited increasing inflationary pressures in both the UK and EU since its last meeting in May. In particular, it cited the near-doubling of natural gas prices due to Russian restriction of natural gas flows into EU. The MPC now viewed the effects from the Russia-Ukraine war as the greatest contributor to UK inflation “by some way.” UK inflation rate hit a 40-year high of 9.4% y/y in July as food and energy prices continued their ascent. The BOE reiterated its commitment to a 2% targeted rate of inflation.
Bottom Line
For the time being we are maintaining our basic investment approach as expressed in last week’s commentary. We will continue to favor high quality big cap stocks with good balance sheets, and relatively stable cash flows and profit margins. For long term investors who are prepared to tolerate volatility, we still maintain a preference for selected high quality big cap tech and growth stocks as well as energy shares. Again, we would only add to positions on downturns. We assume continued volatility across virtually all financial markets. Many uncertainties remain. We continue to forecast very rapid changes in economic trends, many of which could be “surprising.”

Definitions
Purchasing Managers’ Index (PMI) – The Purchasing Managers’ Index is an index of the prevailing direction of economic trends in the manufacturing and service sectors. The purpose of the PMI is to provide information about current and future business conditions to company decision makers, analysts, and investors.
ISM Manufacturing Index (PMI) – The ISM manufacturing index, also known as the purchasing managers’ index (PMI), is a monthly indicator of U.S. economic activity based on a survey of purchasing managers at more than 300 manufacturing firms. It is considered to be a key indicator of the state of the U.S. economy.
Federal Open Market Committee (FOMC) – The Federal Open Market Committee (FOMC) is the branch of the Federal Reserve System that determines the direction of monetary policy specifically by directing open market operations. The committee is made up of 12 members: the seven members of the Board of Governors; the president of the Federal Reserve Bank of New York; and four of the remaining 11 Reserve Bank presidents on a rotating basis.
Real Interest Rate – A real interest rate is an interest rate that has been adjusted to remove the effects of inflation. Once adjusted, it reflects the real cost of funds to a borrower and the real yield to a lender or to an investor.
Basis Points (bps) – A basis point is one hundredth of one percent, used chiefly in expressing differences of interest rates.
Return Dispersion – The dispersion of return on an asset shows the volatility and risk associated with holding that asset. The more variable the return on an asset, the more risky or volatile it is.
Consumer Discretionary Sector – Sector classified by goods and services that are considered non-essential by consumers, but desirable if their available income is sufficient to purchase them.
Technology Sector – The technology sector is the category of stocks relating to the research, development, or distribution of technologically based goods and services. This sector contains businesses revolving around the manufacturing of electronics, creation of software, computers, or products and services relating to information technology.
Communication Sector – The Communications Services Sector contains companies that provide communications services primarily through a fixed-line, cellular, wireless, high bandwidth and/or fiber optic cable network.
S&P 500 – The S&P 500 is a total return index that reflects both changes in the prices of stocks in the S&P 500 Index as well as the reinvestment of the dividend income from its underlying stocks.
NASDAQ – The Nasdaq Composite Index is the market capitalization-weighted index of over 2,500 common equities listed on the Nasdaq stock exchange.
U.S. Dollar Index (DXY) – The U.S. dollar index is a measure of the value of the U.S. dollar relative to a basket of foreign currencies.
Growth Stock – A growth stock is any share in a company that is anticipated to grow at a rate significantly above the average growth for the market. These companies generally do not pay dividends, instead growth stocks tend to reinvest any earnings they accrue in order to accelerate growth in the short term.
Job Openings and Labor Turnover Survey (JOLTS) – The job openings and labor turnover survey are a monthly report by the Bureau of Labor Statistics (BLS) of the U.S. Department of Labor counting job vacancies and separations, including the number of workers voluntarily quitting employment.
China Caixin Manufacturing Purchasing Managers Index – The Caixin PMI is a composite indicator designed to provide an overall view of activity in the manufacturing sector and acts as a leading indicator for the whole economy.
China National Bureau of Statistics (NBS) Manufacturing PMI – In China, the NBS Manufacturing Purchasing Manager Index measures the performance of the manufacturing sector and is derived from a survey of more large-scale, state-owned companies.
IMPORTANT DISCLOSURES
The views and opinions included in these materials belong to their author and do not necessarily reflect the views and opinions of NewEdge Capital Group, LLC.
This information is general in nature and has been prepared solely for informational and educational purposes and does not constitute an offer or a recommendation to buy or sell any particular security or to adopt any specific investment strategy.
NewEdge and its affiliates do not render advice on legal, tax and/or tax accounting matters. You should consult your personal tax and/or legal advisor to learn about any potential tax or other implications that may result from acting on a particular recommendation.
The trademarks and service marks contained herein are the property of their respective owners. Unless otherwise specifically indicated, all information with respect to any third party not affiliated with NewEdge has been provided by, and is the sole responsibility of, such third party and has not been independently verified by NewEdge, its affiliates or any other independent third party. No representation is given with respect to its accuracy or completeness, and such information and opinions may change without notice.
Investing involves risk, including possible loss of principal. Past performance is no guarantee of future results.
Any forward-looking statements or forecasts are based on assumptions and actual results are expected to vary from any such statements or forecasts. No assurance can be given that investment objectives or target returns will be achieved. Future returns may be higher or lower than the estimates presented herein.
An investment cannot be made directly in an index. Indices are unmanaged and have no fees or expenses. You can obtain information about many indices online at a variety of sources including: https://www.sec.gov/fast-answers/answersindiceshtm.html or http://www.nasdaq.com/reference/index-descriptions.aspx.
All data is subject to change without notice.
© 2024 NewEdge Capital Group, LLC


