

Weekly Summary: March 3 – March 7
Key Observations:
- Before this week, we thought that the Federal Reserve (Fed) most likely would maintain a 25 basis points (bps) pace in raising the federal funds rate. But we were concerned that the Fed might hike by 50 bps, which might precipitate a more severe downturn in U.S. stock prices. Fed chair Powell “opened the door” for a possible 50 bps hike in his testimony before the U.S. Senate. This precipitated the two to 10-year-Treasury yield curve to invert by over 100 bps. The over 100 bps inversion lasted only two days before issues at Silicon Valley Bank, including “funding issues,” which quickly led to its collapse.
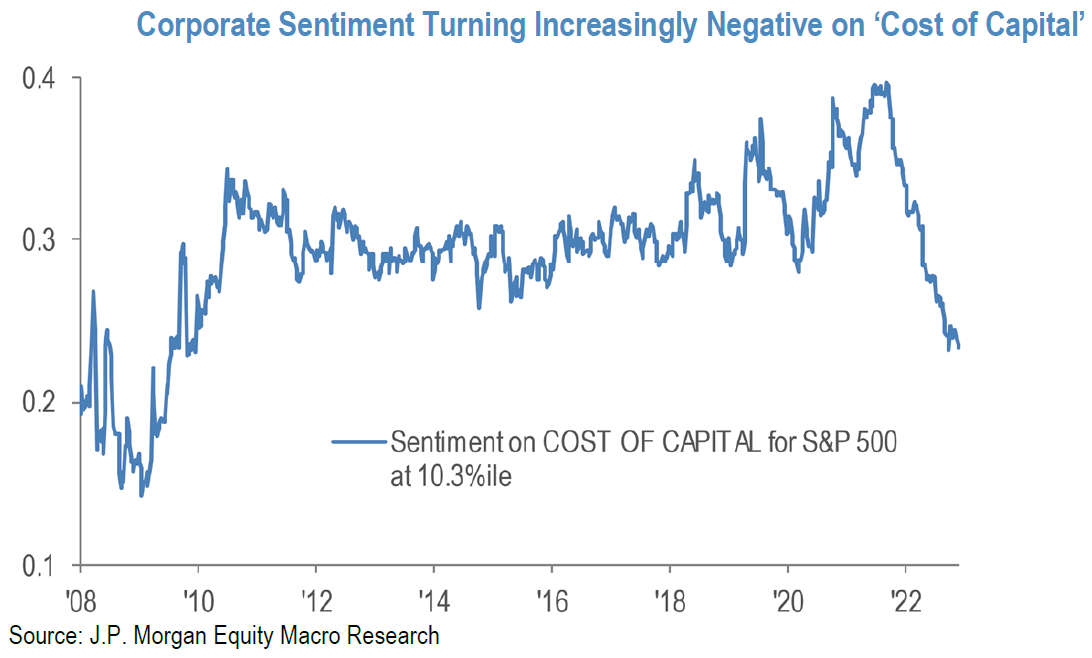
- Financial markets quickly increased the probability of a 50 bps hike in March to as high as 80% from an approximately 20% probability the day before Powell’s Senate testimony. By Friday, a 25 bps hike was once again most probable. Other U.S. banks have noted more competition in obtaining and keeping deposits, which has increased their funding costs and have lowered their net interest income (NII). On March 9, J.P. Morgan (JPM) observed that “rising cost of capital remains a key concern for corporates.” JPM highlighted that “small caps” in general could be very sensitive to higher interest rates as 40% of S&P 600 debt is floating rate debt. Higher rates could lead to a material deterioration in the financial performance of some small caps. JPM worries that such small cap issues could eventually “permeate into large caps in the form of lost demand, lower margins and/or asset write-downs/credit issues.” Silicon Valley Bank is an example of how quickly a company’s financial viability can deteriorate.
- We surmise that cost of capital and access to sufficient capital, especially with respect to banks, might make it more difficult for the Fed to hike by 50 bps at its March meeting. It will be hard to decipher at what level and the rapidity of attaining a sufficiently restrictive level in the federal funds rate could be a “tipping point” for many undercapitalized companies. This is a primary reason why we have a very strong preference for quality companies that highlight strong balance sheets and relatively steady cash flows.
- Most of the economic data we analyzed this week points to a continuing robust U.S economy with a slowing but “bumpy” rate of inflation. The U.S. labor market remains very tight. We were very encouraged, however, by the slowing monthly increase in February’s average hourly earnings on a monthly basis.
The Upshot: Our general investment approach remains the same as depicted in last week’s commentary. We maintain our preference for quality stocks with good balance sheets, relatively stable cash flows with stable margins. Volatility across sectors continues to be supportive of a diversified global portfolio for long term investors. We expect volatility to continue across asset classes.
We continue to stress that stock selectivity in this current financial market environment is of paramount importance. We are looking for that special “Desert Rose.” We remain wary that we are not imagining what we want to see, but instead keep an open mind so that we can better see the “reality” of a company’s fundamentals. Only then would we be able to properly assess the risk-reward of owning a particular investment. Another important consideration would be how a specific investment might fit into a diversified portfolio.
In our opinion, many large growth/tech stocks have outperformed for much of this year because their earnings, cash flows and balance sheets could shield them from funding needs at the “wrong” time. Even though such companies could be expected to have lower earnings and cash flows into a slowing economy, many of these companies could continue to grow, even if it is at a slower pace. We would expect such companies to continue to demand a premium in a slowing economy. To the extent that the U.S. economy slows sufficiently, credit issues could be expected to lead to loan losses at many banks as well as an increase in credit spreads. The better capitalized banks should be expected to better “navigate” in such an environment.
Source: JP Morgan, US Equity Strategy (3-9-2023)
Powell Opens the Door to 50bps Hikes
Before this week, we thought that the Fed most likely would maintain a 25 bps pace of raising the federal funds rate from the current range of 4.5% to 4.75% until it reached a “sufficiently restrictive” range that could bring down inflation to a 2% target rate if such a restrictive rate were maintained for “some time.” We thought that the Fed would adhere to this pace at its next scheduled meeting of March 21-22 and raise the range to 4.75% to 5.0%. But given the stronger-than-expected economic data released after its last meeting, we were somewhat concerned that the Fed could show impatience and hike by 50 bps at its March meeting. In last week’s commentary we indicated that it “could be ‘critical’ that the Fed maintain its pace of 25 bps.” If the Fed were to revert to a rate increase of 50 bps or higher, “we surmise that U.S. stocks would be put at much greater risk of severe downturns.” On Tuesday, Fed chair Powell testified before the U.S. Senate’s Committee on Banking, Housing, and Urban Affairs. In his prepared statement, Powell said that the “latest economic data have come in stronger than expected, which suggests that the ultimate level of interest rates is likely to be higher than previously anticipated. If the totality of the data were to indicate that faster tightening is warranted, we would be prepared to increase the pace of rate hikes.” We have been in agreement with Powell that the process of lowering the rate of inflation most likely would be “bumpy.” Powell acknowledged that many measures of inflation have slowed, particularly in the core goods sector. He seemed relatively optimistic that housing services inflation was starting to “flatten out”, as was evident in recently signed lease agreements. But Powell also indicated that he saw little “disinflation” in core services excluding housing, which accounts for more than half of core consumer expenditures. Services inflation is considered generally to be less responsive to interest rates than goods inflation. The Fed appears to be targeting a further slowing of wage growth as a key component to attain a 2% rate of inflation.
Source: Goldman Sachs, What’s Top of Mind in Macro Research: A more hawkish Fed, data-dependent markets, BoJ meeting (3-8-2023)
25 bps or 50 bps Hikes Still an Open Question
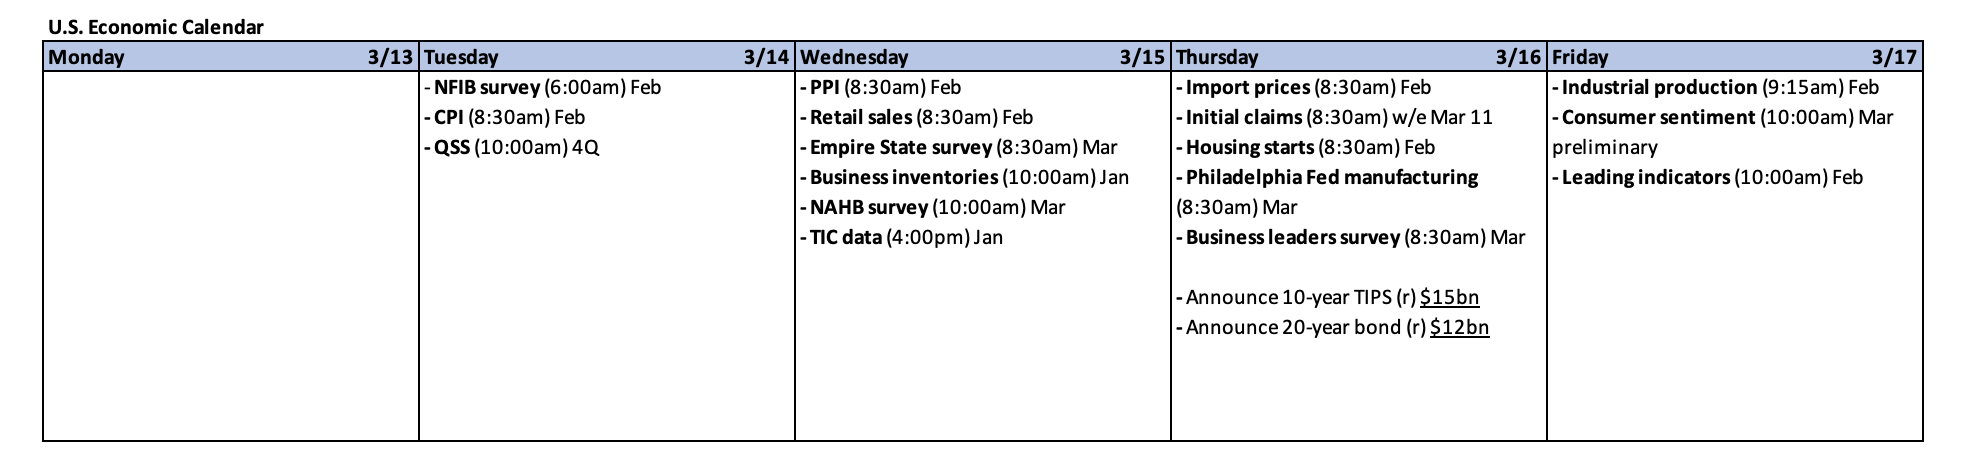
The day after his Senate testimony, Powell testified in front of the House Financial Services Committee where he clarified that the Fed had not yet made a determination of the magnitude of the rate hike at the Fed’s next meeting. “We’re not on a preset path. We will be guided by the incoming data and the evolving outlook.” This data will include the job vacancies and “quits” rate embodied in the Job Openings and Labor Turnover Survey (JOLTS) data, the February U.S. nonfarm payrolls data and the release of the latest U.S. Consumer Price Index (CPI) early next week.
Expected Changes in Fed’s “Dot Plot”
At the Fed’s December 2022 meeting the so-called “dot plot” showed an average terminal rate range of 5.0% to 5.25%. The dot plot shows each of the Federal Open Market Committee’s (FOMC) participant’s indication of what they perceive to be the appropriate terminal rate. The dot plot is generated quarterly and will be revealed next on March 22. Before Powell’s Senate testimony, financial markets were pricing in a terminal rate range of 5.0% to 5.25%. After his testimony, the range was pushed up to 5.5% to 5.75%. Financial markets were pricing in about a 20% probability of a 50 bps hike on March 22. But this probability jumped to between 70% and 80% after Powell’s testimony. The terminal rate was priced as high as 5.66% by financial markets.
Two-to-10-year Treasury Yield Curve Inversion Tops 100 bps
We postulated in Q4 2022, that the 10-year Treasury yield high of 4.33% could be the high for the current cycle of monetary tightening, and we recommended that long term investors purchase 10-year Treasuries with a yield above 4.2% as a hedge against the risk of a U.S. recession. We also indicated that we thought that the two-to-10-year yield curve would fluctuate more than the 10-year Treasury yield. We thought it likely that the two-to-10-year yield curve inversion could surpass 100 basis points. This is in fact what happened on the day of Powell’s Senate testimony. The next day, this yield curve inversion traded over 108 bps as the two-year Treasury yield rose more than 5%. This inversion was barely over 82 bps on Thursday of last week, before rising to a little over 90 bps at the end of last week. On Thursday of this week, the two-to-10 year Treasury yield curve inversion dropped back to the 96 bps range on “funding“ concerns of the SVB Financial Group (SVB), whose operating segments include the well-known Silicon Valley Bank, which has very close ties with many venture capital firms. The night before, SVB announced a $1.75 billion share sale to fortify its balance sheet.
SVB Funding Issues – Isolated or More Widespread Banking Issues?
According to Reuters on March 9, “SVB is the banking partner for nearly half of U.S. venture-backed technology and healthcare companies that listed on stock markets in 2022.” SVB chief executive Greg Becker indicated that a cash burn by clients increased in February. In a letter to investors, Mr. Becker wrote: “While VC (venture capital) deployment has tracked our expectations, client cash burn has remained elevated and increased further in February, resulting in lower deposits than forecasted.” SVB also indicated that it suffered significant losses in its portfolio, which included treasuries and mortgage-backed securities. SVB stock closed more than 60% lower on that day and was indicated lower in after-hours trading. Prior to the dramatic recent events surrounding SVB, many banks had indicated increased competition in attracting and retaining their deposit base, along with rising costs. The woes of SVB raised concerns across the U.S. banking sector as many large and well-known banks saw their share prices drop by over 5%. Not surprisingly, the S&P 500 financial sector fell over 4% on March 9 and was the worst performing sector. The JPM regional bank index closed 9% lower. On March 9, Goldman Sachs (Goldman) described Thursday’s selloffs in bank stocks as “one of the largest selloffs of the last 25 years.” Goldman added that the risk of contagion from small to large banks is remote, considering the low share of regional banks in the IG [investment grade] market. Similarly, the risk of a capital or liquidity event among large banks is also remote.”
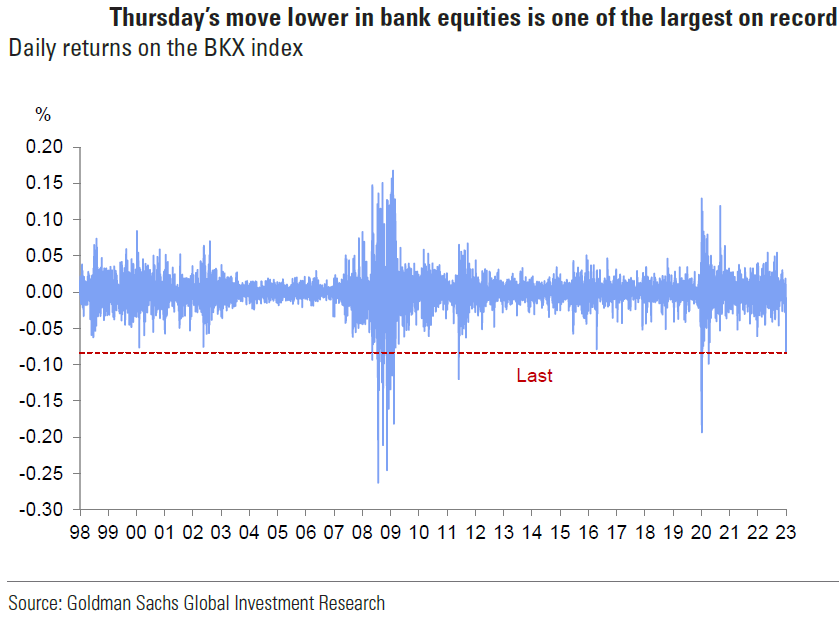
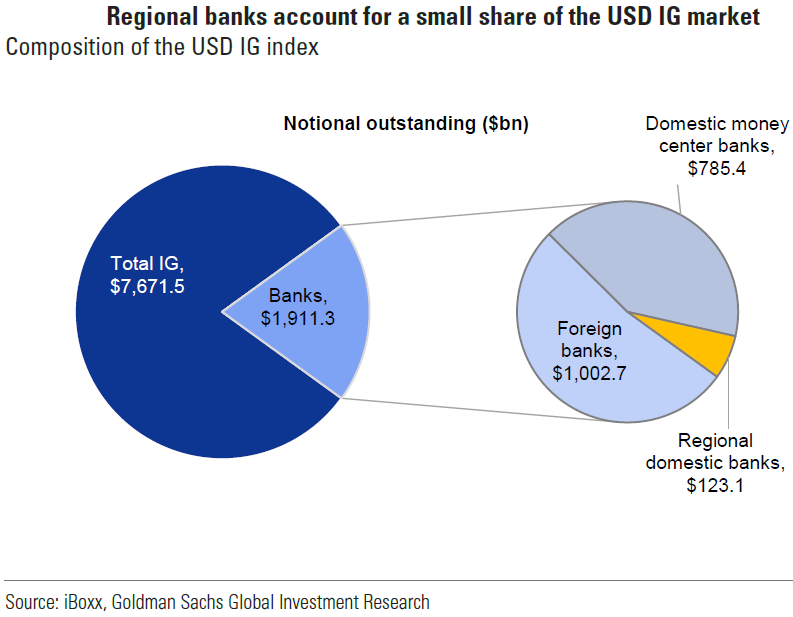
Source: Goldman Sachs, Idiosyncratic, not systemic (3-9-2023)
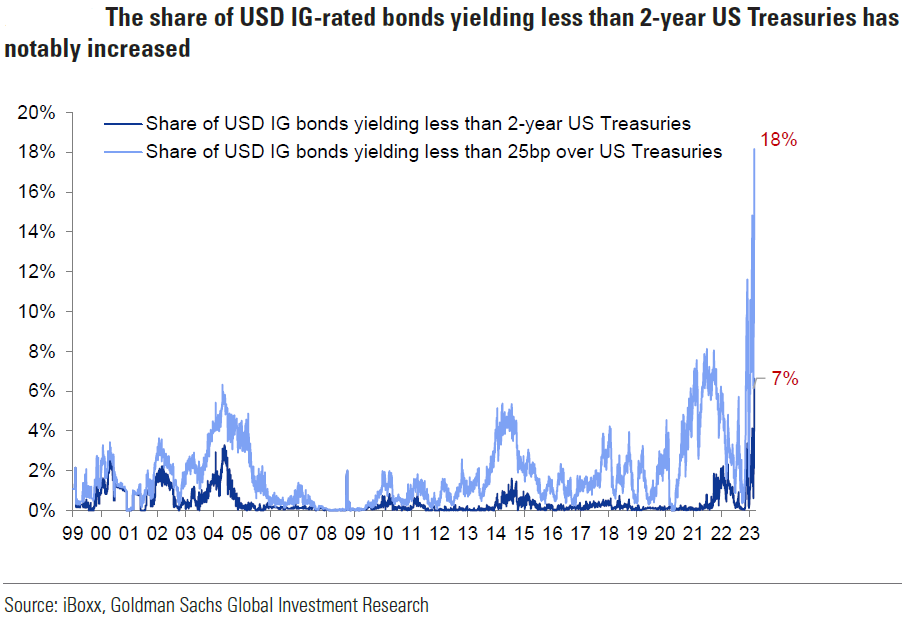
Confidence “Required” for Financial Institutions
Our prior commentaries have shown than many banks have been tightening their lending standards over the past few months. This should eventually slow the US. economy, lower demand, and thereby hopefully lower inflation. In our opinion, it is crucial that confidence remains in the U.S. banking system. We believe that financial institutions “require” confidence to function efficiently. We surmise that lower liquidity and lessened access to credit could cause credit spreads to widen further in general.
Stock Selectivity Remains Key – Picking a “Desert Rose”
We indicated in last week’s commentary, that an “open mind for a different view” will continue to be central in our investment approach. Our constant risk-reward analysis is also part of this approach. This week’s events and financial markets’ reactions are further examples of “rapidity of change” that has been a hallmark of markets since the onset of the pandemic. We continue to stress that stock selectivity in this current financial market environment is of paramount importance. We have tried to ascertain the best risk-reward opportunities in a globally well-diversified portfolio for long term investors. This process could be likened to finding a “Desert Rose” as depicted in Sting’s song – accompanied by Cheb Mami. In our search for individually “selected” investment opportunities, we may often “realize that nothing’s as it seems.” We try to see only the reality surrounding investment opportunities and not “dream of rain… or of gardens in the desert sand” as Sting was imagining, or as we would like to imagine. “This desert rose; Whose shadow bears the secret promise; This desert flower; No sweet perfume ever tortured me more than this.” But a desert rose can be deceiving and it can hide both good and bad qualities, apart from its natural beauty. Sting only referred to the enticing outward qualities of the desert rose. But the desert rose can be poisonous and very toxic. Alternatively, it has been adapted as a traditional medicine in certain cultures. It is up to the investor to discover the predominant nature of each investment and to avoid those with elements of possible toxicity. We would like to mention that in our experience, we have found that an equity market that trades within a relatively well-defined range – even if broad – could perhaps be suited best for a “stock selective” approach.
SVB Issues and Possible Banking Concerns May Affect Pace of Hikes
We suppose that the woes of SVB and the subsequent focus on concerns of other potential funding issues in the U.S. banking system could complicate the Fed’s decision-making process at its next meeting. The very negative stock reaction of most U.S. banks on Thursday could be a good indication that investors’ concerns about the U.S. banking system could be widespread. We suspect that this set of circumstances could put the Fed in a precarious position. After Thursday’s events, we trust that the Fed could become more hesitant to increase the federal funds rate by 50 bps at its March meeting, even if the anticipated economic data were very strong. Another 50 bps hike on top of an already restrictive policy rate might reveal more banking issues. But if the economic data were strong and the Fed maintained its 25 bps pace, then perhaps investors might think that there really are other serious concerns in the banking system. Investor confidence in the U.S. banking system could be diminished. We maintain that the U.S. financial system will be weakened to the extent that investor confidence in the system is weakened. However, we remain hopeful that the “totality” of the incoming economic data may not be so overwhelmingly robust that it forces the Fed’s hand. We imagine that the issues surrounding SVB and the financial markets’ reactions might tip the scales to maintain a 25 bps hike in March. Evidently, financial markets appeared to agree with our assessment. According to Bloomberg News on the evening of March 9, “rates traders scaled back bets on a half-point hike this month to about an even chance.” The next day, Reuters indicated that federal funds futures were pointing to a 25 bps increase at the Fed’s March meeting. On Friday, the California Department of Financial Protection and Innovation “closed” Silicon Valley Bank and appointed the Federal Deposit Insurance Corporation (FDIC) as receiver after SVB failed to raise the needed capital to stay in operation. This is a stark reminder of how quickly a financial institution can collapse once confidence is lost.
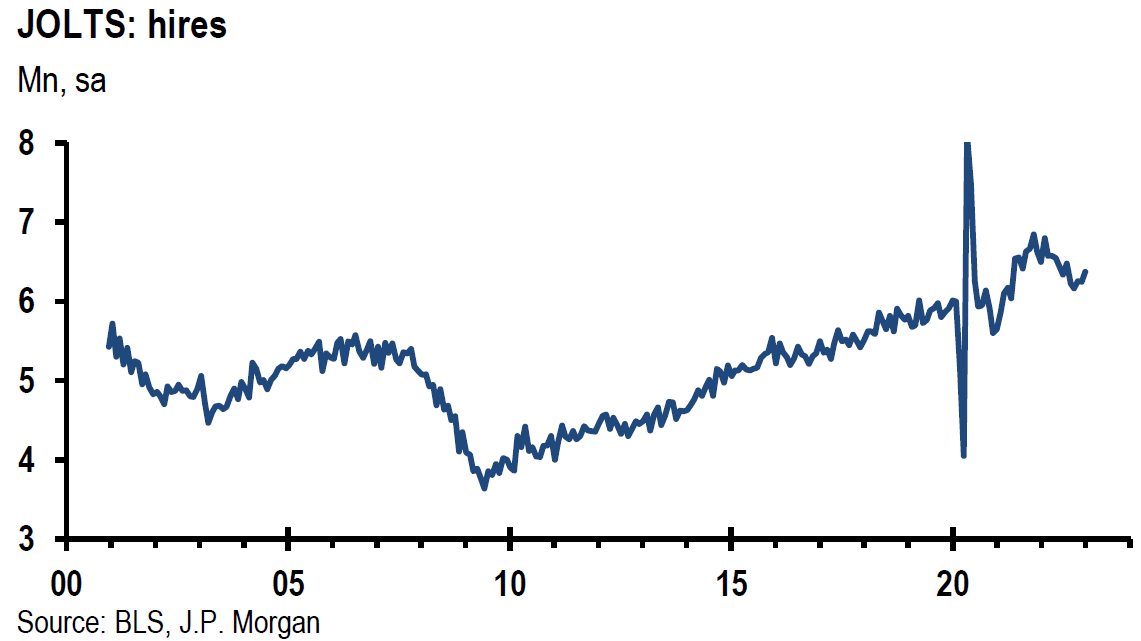
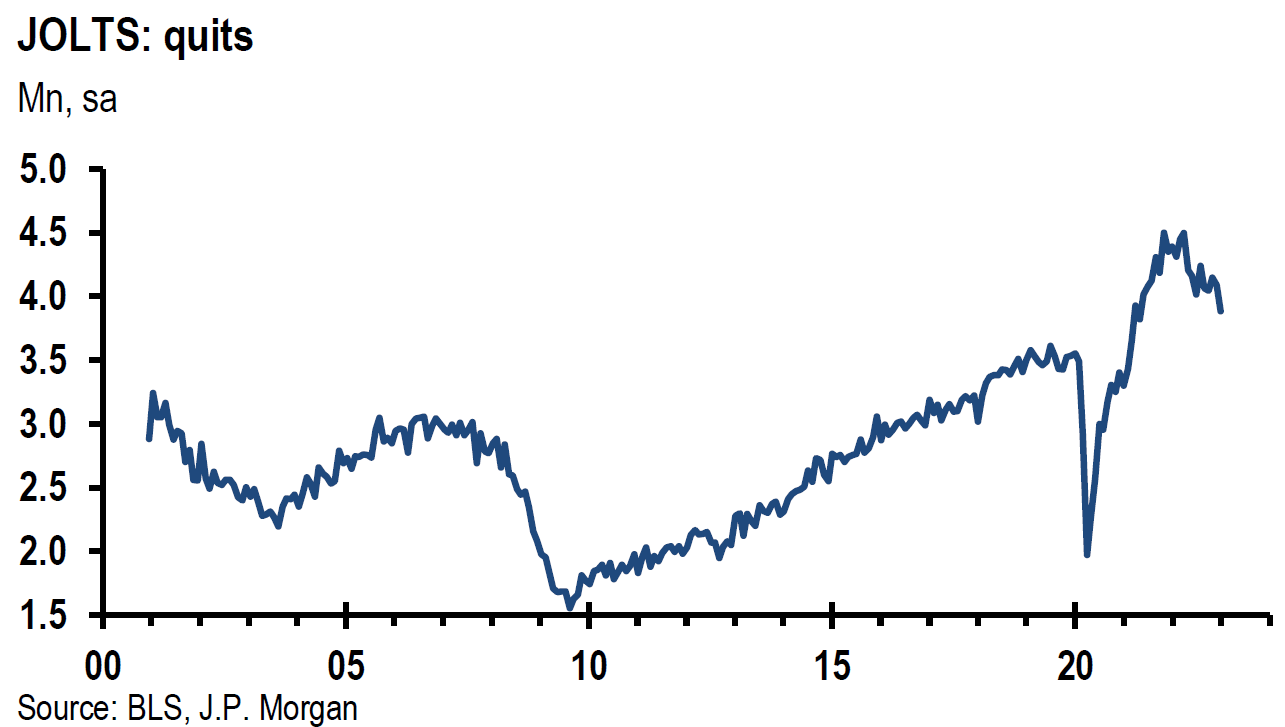
JOLTS – Job Vacancies and Quit Rate
We have often highlighted the tightness of the U.S. labor market and the pace of wage growth as a primary focus of the Fed in its efforts to rein in inflation. The Fed appears to have strong conviction that the primary way to drive down services inflation is through diminishing the rate of wage growth. To achieve this, the Fed is trying to diminish demand for labor relative to the supply for labor. The Job Openings and Labor Turnover Survey (JOLTS), provided by the U.S. Bureau of Labor Statistics (BLS) includes some useful data that can help in analyzing the labor market and its imbalances. The latest JOLTS data is as of the last business day for January. Job openings (vacancies) declined by less than expected to 10.824 million compared to a median expectation of 10.546 million. The prior month’s job openings were revised g=higher by 222,000 to 11.234 million. The Quit rate fell to 2.5% of the labor force from 2.7% for the prior month. A lower percentage in the Quit rate is interpreted generally as an indication that workers are becoming less confident in finding a job, so they are more reluctant to quit. This could be a sign that the labor market is becoming less tight. Increased layoffs could be yet another sign of a loosening labor market. Layoffs jumped from 1.475 million to 1.716 million in January. This latest figure is the highest in about two years.
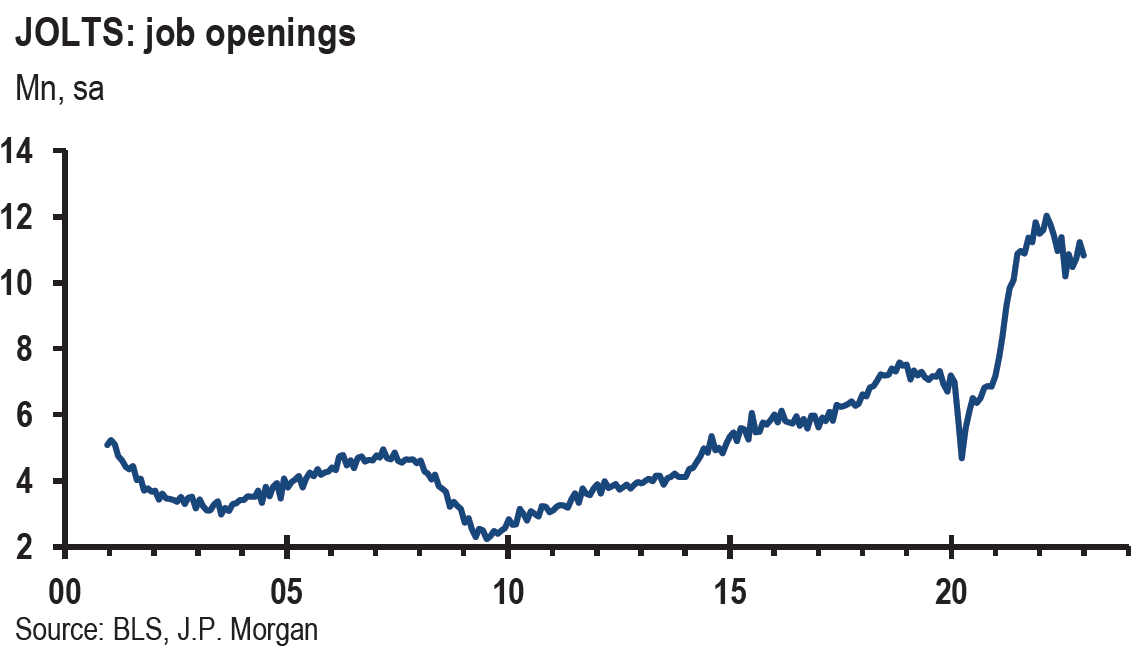
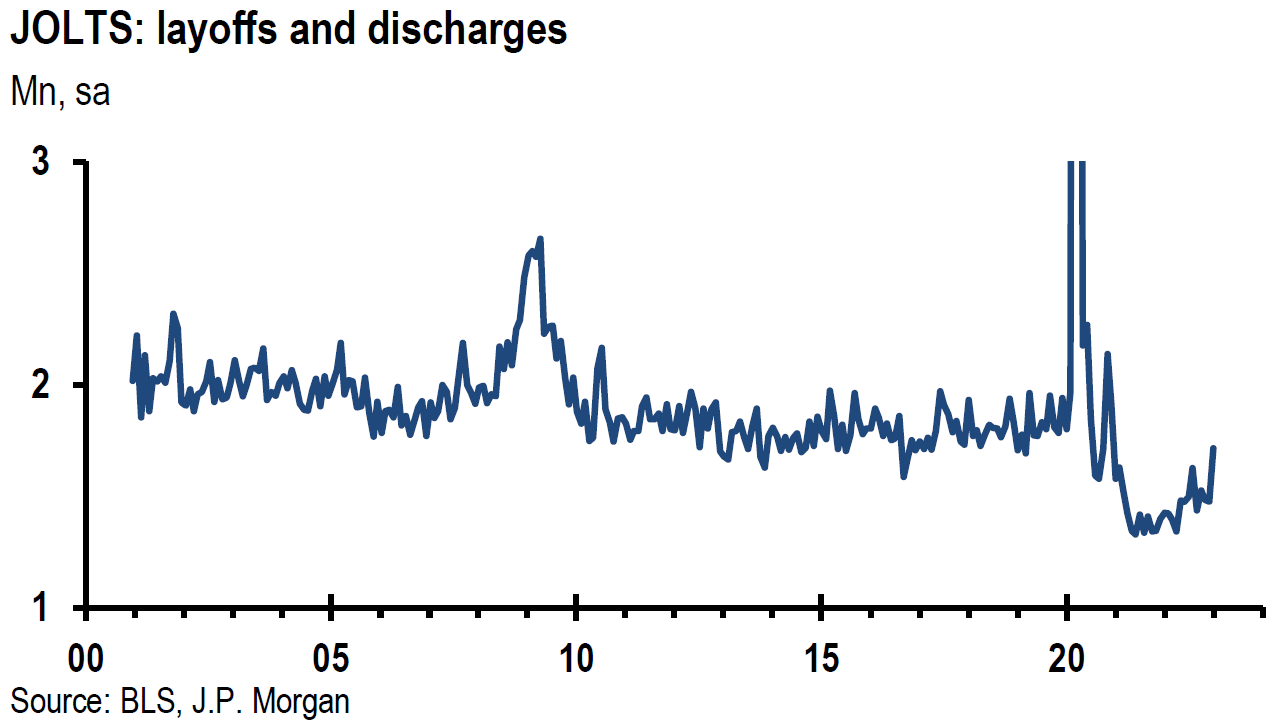
Source: US: JOLTS data soften, but generally stay strong (3-8-2023)
Challenger Layoffs Data Apparently Confirms JOLTS Increased Layoffs
Data from the outplacement firm of Challenger, Gray & Christmas, inc. (Challenger) appears to confirm the JOLTS increased layoffs. Challenger released its February report of U.S.-based employers’ layoffs on March 9. These employers announced job cuts of 77,770 cuts in February. This was the most for the month of February since 2009. Layoffs for January were 102,943, which was the highest reading since September 2020. The tech sector has announced 35% of all job cuts in 2023. Job cuts during January and February combined were 427% higher than for the comparable period in 2022 and were the highest January-February total since 2022. Andrew challenger, senior vice president observed: “Certainly, employers are paying attention to rate increase plans from the Fed. Many have been planning for a downturn for months, cutting costs elsewhere. If things continue to cool, layoffs are typically the last piece in company cost-cutting strategies.”
U.S. Weekly Unemployment Insurance Claims
Both the initial and continuing jobless claims increased by more than expected in the latest weekly data that was released. For the week ending March 4, initial claims increased by 21,000 week-over-week (w/w) to 211,000 versus a median forecast of 195,000. This level of initial claims was the most since December. For the week ended February 25, continuing claims rose by 69,000 to 1.718 million. This was the highest weekly total since mid-December and the biggest monthly gain since November 2021. Although this most recent claims data was higher than expected, it remains consistent with a still very tight labor market.
U.S. February Nonfarm Payroll Employment Rises Above Expectations – Monthly Wage Growth Cools
Nonfarm payroll employment rose by 311,000 versus an expected increase of 225,000. The prior two months were revised by a combined 34,000. The average monthly gain of jobs added over the past six months was now a robust 343,000. Average hourly earnings rose 0.2% m/m compared to an increase of 0.3% m/m in January and below expectations. The year-over-year (y/y) increase in average hourly earnings was 4.6% versus an expected increase of 4.7%, but above the prior months gain of 4.4% y/y. The unemployment rate rose to 3.6% from last month’s 3.4%. The labor force participation rate rose by 0.1% to 62.5% — its highest level since March 2020. Leisure and hospitality gained the most with 105,000 jobs added in February. Notable job gains also occurred in the retail trade, government and healthcare sectors. We view the 0.2% m/m increase in average hourly earnings as the most encouraging part of this report in regard to a lower rate of inflation. Hopefully, we will see this reflected in a lower rate of services inflation.
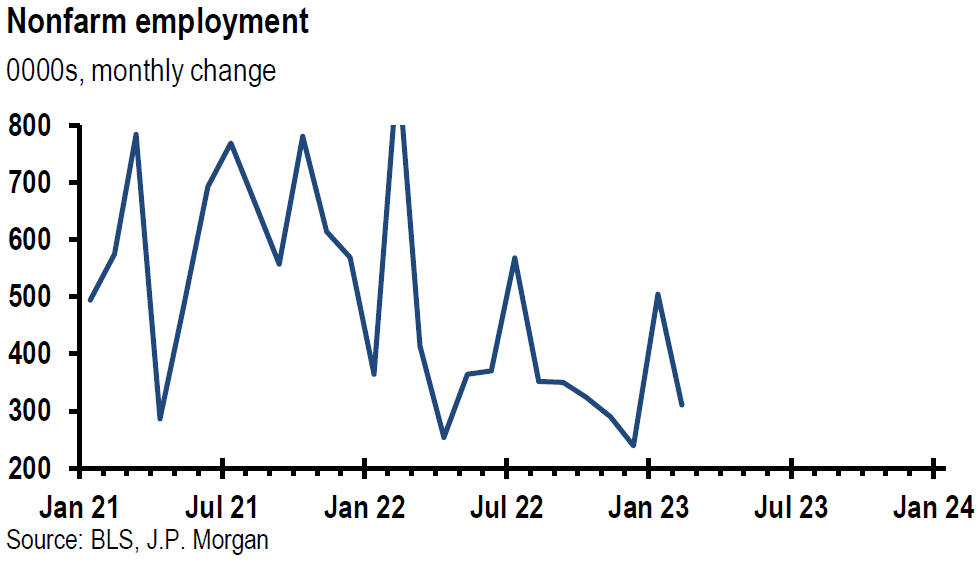
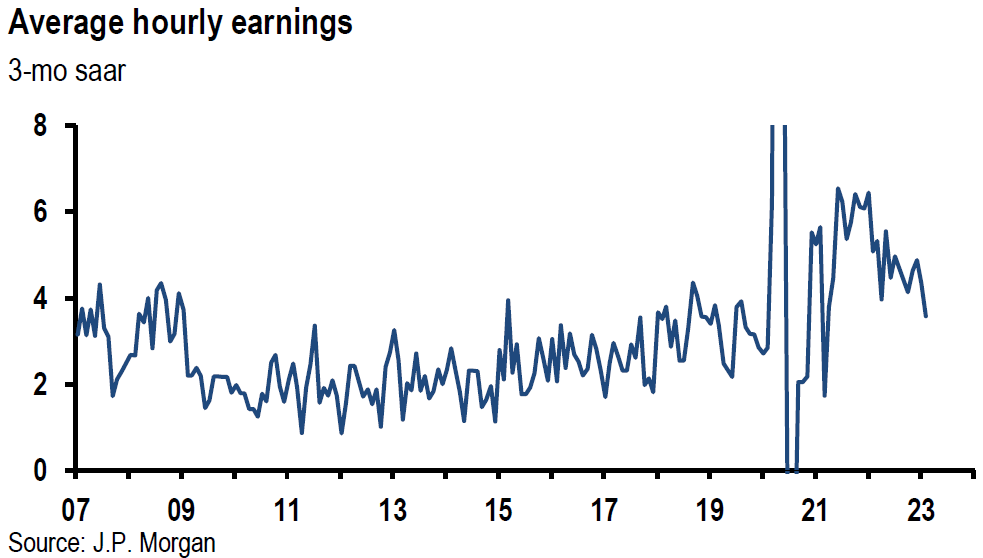
Source: JP Morgan, Mixed news in Feb jobs report (3-10-2023)
Manheim Used Vehicle Value Index Continues to Show Price Gains
This Manheim index tracks the prices of used vehicles sold at U.S. wholesale dealer auctions. Prices rose 4.4% (seasonally adjusted) m/m in February, which was the biggest monthly gain since October 2021 and was the largest February gain since 2009. January prices rose 2.5% m/m. February’s y/y prices were 7% lower, which was the lowest y/y loss in five months. Pickups had the smallest y/y declines at 3.9%. Luxury vehicles had the biggest declines at 10.1% y/y. The overall monthly price increase was 3.7% (non-seasonally adjusted) and 5.6% lower y/y. The Manheim report indicated that such a price increase was atypical so early in the year. Some dealers were surprised by the strength of car sales in January and the early part of February and needed to replace their inventories. The all-time high of the Manheim Index was 257.7, hit in January 2022. It then steadily fell to November when it hit a low of 217.6. It then climbed steadily to reach a level of 234.5 in February. Manheim’s new vehicle sales data showed an average price increase 0f 9.1% m/m in February and a gain of 8.7% y/y. S&P Global Mobility data showed that the average age of cars and trucks on U.S. roads was at a record high of 12.2 years in 2022. That was the fifth consecutive year of an aging fleet of vehicles on U.S roads. The rather steady decrease of used vehicle prices was an important contributor to a deflationary trend for part of 2022.
Bottom Line
For the time being we are maintaining our basic investment approach as expressed in last week’s commentary. We continue to prefer high quality stocks that offer good balance sheets, as well as relatively stable cash flows and profit margins. We prefer a very diversified global portfolio for long term investors. We expect volatility to continue cross asset classes.
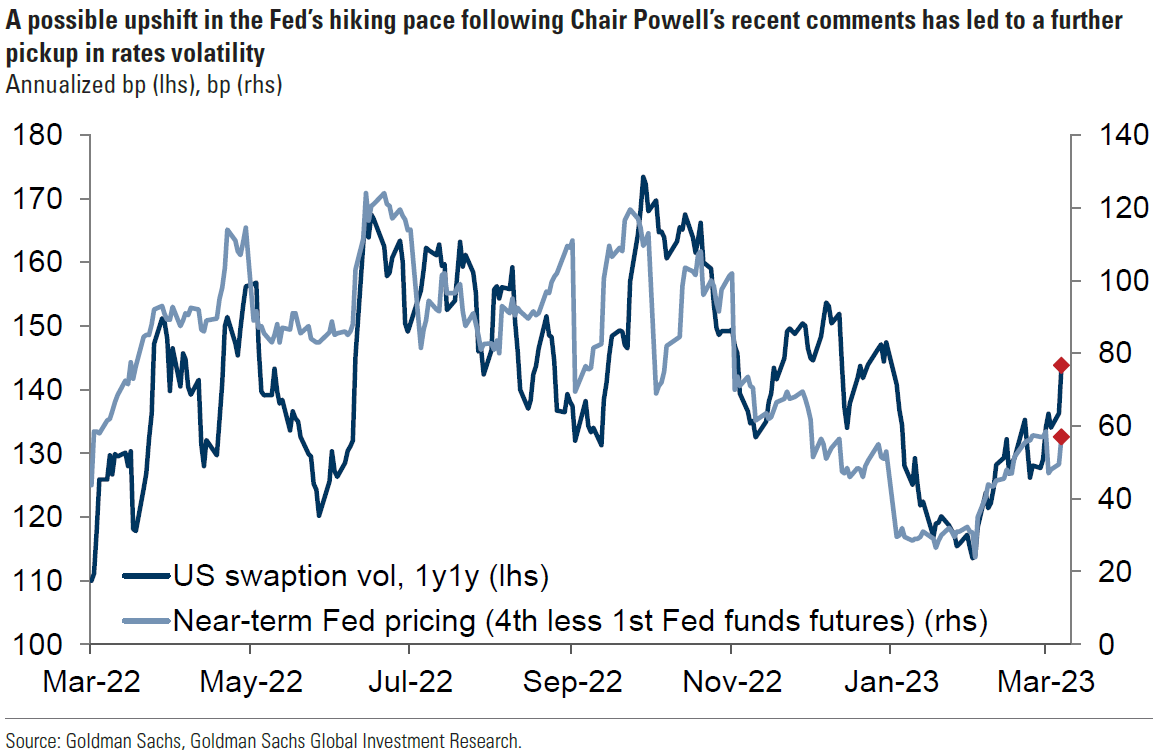
We continue to stress that stock selectivity in this current financial environment is of paramount importance. We are always trying to find that special “Desert Rose.” The volatility this week was emblematic of the “rapidity of change” that has been the hallmark of financial markets since the onset of the pandemic. This has been particularly the case this week in regard to bond market volatility. Changes in financial markets are simply too fast in general to reposition portfolios for long term investors. We are constantly trying to construct a portfolio that could benefit from many types of market environments.
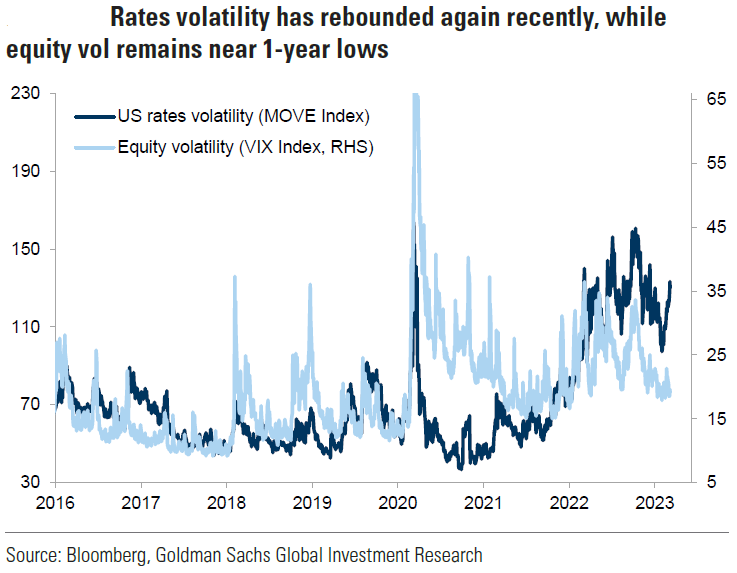
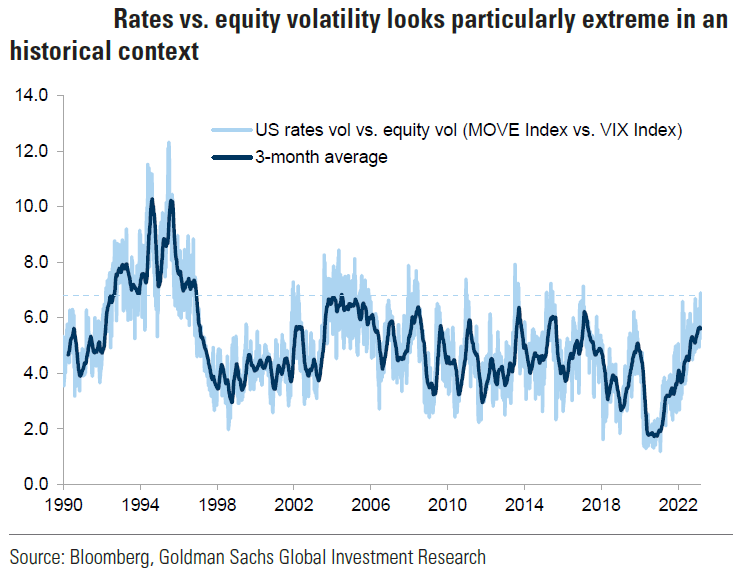
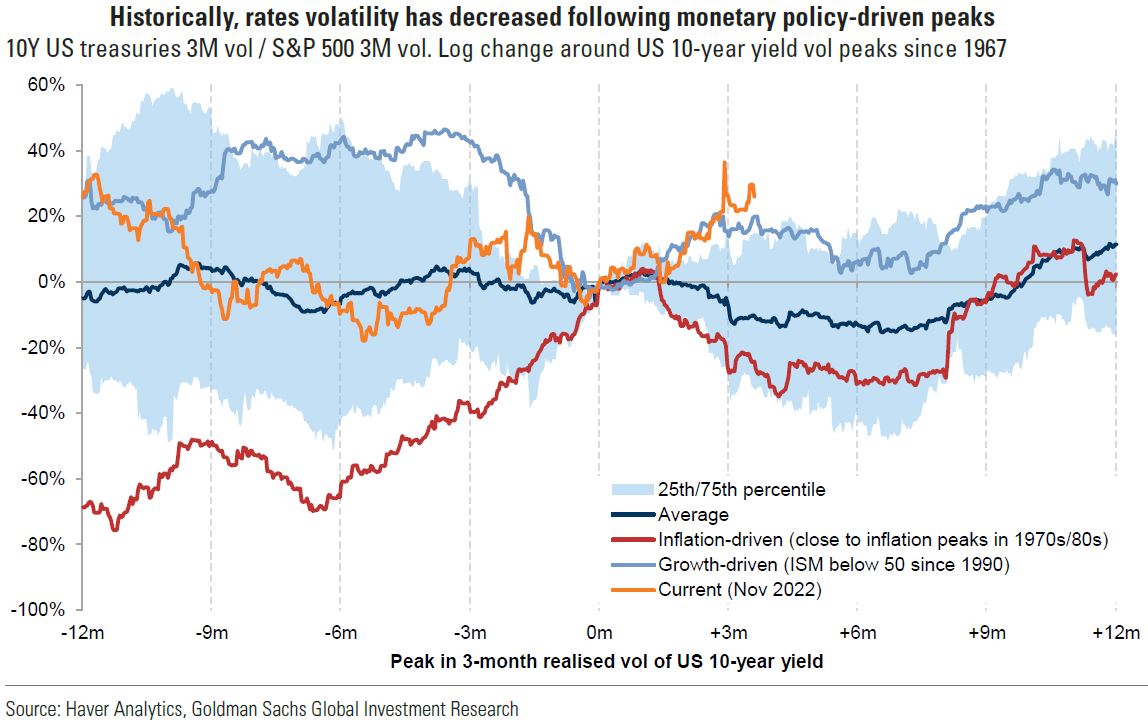
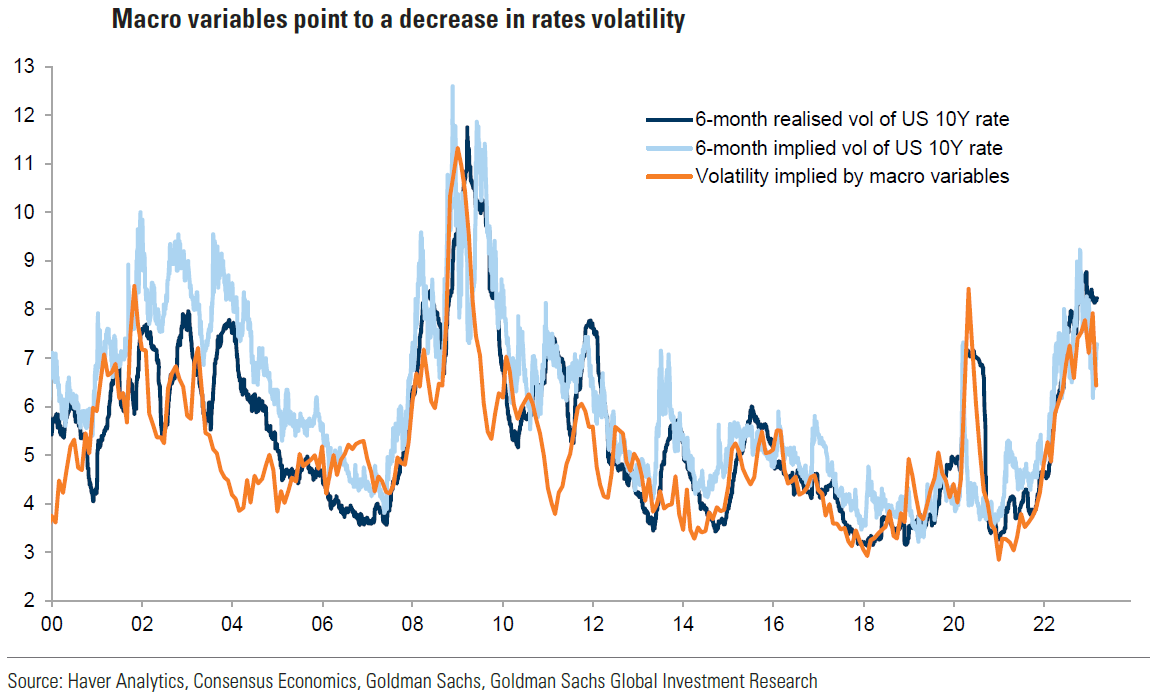
Source: Goldman Sachs, Global Markets Daily: Sticky Rates Volatility and Asset Allocation Implications (Ferrario/Mueller-Glissmann) (3-9-2023)
Definitions:
Fed Funds Terminal Rate – The terminal rate is defined as the peak spot where the benchmark interest rate, the federal funds rate, will come to rest before the central bank begins trimming it back.
Federal Open Market Committee (FOMC) – The Federal Open Market Committee (FOMC) is the branch of the Federal Reserve System that determines the direction of monetary policy specifically by directing open market operations. The committee is made up of 12 members: the seven members of the Board of Governors; the president of the Federal Reserve Bank of New York; and four of the remaining 11 Reserve Bank presidents on a rotating basis.
Federal Funds Rate – The term federal funds rate refers to the target interest rate set by the Federal Open Market Committee. This target is the rate at which commercial banks borrow and lend their excess reserves to each other overnight.
Fed Dot Plot – The Fed dot plot is published quarterly as a chart showing where each of the 12 members of the FOMC expect the federal funds rate to be for each of the next three years and the long term.
Job Openings and Labor Turnover Survey (JOLTS) – The job openings and labor turnover survey are a monthly report by the Bureau of Labor Statistics (BLS) of the U.S. Department of Labor counting job vacancies and separations, including the number of workers voluntarily quitting employment.
Net Interest Income (NII) – Net interest income reflects the difference between the revenue generated from a bank’s interest-bearing assets and the expenses associated with paying its interest-bearing liabilities. The type of assets earning interest for the bank can range from mortgages to auto, personal, and commercial real estate loans.
The Manheim Used Vehicle Value Index – This index measures the prices car dealerships pay for used cars at auctions. The prices are adjusted for seasonal factors but typically offer insight into what dealerships pay for the used cars they sell. Cox Automotive—the company behind Autotrader and Kelley Blue Book—publishes the index and updates the data monthly.
Nonfarm Payrolls – Nonfarm payrolls is the measure of the number of workers in the U.S. excluding farm workers and workers in a handful of other job classifications. The nonfarm payrolls classification excludes farm workers as well as some government workers, private households, proprietors, and non-profit employees.
Inverted Yield Curve – An inverted yield curve describes the unusual drop of yields on longer-term debt below yields on short-term debt of the same credit quality. Sometimes referred to as a negative yield curve, the inverted curve has proven in the past to be a relatively reliable lead indicator of a recession.
Job Openings – JOLTS defines Job Openings as all positions that are open (not filled) on the last business day of the month.
Initial Unemployment Insurance Claims – Initial claims are new jobless claims filed by U.S. workers seeking unemployment compensation, included in the unemployment insurance weekly claims report.
Continuing Claims – Continuing claims track the number of U.S. residents filing for ongoing unemployment benefits in a given week. Continuing claims measure ongoing unemployment benefits, which is in contrast to initial claims, which track new filings for benefits.
Quit Rate – The quit rate refers to employees who leave companies of their own accord as opposed to team members who are laid off or fired. The BLS tracks the number of people who quit their jobs each month in the thousands and issues a quit rate, or the number of quits as a percent of total employment.
Small Cap Stocks – Small cap stocks are shares of companies with total market capitalization in the range of about $300 million to $2 billion. Small-cap companies have the potential for high rates of growth, making them appealing investments, though their stocks may experience more volatility and pose higher risks to investors.
Large Cap Stocks – Large cap (sometimes called “big cap”) refers to a company with a market capitalization value of more than $10 billion. Large cap is a shortened version of the term “large market capitalization.”
Basis Points (bps) – A basis point is one hundredth of one percent, used chiefly in expressing differences of interest rates.
S&P 500 – The S&P 500 is a total return index that reflects both changes in the prices of stocks in the S&P 500 Index as well as the reinvestment of the dividend income from its underlying stocks.
IMPORTANT DISCLOSURES
The views and opinions included in these materials belong to their author and do not necessarily reflect the views and opinions of NewEdge Capital Group, LLC.
This information is general in nature and has been prepared solely for informational and educational purposes and does not constitute an offer or a recommendation to buy or sell any particular security or to adopt any specific investment strategy.
NewEdge and its affiliates do not render advice on legal, tax and/or tax accounting matters. You should consult your personal tax and/or legal advisor to learn about any potential tax or other implications that may result from acting on a particular recommendation.
The trademarks and service marks contained herein are the property of their respective owners. Unless otherwise specifically indicated, all information with respect to any third party not affiliated with NewEdge has been provided by, and is the sole responsibility of, such third party and has not been independently verified by NewEdge, its affiliates or any other independent third party. No representation is given with respect to its accuracy or completeness, and such information and opinions may change without notice.
Investing involves risk, including possible loss of principal. Past performance is no guarantee of future results.
Any forward-looking statements or forecasts are based on assumptions and actual results are expected to vary from any such statements or forecasts. No assurance can be given that investment objectives or target returns will be achieved. Future returns may be higher or lower than the estimates presented herein.
An investment cannot be made directly in an index. Indices are unmanaged and have no fees or expenses. You can obtain information about many indices online at a variety of sources including: https://www.sec.gov/fast-answers/answersindiceshtm.html or http://www.nasdaq.com/reference/index-descriptions.aspx.
All data is subject to change without notice.
© 2024 NewEdge Capital Group, LLC


