

Weekly Summary: February 6 – 10
Key Observations:
- We thought that Federal Reserve (Fed) chair Powell maintained basically the views expressed at his press conference last week. But he did stress that the Fed would be more data dependent going forward. Depending on the incoming data, the Fed could raise the federal funds rate by more than is currently priced into financial markets. On February 8, The CME Group’s FedWatch suggested a 93.7% chance of another 25 basis points (bps) at the Fed’s next meeting and a 71.9% chance of another such hike at the Fed’s May meeting. We now agree.
- Given the many “surprises” that we have witnessed in regard to the January economic data that we have analyzed, we are reluctant to forecast the U.S. CPI data that will be revealed next week. It appears that “unusual” patterns could develop at the beginning of each year. Before this week’s trading, we thought that financial markets were pricing in a “benign” CPI print. It is more unclear after this week’s trading.
- It appears that “soft” data, such as business and consumer surveys have been generally more “downbeat” than the “hard” data – actual economic data. Recession and inflation concerns seem to influence responses to questions that can’t really be measured accurately. Powell has commented that as consumers’ inflation expectations come down, they are more likely to spend, thereby putting a “floor” under the U.S. economy.
- In our opinion, one of the most important questions to answer is what are the “lags” between tightening monetary policies and financial conditions tightening and their effects on the U.S. economy. Powell has acknowledged the uncertainty surrounding this topic. In general, we believe that the lags are shorter than many assume. But like most things, it depends. Being “data dependent” in determining policy remains a rather difficult task.
The Upshot: Our general investment approach remains the same as depicted in last week’s commentary. We maintain our preference for big cap quality stocks with good balance sheets, relatively stable cash flows with stable margins. Volatility across sectors continues to be supportive of a diversified global portfolio for long term investors. We expect volatility to continue across asset classes.
We believe that we have seen the lows in USD and the 10-year Treasury yield – at least in the short term. We suppose that a risk/reward analysis would no longer support “full” positions in selected equity positions. We would look to buy on downturns.
We trust that we have shown that there are many possible interpretations to incoming economic data.
“Don’t Stop the Music”
We thought that given the strong gains in U.S. equities YTD coming into this week that many investors could relate to Rihanna’s Song “Don’t Stop the Music” as they hoped that this powerful rally would continue. It was as if investors were asking the financial markets: “Do you know what you started? … I just can’t refuse it; Like the way you do this; Keep on rockin’ to it; Please don’t stop the, please don’t stop the music … Let’s escape into the music.” If only it were that easy. Unfortunately, the music could stop at any time. We continue to recommend a well-diversified global portfolio that could take advantage of the volatility in financial markets by trimming long positions after substantial gains and buying on substantial downturns. We hope that our song this week will entice you to see more of Rihanna during halftime at this Sunday’s Super Bowl. Through Thursday, this week had many reversals in equities, the U.S. dollar (USD) – as exemplified by the USD index DXY – and interest rates. Major U.S. equity indexes were lower, USD was slightly higher and interest rates were higher also with a more inverted two-to-10-year Treasury yield curve. On Wednesday, Treasury yields fell after a very successful 10-year Treasury auction that showed a very strong demand. Yields rose the next day following a much weaker show of demand at the 30-year Treasury auction. Volatility across asset classes was very evident. Uncertainty about financial markets and the economy seemed to be more pronounced this week relative to recent weeks. This uncertainty was due perhaps to the lack of any anticipated “market-moving” economic data this week. The next major announcement – January’s consumer price index (CPI) – will not occur until Tuesday next week. We anticipate that the release of retail sales data on Wednesday of next week also should be another significant data point. Since the Fed and other major central banks (CBs) appear to be more data dependent, significant incoming economic data could have an impact on the Fed’s monetary policies. As Fed chair Powell indicated, “we’re going to react to the data.”
Powell’s Interview
Many expected that Powell’s Tuesday interview by the co-founder of Carlyle Group Inc. (Carlyle) David Rubenstein at the Economic Club of Washington, D.C. would be the highlight of this week. Powell was a partner at Carlyle between 1997 and 2005. In general, we thought that Powell did not “push back” on the financial markets’ mostly dovish interpretation of his press conference last week. We interpreted Powell’s comments to indicate that the Fed will be increasingly “data dependent” in its monetary policies. Powell readily acknowledged his surprise at the robust U.S. nonfarm payroll announced last Friday. But he also observed that financial conditions had already tightened since that report. As indicated at last week’s Fed meeting, “ongoing rate increases” will be “appropriate.” If economic data continues to come in “strong,” the Fed would raise rates accordingly. Powell stressed that, although disinflation has begun, we need to be “patient” since there is still “a long way to go.” Powell was worried most about services inflation – excluding housing services. Furthermore, Powell said that he expected to see housing-related disinflation in the second half of 2023. He observed that the goods sector, which represents approximately 25% of the U.S. economy, showed the clearest signs of “disinflation” to date. Although Powell expected the “process” to be “bumpy,” he expected to see “significant” progress on getting down inflation this year. Powell also thought that we likely will see a softening of the labor market. We were encouraged to hear Powell say that this cycle might be different than past cycles and, therefore, could be hard to predict. We took this as an indication that Powell has an “open mind” as to the Fed’s future policy determinations. Powell admitted that if we continue to get strong economic data, “we may have to raise rates more than is currently priced in.” Powell did not appear concerned that financial markets were pricing in a more “benign” view of inflation than the Fed’s view. Additionally, Powell said that this was merely a “difference in perspective.”
Fedspeak
In addition to Powell, many other regional Fed presidents and Fed governors expressed their views this week. At present, very few Fed speakers (Fedspeak) changed their terminal federal funds targets due to last week’s robust nonfarm payrolls. But many seemed more inclined to keep “restrictive” interest rate levels for longer and indicated that, depending on oncoming data, the terminal funds rate could be higher than currently forecast. New York Fed president John Williams stated that the peak terminal rates envisioned by the Fed participants at their December meeting were still a “reasonable” or a “good” guide to future Fed rate hikes, and that the current targeted federal funds rate range of 4.5% to 4.75% was “barely into restrictive territory.” Williams went on to say that Fed policy might need to be at restrictive levels for “years” to get inflation down to the Fed’s target of 2%. To date, most Fed speakers have been more vague in regard to the length of time that the Fed should maintain a federal funds rate at “restrictive” levels. Most have chosen to say that restrictive levels should be maintained for “some time.” Atlanta Fed president Raphael Bostic thought that subsequent to last Friday’s strong employment report, a higher peak federal funds rate was now “on the table.” He added, “if stronger-than-expected economy persists, … it’ll probably mean we have to do a little more work.” Fed governor Christopher Waller was concerned that a robust employment report – such as that reported last Friday – could fuel consumer spending that would maintain upward pressure on inflation. This could result in a higher terminal rate than currently anticipated. Waller stated that the fight against inflation “might be a long fight, with interest rates higher for longer than some are currently expecting. But I will not hesitate to do what is needed to get my job done.” Since Waller saw no sign of a “quick” decline in inflation, he was “prepared for a long fight.” Fed governor Lisa Cook reiterated that Fed officials were committed to curbing inflation and that further tightening was warranted. “We are not done raising interest rates, and we will need to keep interest rates sufficiently restrictive. Moving in small steps will give us time to evaluate the effects of our fast actions on the economy.” Lisa Cook appeared to have a more sanguine view as she thought that a strong job market coupled with moderating wage growth increased the hopes for a “soft landing.” She therefore thought that getting the inflation rate down to 2% “can be accomplished without a large increase in unemployment.” Minneapolis Fed president Neel Kashkari maintained his own target terminal federal funds rate of 5.4% – or even higher if the data call for it. Kashkari focused on wage growth, thinking that wage growth close to 3% would be more consistent with a 2% rate of inflation. Other economists think that a 3.5% wage growth would be sufficiently low.
CPI Variables – Next Week
Given that the Fed is now more data dependent, forecasting data like next week’s CPI will become even more critical in positioning investments. As always, we will try to decipher what’s priced into financial markets so as to help us formulate a proper risk-and-reward analysis. We already have witnessed unexpected large swings in January data that have been due at least in part to seasonal adjustments – such U.S. nonfarm payrolls last week. The Institute of Supply Management (ISM) services Purchasing Managers’ Index (PMI) in the U.S. has shown an unexpectedly large downturn in December before an unexpectedly large rebound in January. Although our “guess” on next week’s CPI is just that, we still maintain our conviction that the U.S. CPI will be in a sustainable “general” downward trajectory. For many months now, the decrease in used vehicle prices has helped lower the CPI. But the latest Manheim used car index – wholesale prices – rose 2.5% month-over-month (m/m) in January and was 12.8% lower year-over-year (y/y). This was the first month-over-month increase since last May. Before seasonal adjustments, the Manheim index was 1.5% higher m/m and 11.0% lower y/y. According to Cox Automotive (Cox), stronger-than-expected demand for used vehicles in January resulted in the largest increase in wholesale values since late 2021. In spite of the unexpected rise in used vehicle prices in January, Cox predicted for all of 2023 a 4.3% decrease compared to 2022. According to the U.S. Bureau of Labor Statistics (BLS), services – excluding energy – accounted for about 57.5% of CPI in November 2022. Included in the services component, shelter accounted for almost 33% of total CPI. It is now well accepted that the more up-to-date shelter costs, which show weaker rents, lag the “official” statistics of the CPI data. The expected lag time is uncertain. Gasoline prices are mostly higher in January as well. Monthly variations can be somewhat unpredictable.
Seasonal Adjustments
We have pointed out frequently that seasonal adjustments have led to surprising results since the beginning of the pandemic. In last week’s commentary, we surmised that the labor market might be less tight than it appears. In particular, we speculated that the unexpectedly robust U.S. January nonfarm payrolls increase of 517,000 could be at least partly due to seasonal adjustments. On February 8, J.P. Morgan (JPM) appeared to agree with our assessment. Before any seasonal adjustment, 2.5 million jobs were lost in January. “So the strength in the January data did not occur because of strong net hiring … but because job losses were not as large as normal around the start of the year – perhaps as firms are reluctant to let go of workers given perceived difficulties in eventual rehiring due to limited labor supply.” January is usually the weakest month for underlying employment and the seasonal adjustments are meant to correct for that.
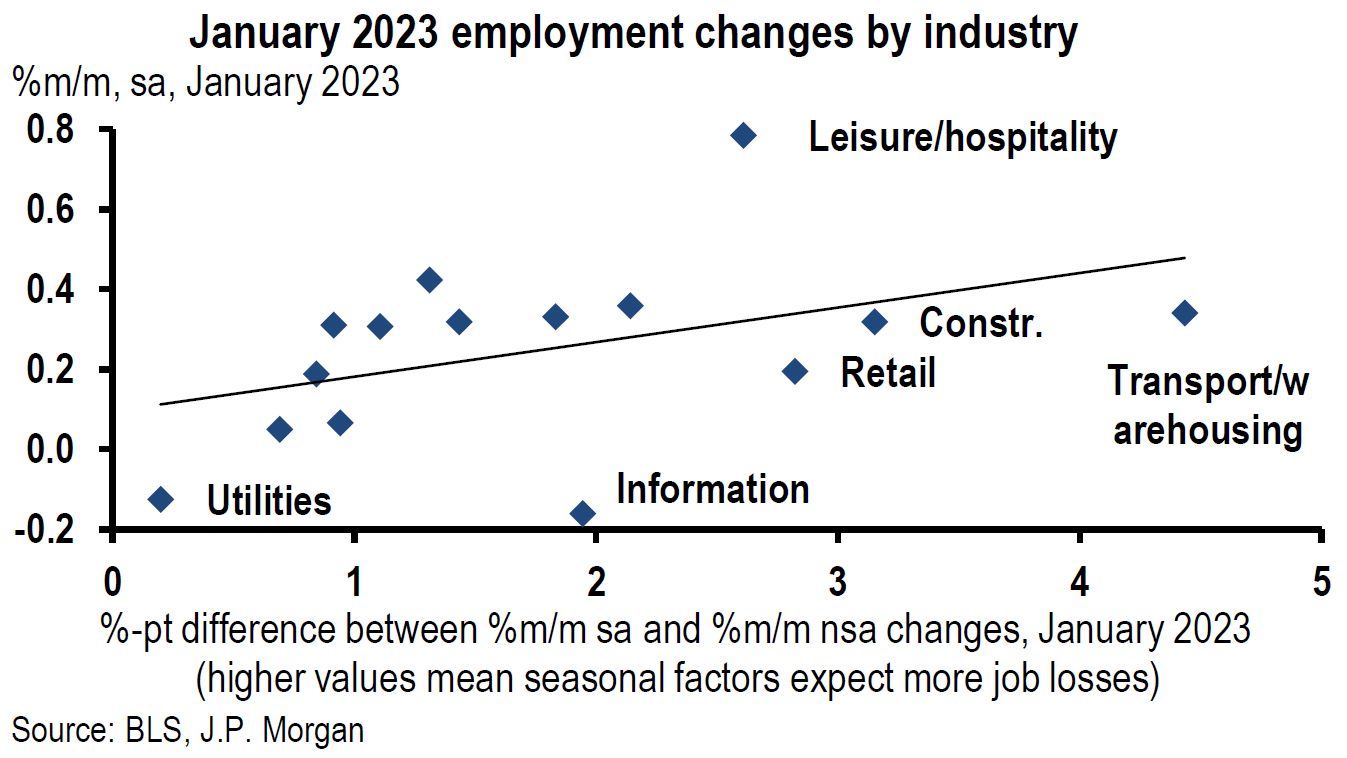
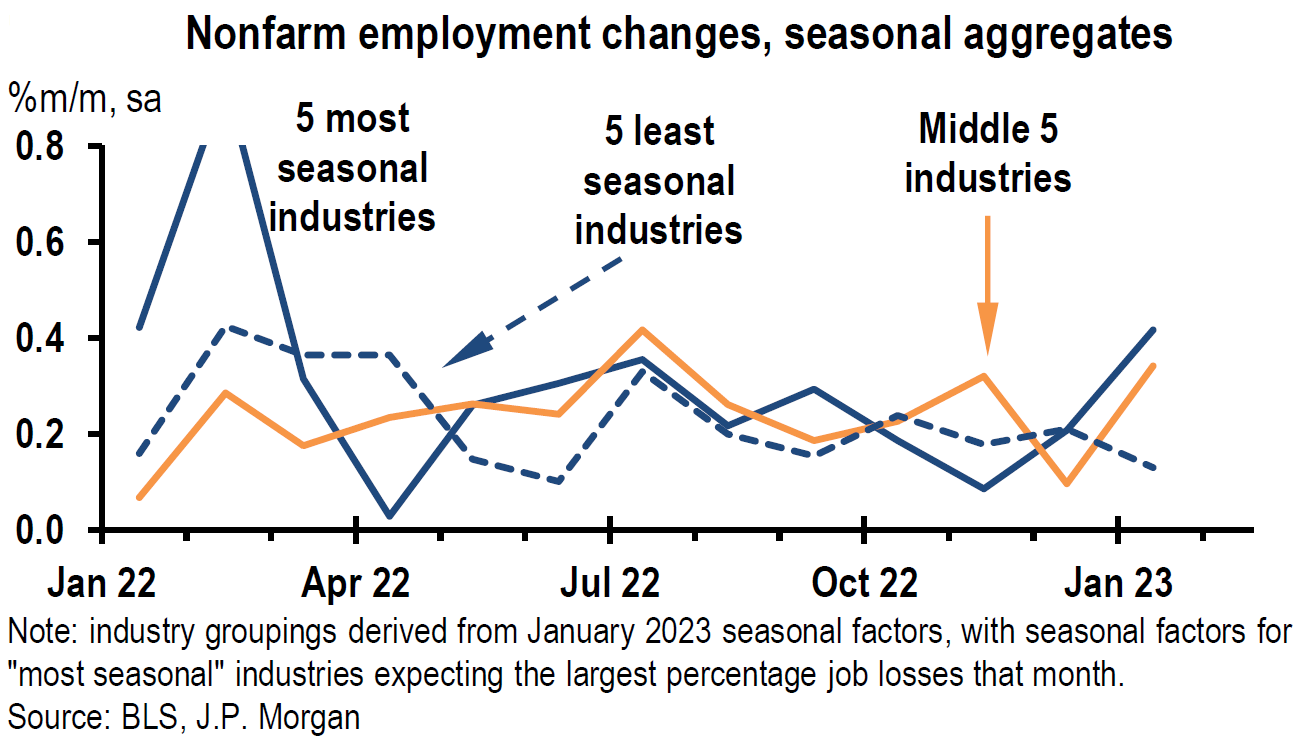
Source: Focus: JP Morgan, Seasonal support for January job gain (2-8-2023)
Surveys (“Soft” Data) Versus “Hard” Data (Mortgage Applications as an Example)
Fed’s Senior Loan Officer Opinion Survey (SLOOS) – Q4
The respondents to this survey indicated in general that lending standards were tightened regarding loans to businesses and that they observed weaker demand for commercial and industrial (C&I) loans for large, medium and small-sized firms. Tighter standards and weaker demand were also reported for commercial real estate (CRE) categories. Lending standards were tightened and demand weakened, on balance, to households for credit cards, auto and other consumer loans, as well as home equity lines of credit. Credit standards on mortgage loans were also tightened. According to the Q4 SLOOS, many banks reported that they expected “lending standards to tighten, demand to weaken and for loan quality to deteriorate across all loan types.”
U.S. Consumer Credit
The Fed’s consumer credit report released this week showed that consumer credit increased $11.65 billion in December, compared to a $27.96 billion increase in November and versus an expected $25 billion increase. According to the Fed, “in 2022, consumer credit increased 7.8%, with revolving and nonrevolving credit increasing 14.8% and 5.6%, respectively. During the fourth quarter, consumer credit increased at a seasonally adjusted annual rate of 6.5%, while in December it increased at a seasonally adjusted annual rate of 2.9%.” December’s rate was a notable decline from November’s increase of 7.1%. Revolving credit, mostly credit cards, increased at an annual rate of 7.3% compared to November’s 16.9% rise. Nonrevolving credit such as auto and student loans dropped to a 1.5% increase in December from a 3.9% increase in November. The slowdown in consumer credit increases appears to reflect the trends as reflected in the above SLOOS report.
U.S. Mortgage Applications
Data from Mortgage Bankers Association (MBA) released this week showed a substantial rebound in mortgage applications (including refinancing mortgages) for the week ended February 3 when compared to the prior week. The prior week saw a 9.0% decrease week-over-week (w/w). Mortgage applications to purchase a home increased 3.1% w/w after a decrease of 10.1% in the prior week. Overall, purchase activity was 37% lower than the same week one year ago. The 30-year fixed rate mortgage rate was down to 6.18% from the prior week’s rate of 6.19%. This compares to the recent high of 7.16% in October 2022. The average loan size on purchase applications increased to $428,600 – the largest average since May 2022. We assume that many first-time buyers continued to have affordability issues. Joel Kan, an MBA economist, thought that the “purchase activity that was put on hold last year due to the quick run-up in rates is gradually coming back as rates ease and housing demand remains strong, driven by supportive demographics and ongoing strength in the job market.” Freddie Mac this week also reported relatively low mortgage rates – 6.12%, up from 6.09% the prior week. According to Realtor.com, the median January listing price was $400,000, which was bout 81% higher than a year ago. But lower than June’s peak of $449,000.
We thought that the latest Fed credit report mostly corroborated the SLOOS but that the latest mortgage data showed perhaps a more resilient U.S. consumer.
“Soft” Data has a Tendency to be More Downbeat
We have noticed during our weekly research that many surveys (“soft” data) have a tendency to be more pessimistic than the actual economic data (“hard” data). On February 9, Goldman Sachs (Goldman) made a similar observation. Goldman found that economic “activity data broadly suggest that growth remains positive even while business and consumer surveys point to a contraction in many DM economies.” Goldman found that the divergence between the “soft” and “hard” data was now unusually large, above the 90th percentile. Perhaps the more generally negative survey data is attributable to recession and/or inflation fears. Even Powell commented this week that he expects a pick-up in consumer spending as consumers’ inflation fears dissipate. In contrast, new orders data has tended to be more positive. Goldman also observed that “business surveys may overstate weakness when goods price inflation is slowing.” After adjusting for sentient and nominal biases, Goldman seems convinced that the surveys will tend to converge eventually with the more positive “hard” data. Goldman found that “a soft growth signal from survey data generally does not foreshadow an economic downturn.” We agree, and when we discover great divergences between surveys and actual economic data, we have a very strong preference for the actual economic data. Goldman also found that when survey questions were about measurable data such as output and demand levels, answers were somewhat more positive when compared to less measurable questions based more on sentiment and future business activity.
“Lagging” Effects from Tightening Monetary Policy and Tighter Financial Conditions – It Depends
We believe that one of the most difficult and important questions we face in analyzing and forecasting economic trends and financial markets is a determination in the “lags” from tightening monetary policies and tighter financial conditions. Powell has admitted that there remains great uncertainty around these issues. We surmise that this is one of the reasons for the Fed downshifting the pace and magnitude of contemplated future hikes in the federal funds rate and to become more “data dependent.” We first highlighted this issue in our December 23 commentary. ‘On December 18, Goldman postulated that changes in financial conditions might have a lag time of only two quarters and that a change in monetary policy might even have an almost simultaneous change in financial conditions.” Because most of financial condition tightening occurred in 1H 2022, Goldman thought that most of the drag on GDP growth peaked at the end of 2022 and was fading now. Goldman also thought that the effects on the labor market, wages and inflation were probably more delayed. Financial conditions do not wait for actual monetary tightening. Instead, they anticipate such future actions and adjust almost immediately.
On January 30, JPM summarized the divergent views on the uncertainty of “lagging” effects of tightening monetary policy and financial conditions on economic data. JPM characterized “conventional wisdom” on this topic as “Fed action [taking] 6-12 months to filter to the real economy.” The alternative view sees the “combination of globalization and social media [having] lead to quicker transmission evidenced by mortgage rates moving higher – 100 bps before the first hike last March. The accelerated view of transmission could n mean that the real economy lags the Fed by maybe 6-12 weeks.” If this latter view is more accurate, it is our opinion that the U.S. economy would be much more likely to avoid a recession in 2023 and to have a less downturn in earnings. But the “dark side” of this scenario is that this could lead to the Fed “overtightening” if economic growth accelerates without an inflation slowdown. Our own view is more tilted to this latter view but with the caveat that different companies and industries will feel the effects over different timelines. Most obvious on this point is the housing market quick downturn due to its extreme sensitivity to interest rates. Our view is more nuanced than either of these extreme views. Unfortunately, we don’t think that there is any “blanket” timeframe where we could ascribe to the whole U.S. economy. It really just depends on the individual industry or company. This makes both our job and the Fed’s job much more difficult and by necessity more “data dependent.”
Since we maintain our belief that U.S. inflation will continue to dissipate more quickly than many expect before “stalling” at roughly the 3.5% to 4.0% level (our “guess”), we maintain our forecast that the U.S. will either avoid a recession in 2023, or only suffer a mild one. If inflation continues a generally fast dropping inflation trend, we are hopeful that the Fed will not “overtighten.” We don’t expect inflation to drop in a straight line. We expect to see a “bumpy” ride. Given the many “surprise” data points announced for the month of January, we remain reluctant to predict a CPI January level for the U.S. that will be revealed next Tuesday. Before this week’s downturn in U.S. equities and rise in interest rates, we thought that the financial markets had priced in a “benign” CPI print. It is much more unclear what’s presently priced in. Before the U.S. equity markets “opened” last Thursday, we recommended selective selling of stocks with very high Price/Earnings (P/E) ratios that had appreciated substantially YTD. We continue to stress that stock selectivity in this current financial market environment is of paramount importance.
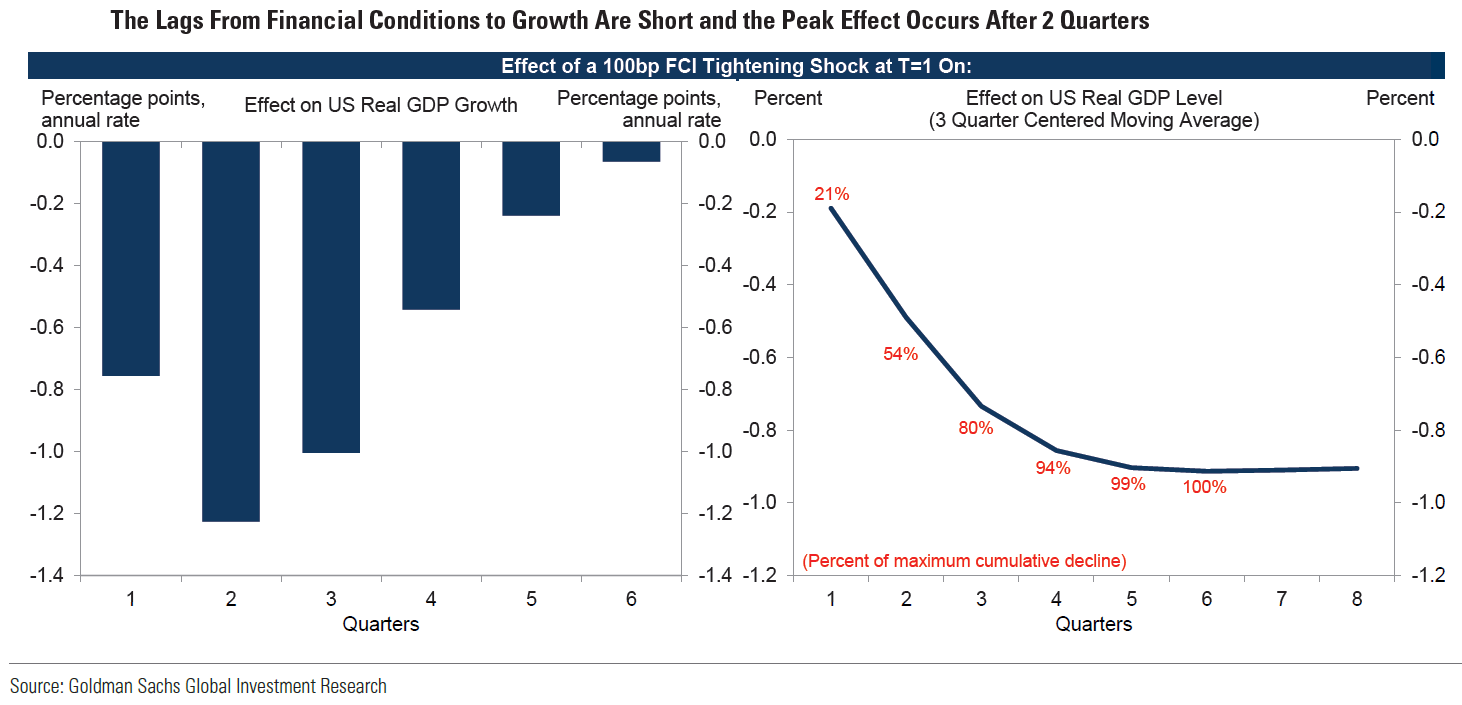
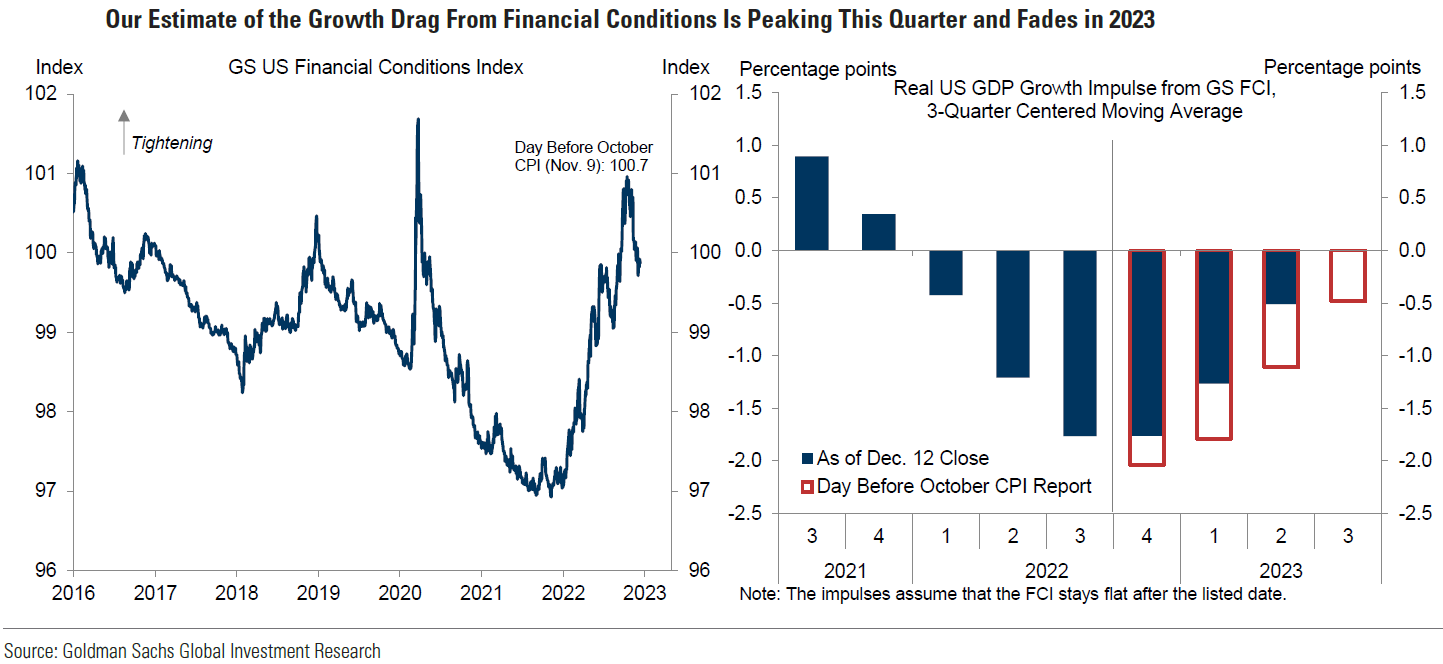
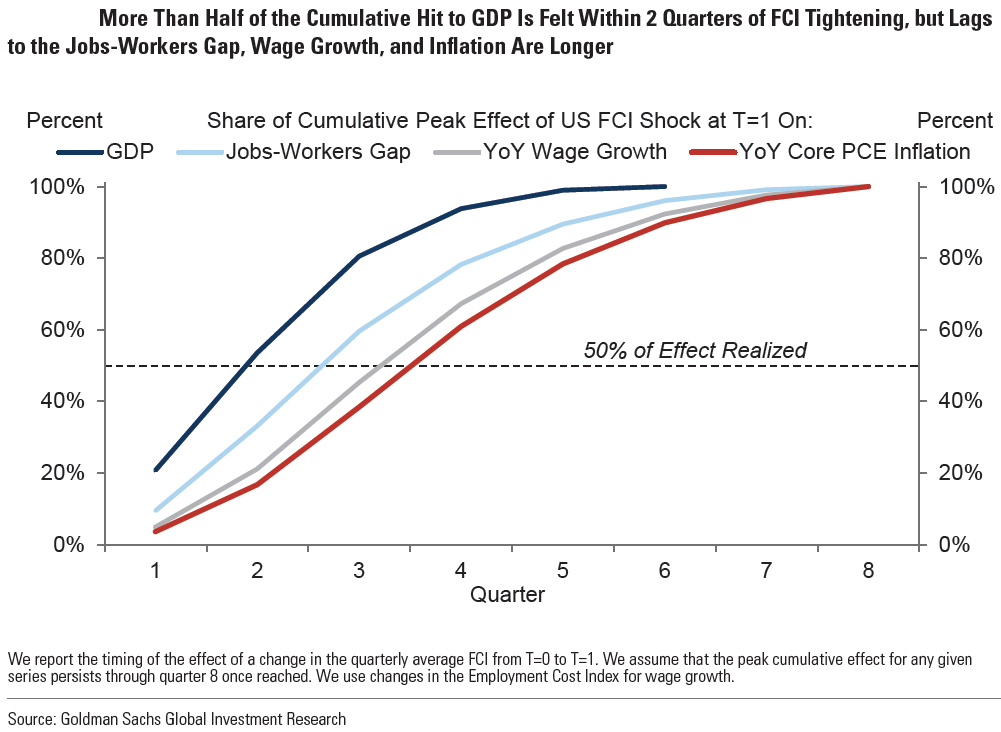
Source: Goldman Sachs, Monetary Policy Affects Growth with a Short Lag (Briggs) (12-18-2022)
Different Potential Interpretations of Yield Curve Inversions
Treasury yields have risen this week and through Thursday, the two-to-10-year Treasury yield curve had inverted to over 80 basis points before steepening on Friday to approximate the yield inversion at last week’s close. We, along with many financial market participants, have been concerned that such an inversion could be a precursor to a recession. On February 9, JPM offered another possible explanation for a very inverted yield curve. JPM noted that “inflation-indexed markets are apparently expecting a very sharp slowing in inflation, very soon.” According to JPM, “optimal monetary policy would be cutting interest rates, even without a large downturn in economic activity. Expectations of those cuts may be driving the inversion of the yield curve.” Powell seemed to substantiate this line of reasoning during his press conference last week, when he opined that he could cut rates if inflation came down much more quickly than the Fed expected – even without a substantial slowing of economic activity. We chose to leave the interpretation of the current yield curve inversion as an open question.
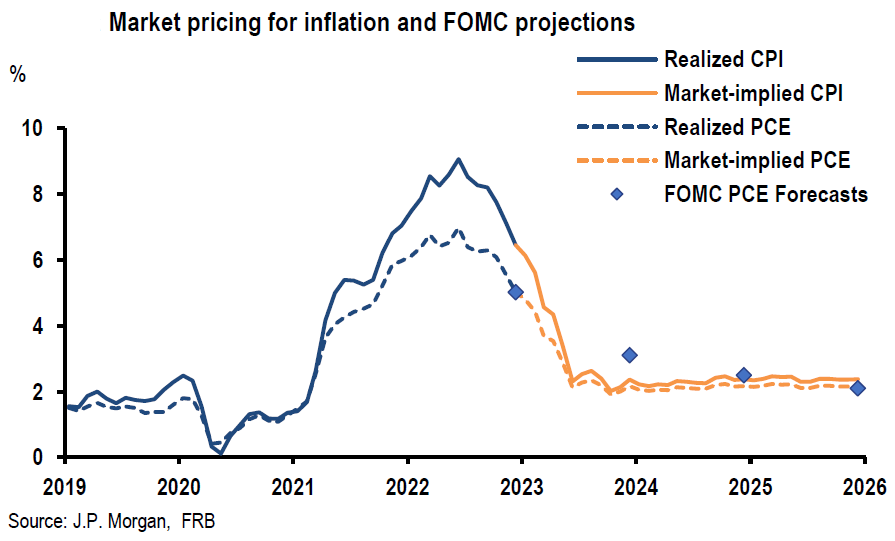
Source: JP Morgan, US: Are rates markets really expecting a recession? (2-9-2023)
BOJ’s Yield Curve Control Policy – Revisited – Potential Impact on Treasury Yields
On Friday, the Japanese yen fluctuated by well over 1% against USD on reports that Japan’s government was likely to appoint Kazuo Ueda, an academic and a former member of the Bank of Japan’s (BOJ) policy board, to replace BOJ’s outgoing governor Haruhiko Kuroda. Financial markets initially viewed Ueda as hawkish and therefore as likely to modify the BOJ’s dovish yield curve control (YCC) policy. The yen initially appreciated sharply against the USD until Ueda divulged on Nippon TV that the BOJ’s current policy was appropriate and should continue. In our December 23 weekly, we focused on the effects of a modification of the YCC policy. We thought at the time that the rumors of such a modification “precipitated an increase in global interest rates, including in U.S. Treasuries.” We still believe that such a change would help propel global interest rates higher. It appears that we might have seen the lows in USD and 10-year Treasury yields – at least in the short term.
Bottom Line
For the time being we are maintaining our basic investment approach as expressed in last week’s commentary. We continue to prefer high quality big cap stocks that offer good balance sheets, as well as relatively stable cash flows and profit margins. We prefer a very diversified global portfolio for long term investors.
We believe that we have shown that there are many possible interpretations to incoming economic data. Being “data dependent” in the current environment could be a rather difficult task. We now forecast that the Fed will raise the federal funds rate by 25 bps at its next two meetings. At this time, we do not expect the Fed to cut rates this year.
Definitions
Basis Points (bps) – A basis point is one hundredth of one percent, used chiefly in expressing differences of interest rates.
Inverted Yield Curve – An inverted yield curve describes the unusual drop of yields on longer-term debt below yields on short-term debt of the same credit quality. Sometimes referred to as a negative yield curve, the inverted curve has proven in the past to be a relatively reliable lead indicator of a recession.
CME FedWatch Tool – This tool acts as a barometer for the market’s expectation of potential changes to the fed funds target rate while assessing potential Fed movements around FOMC meetings.
Headline Consumer Price Index (Headline CPI) – Headline inflation is the raw inflation figure reported through the Consumer Price Index (CPI) that is released monthly by the Bureau of Labor Statistics (BLS). The CPI calculates the cost to purchase a fixed basket of goods to determine how much inflation is occurring in the broad economy. The CPI uses a base year and indexes the current year’s prices, according to the base year’s values.
Core Consumer Price Index (Core CPI) – Core inflation removes the CPI components that can exhibit large amounts of volatility from month to month, which can cause unwanted distortion to the headline figure. The most commonly removed factors are those relating to the costs of food and energy. Food prices can be affected by factors outside of those attributed to the economy, such as environmental shifts that cause issues in the growth of crops. Energy costs, such as oil production, can be affected by forces outside of traditional supply and demand, such as political dissent.
Senior Loan Officer Opinion Survey on Bank Lending Practices (SOSLP) – The Senior Loan Officer Opinion Survey on Bank Lending Practices is a survey the Federal Reserve conducts to gain insight into bank lending practices and conditions.
Yield Curve Control (YCC) – Yield Curve Control (YCC) is a monetary policy action whereby a central bank purchases variable amounts of government bonds or other financial assets in order to target interest rates at a certain level.
Federal Funds Rate – The term federal funds rate refers to the target interest rate set by the Federal Open Market Committee. This target is the rate at which commercial banks borrow and lend their excess reserves to each other overnight.
Fed Funds Terminal Rate – The terminal rate is defined as the peak spot where the benchmark interest rate, the federal funds rate, will come to rest before the central bank begins trimming it back.
Fedspeak – Fedspeak refers to speeches about monetary policy given by members of the U.S. Federal Reserve Board of Governors.
Financial Conditions – Financial conditions can be defined as the current state of financial variables that influence economic behavior and (thereby) the future state of the economy. In theory, such financial variables may include anything that characterizes the supply or demand of financial instruments relevant for economic activity.
U.S. Dollar Index (DXY) – The U.S. dollar index is a measure of the value of the U.S. dollar relative to a basket of foreign currencies.
IMPORTANT DISCLOSURES
The views and opinions included in these materials belong to their author and do not necessarily reflect the views and opinions of NewEdge Capital Group, LLC.
This information is general in nature and has been prepared solely for informational and educational purposes and does not constitute an offer or a recommendation to buy or sell any particular security or to adopt any specific investment strategy.
NewEdge and its affiliates do not render advice on legal, tax and/or tax accounting matters. You should consult your personal tax and/or legal advisor to learn about any potential tax or other implications that may result from acting on a particular recommendation.
The trademarks and service marks contained herein are the property of their respective owners. Unless otherwise specifically indicated, all information with respect to any third party not affiliated with NewEdge has been provided by, and is the sole responsibility of, such third party and has not been independently verified by NewEdge, its affiliates or any other independent third party. No representation is given with respect to its accuracy or completeness, and such information and opinions may change without notice.
Investing involves risk, including possible loss of principal. Past performance is no guarantee of future results.
Any forward-looking statements or forecasts are based on assumptions and actual results are expected to vary from any such statements or forecasts. No assurance can be given that investment objectives or target returns will be achieved. Future returns may be higher or lower than the estimates presented herein.
An investment cannot be made directly in an index. Indices are unmanaged and have no fees or expenses. You can obtain information about many indices online at a variety of sources including: https://www.sec.gov/fast-answers/answersindiceshtm.html or http://www.nasdaq.com/reference/index-descriptions.aspx.
All data is subject to change without notice.
© 2024 NewEdge Capital Group, LLC


