

Weekly Summary: August 22 – August 26, 2022
Key Observations:
- We postulate that the Federal Reserve (Fed) will continue to raise the federal funds rate and will only “pause” after achieving at least a level in a “restrictive” range as outlined in last week’s commentary. We maintain our forecast that the Fed will announce a 50-basis points (bps) federal funds rate hike in the September meeting, and follow that with 25-bps hikes in each of the November and December meetings. Our assumption of a slowing U.S. economy is a critical component of this forecast.
- We accept that the Fed will not “stop [hiking] ‘til [it gets] enough” of a slowdown in the rate of inflation. We imagine that the Fed also will show “patience” in assessing the impact of its policies given the lag effect of tighter financial conditions. The pace of the Fed’s monthly shrinkage of its balance sheet – quantitative tightening (QT) – will double in September. This is also a factor in our forecast of a 50-bps increase in the federal funds rate in September. Our conviction of a 50-bps hike in lieu of a 75 bps hike was lessened somewhat after Powell’s Friday Jackson Hole speech, when he clearly indicated that a 75 bps September hike was possible, but would be dependent on incoming economic data.
- We do not expect the Fed to cut rates for “quite some time.” Instead, we see that a pause in raising rates could last for “quite some time.”
- We interpreted the release of the economic data we analyzed this week as supportive of slowing economic growth rates in the U.S. and many foreign countries. This should help restrain demand and thereby help to rein in inflation rates.
The Upshot: Our general investment approach remains the same as depicted in last week’s commentary. U.S. interest rates continued to rise and the two-to-10-year yield curve generally steepened even as it remained inverted, much as we anticipated more than two weeks ago. Our preference for big-cap high-quality tech and growth stocks along with energy stocks continued to act as a hedge for one another. While the tech stocks were the tenth worst sector over the first three days this week, energy stocks rose more than 4% and were the only positive S&P 500 sector over those three days.
After Powell’s relatively “hawkish” Friday Jackson Hole speech, U.S. equities traded lower, interest rates generally rose, and the two-10-year yield curve flattened somewhat as it became more inverted. During Friday morning, the inversion was still less than that of early last week. We view the continued rise in the 10-year yield as problematic. As we stated in last week’s commentary: “We postulate that a rise in the 10-year yield has a greater negative affect on stock prices than the 2-year yield.” This is particularly true for “long-duration” stocks such as tech and growth stocks.
As depicted in our previous weekly summaries, we continue to view the Fed’s monetary stance as a “soft” pivot. This characterization assumes an extended pause in raising rates once the federal funds rate has reached a sufficiently restrictive level. However, it does not assume a cut in rates for the foreseeable future. In our opinion, a soft pivot should make a long term investor more “comfortable” in purchasing equities with a lessened chance of severe equity market downturns – absent a severe recession. We continue to foresee financial market volatility and we maintain our conviction that equities should be purchased only on market downturns. We surmise that selective stock picking will continue to play a critical role in outperformance.
We accept that low liquidity and one-sided positioning will continue to play a significant role in financial markets as these factors probably will exacerbate market volatility. As our “oil example” described below hopefully demonstrates, such factors may often affect the “real’ economy.
Fed Monetary Policy – “Don’t Stop ‘til You Get Enough”
We believe that at this point in their fight to rein in elevated rates of inflation, the best advice for the Fed was perhaps expressed best in Michael Jackson’s song “Don’t Stop ‘til You Get Enough” of a decrease in inflationary pressures. The Fed should “keep on, with the force, don’t stop.” In the context of this discussion, we interpret the “force” to be the Fed’s restrictive monetary policies of higher federal funds rates and shrinking of its balance sheet – quantitative tightening (QT). We suppose that the Fed is already on this path and doesn’t need anyone else’s advice at this point. We understand that the Fed will keep tightening until they get the federal funds rate at least into “restrictive” territory that the Fed believes is “required,” as outlined in last week’s commentary. We then anticipate the Fed to “pause” once it achieves a restrictive federal funds rate, or slightly above that rate. “We do not foresee the Fed cutting rates for ‘quite some time.’ A slowing U.S. economy is a critical component of this characterization” – a “soft” Fed pivot. We do not see Fed chair Powell changing substantially his stance on monetary policy during his Friday presentation at the Jackson Hole conference.
Some Highlights of Powell’s Jackson Hole Friday Speech
After listening to Powell’s relatively “hawkish” speech, we believe that our choice of this week’s song was even more appropriate. Powell was resolute in his determination to rein in inflation. It is the Fed’s “overarching focus” to bring inflation down to the 2% level. The Fed’s responsibility to deliver price stability is “unconditional.” Price stability is the “bedrock” of the U.S. economy. This would require “some time” and will take a “sustained” period of below trend growth. Powell acknowledged that higher interest rates would cause some “pain” for households and businesses. However, failure to restore price stability would mean “far greater pain” at a later time. Powell also focused on the tight labor market that was “clearly out of balance” and the need to bring it back into a better-balanced state. Powell agreed with our assessment that the U.S. economy is “clearly slowing.” Powell hoped to avoid a very lengthy period of “restrictive” policy by acting now, even as he saw the need for a restrictive policy for “some time.” Powell also acknowledged that it would likely be “appropriate” to slow the rate of interest rate increases at some point.
Slowing Global Economic Growth and Interpretation of Yield Curve
This week’s economic data releases mostly supported our previously presented data of a slowing U.S. economy, as well as the economies of many foreign countries. This week’s economic data included additional Fed Regional Banks’ surveys, Manufacturing, Services and Composite Purchasing Managers Indexes (PMIs) and U.S. housing data. Treasury yields continued to increase this week, with the 10-year yield rising more than the two-year yield as this part of the yield curve continued to steepen even as it remained inverted. We view this trend “as an indication that the Fed’s ‘terminal’ federal funds rate may be less harmful to the U.S. economy than previously thought. It remains our contention that a slowing U.S. economy will do a significant part of the Fed’s ‘work’ so that the terminal rate [might] be contained under 4%.” If our analysis is correct, the downside for U.S. equities should be somewhat contained, which would enhance the risk/reward probabilities for purchasing selected securities at various price points. We maintain this stance after analyzing this week’s economic data. Our preference for big-cap quality tech and growth shares alongside high-quality energy shares appears to continue to act as an effective hedge for each other.
Low Liquidity Distorting Energy Markets Could Have “Real” Consequences
We have documented in our previous commentaries how low liquidity in many financial markets and one-sided positioning has exacerbated volatility. Many analysts have observed that the volatility in fixed income markets has spilled over often into other markets. Saudi Arabia’s energy minister, Prince Abdulaziz bin Salman, took notice of these factors on Monday in regard to crude oil prices. He believed the futures prices for crude oil often did not reflect the fundamentals of the supply–demand dynamics of the tight physical oil markets. He described the oil futures markets as having fallen into “a self-perpetuating vicious circle of very thin liquidity and extreme volatility.” According to the Prince, these circumstances made the cost of managing risks for market participants “prohibitive.” This also detracted from the market’s focus on the issue of limited spare capacity of oil production. The Prince then suggested that a solution to these issues might require a cut in the production of oil when OPEC+ meets next month. The Prince’s comments sparked a recovery in the price of crude oil that day. The price recovery continued the next day and produced gains of over 3.5% in crude prices, alongside substantial gains in many energy securities.
Weaker U.S. Housing Trends Continue
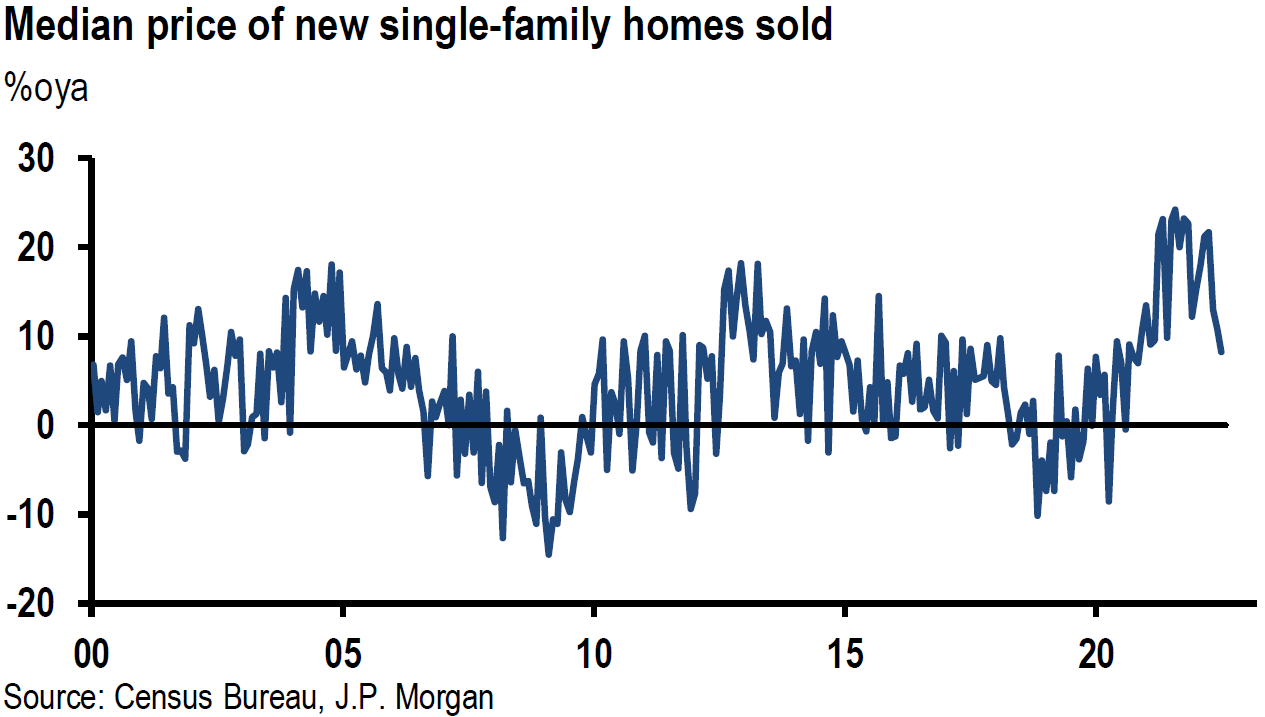
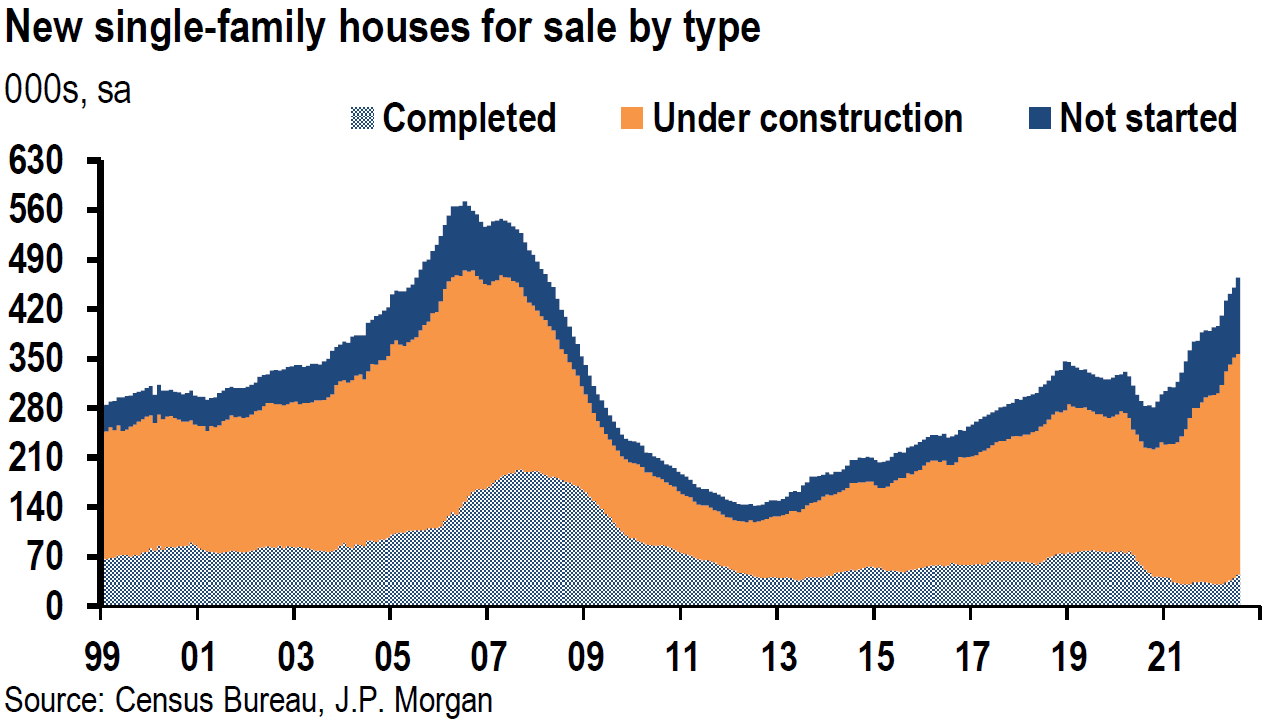
The U.S. housing data released this week continued to show weakening trends. Historically, this is one of the sectors that is most sensitive to higher interest rates. The higher 30-year fixed rate mortgage has clearly had a negative impact. U.S. new home sales dropped 12.6% month-over-month (m/m) from a revised 585,000 pace in June to a 511,000 annualized pace in July. July’s pace was the slowest since 2016. The year-over-year (y/y) decrease was 29.6%. The seasonally adjusted estimate of new houses for sale at July’s end was 464,000, which reflected a 10.9-month supply at the current sales rate. The increase in inventory levels appears to be affecting home prices as well. The July median home price appreciation was down to 8.2% y/y from a much higher 20% y/y appreciation reported a few months earlier when mortgage rates were lower. The average interest rate for a 30-year fixed rate mortgage was above 5% for all of July – about 5.65% for the week ending August 19. That was more than two percentage points higher than at the start of this year.
Since it factors into shelter costs, the housing trend is especially important in forecasting future rates of inflation. Shelter costs account for about one-third of Consumers Price Index (CPI) headline inflation and is considered generally as one of the most persistent components of core inflation. On August 22, J.P. Morgan (JPM) reported that shelter costs rose 0.5% m/m in July. JPM highlighted research from the Council of Economic Advisors, which showed that it has taken historically as long as sixteen months for weakness in housing markets to translate into lower shelter inflation. But, given that demand still exceeds housing supply, JPM thinks that the lags might be even longer in the present circumstances. Last week’s commentary noted the Fed’s recognition of the “lags associated with the transmission pf monetary policy.” But a number of participants at the Fed’s July meeting observed that a more rapid transmission of tightening monetary policy and more restrictive financial conditions happened more quickly in some cases. Timing the slowdown in shelter costs could be particularly difficult to assess. First, the lag effects of tighter financial conditions need to be determined for the housing market and then additional lags will need to be estimated on rental and owners equivalent rates. This is why the Fed must show some “patience” before it commits to a particular path of tightening. We anticipate that the Fed will slow the path of rate increases. At some point after this rate increase slowdown, a “pause” in the Fed hikes will be appropriate.
Mortgage applications were 1.2% lower for the week ended August 19 and 21% lower y/y. Applications were 2.3% lower the prior week. Pending home sales were 1.0% lower in July versus an expected decline of 2.3% m/m and a 22.5% decline y/y. June data were revised lower by 0.35 bps to -8.9% y/y. Pending home sales tend to lead existing home sales by one-to-two months.
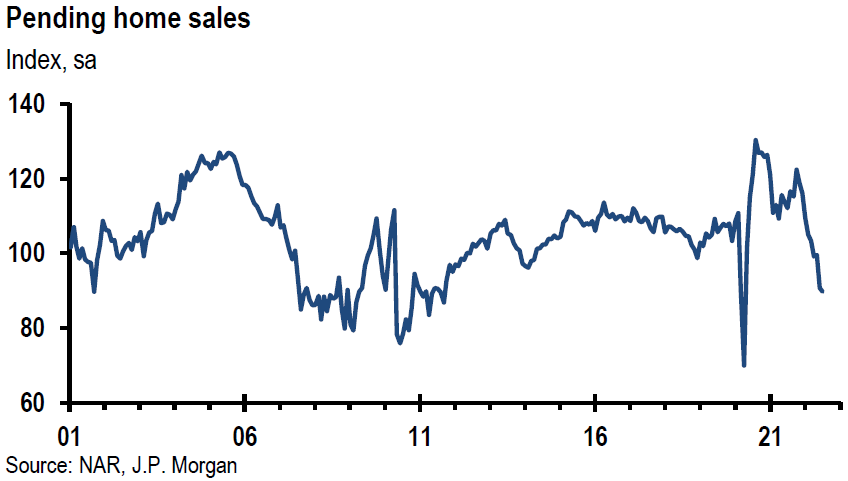
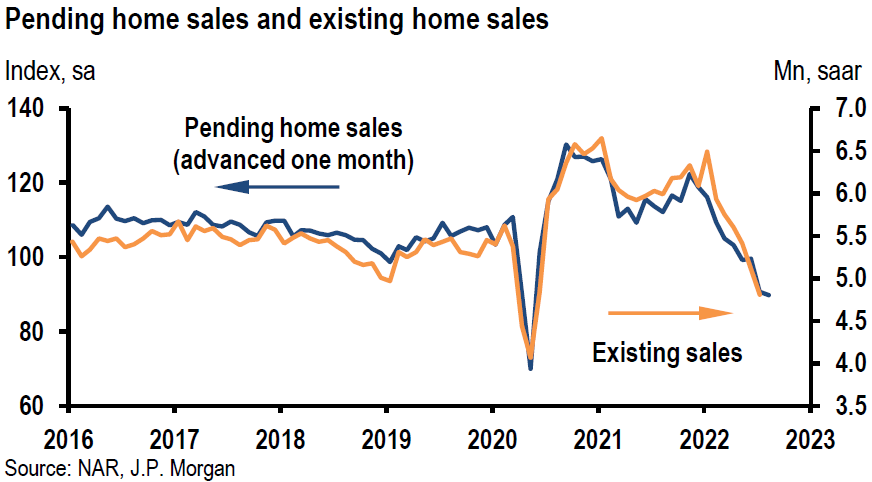
Source: JP Morgan, US: Pending home sales decline, but beat expectations (8-24-2022)
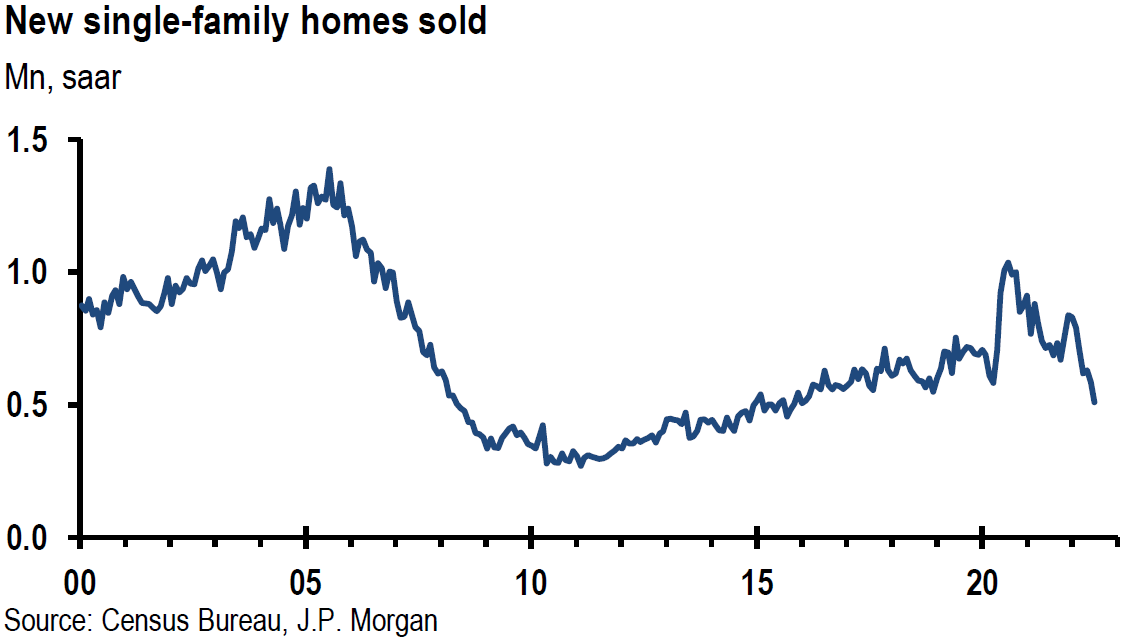
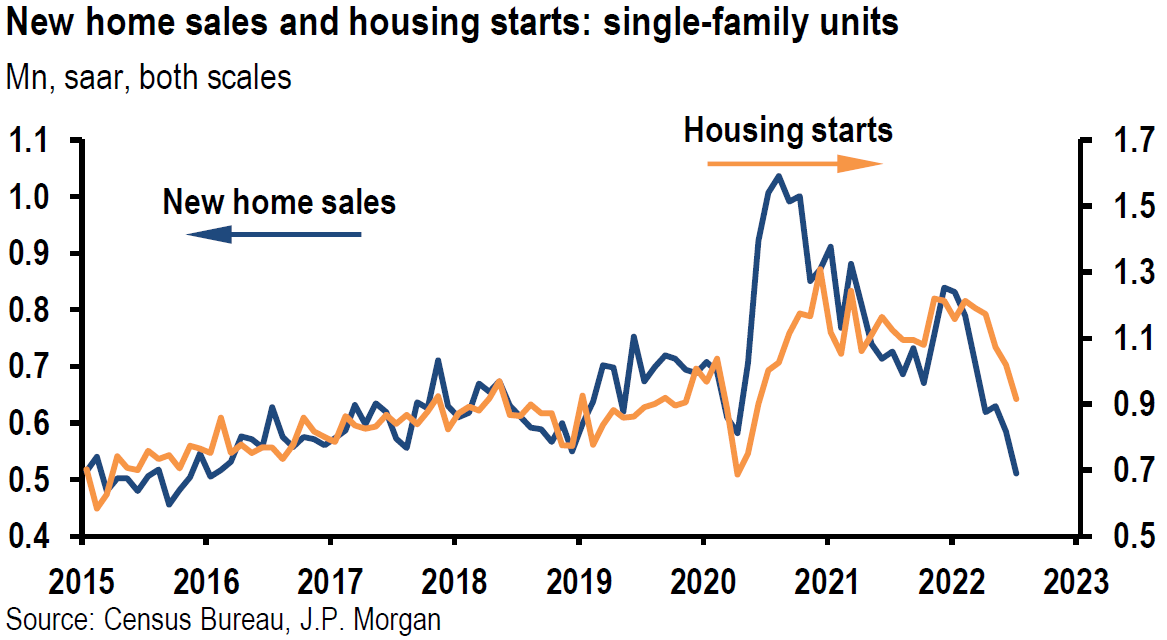
Source: JP Morgan, US: New home sales continue to drop off (8-23-2022)
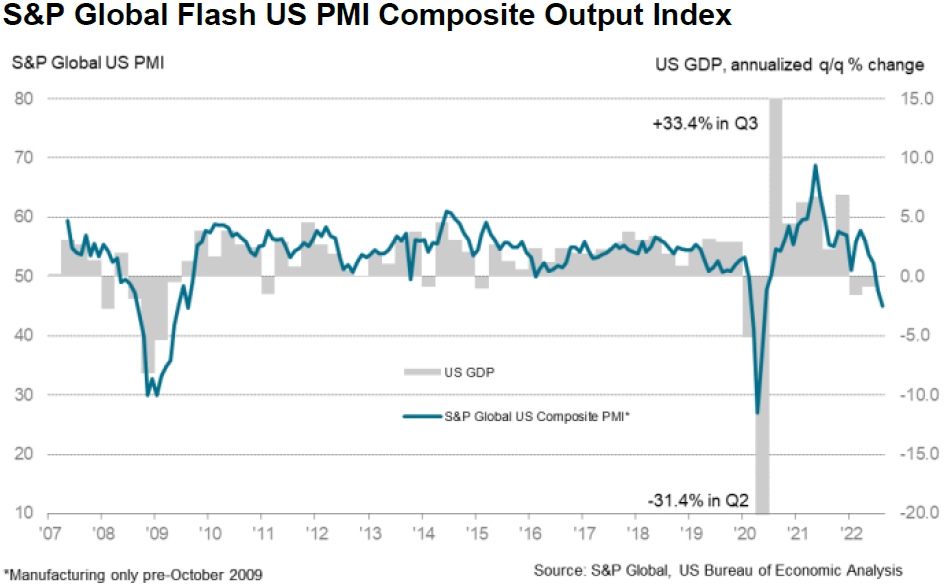
U.S. August PMIs Disappoint
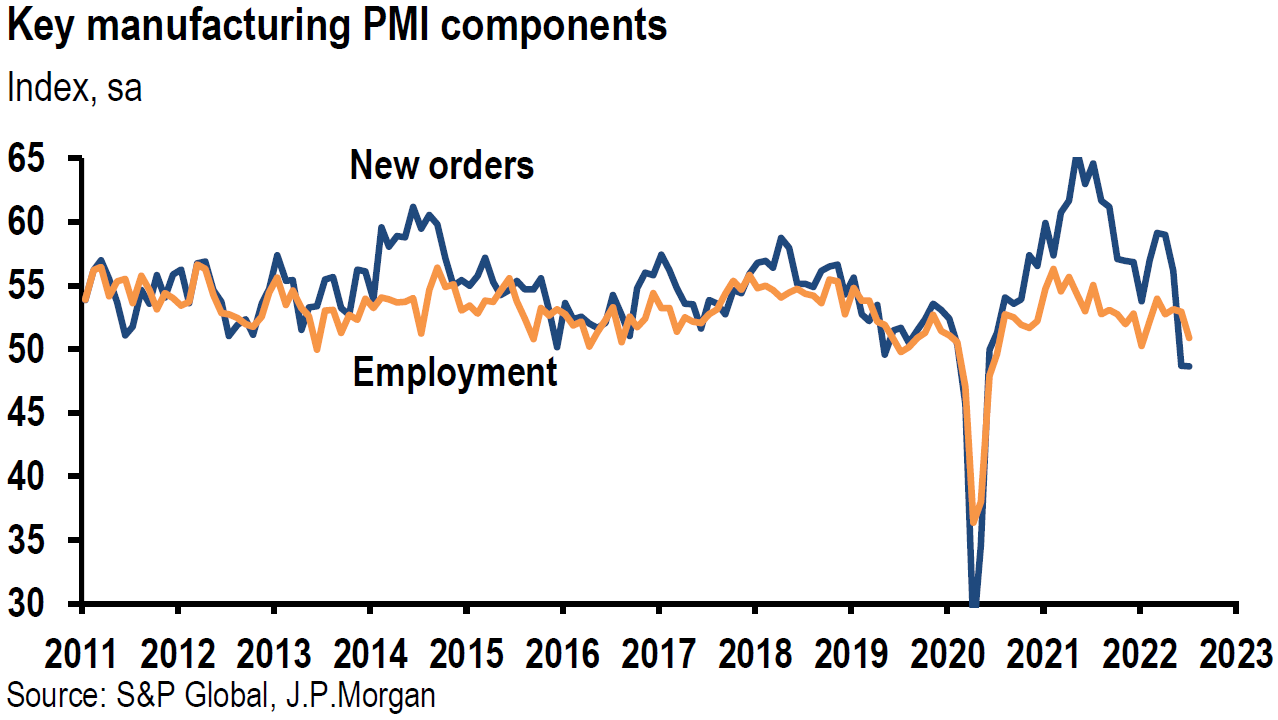
The “flash” August manufacturing and services PMIs portrayed slowing economies in both Europe and the U.S. They were generally disappointing. Most disappointing in the U.S. was the headline index for the services survey, which fell from 47.3 last month to 44.1 in August. Other than the onset of the pandemic, the July level was the weakest on record. The decrease in the U.S. composite output index was the fastest since May 2020 – 45.0 in August, down from 47.7 in July. The services sector recorded a much steeper decline than that of the manufacturing sector. The drop in new orders was the sharpest in over two years as customer demand softened. Input cost inflation eased for the third consecutive month “with input prices rising at the slowest pace for a year-and-half.” The selling prices of firms increased at the slowest pace in 18 months in August. In spite of this softer pace, the rate of inflation for prices received was the fastest of any period before March 2021. U.S. firms also reported that uncertainties and rising costs led them to delay replacement of staff. Perhaps the most surprising aspect of the U.S. PMI survey was that firms’ optimism over the outlook for output over the next 12 months was the highest in three months. Even so, the optimism level was below the “series trend as firms anticipate a challenging few months ahead.” Service providers were especially cognizant of tightening financial conditions on their business activity. They observed “that hikes in interest rates and inflation dampened customer spending as disposable incomes were squeezed.” Although the U.S. manufacturing PMI remained in expansionary territory, down from 52.2 in July to 51.3 in August, this headline reading “fell to its lowest level in just over two years, amid muted demand conditions and production cutbacks.” Improvements in supply chain disruptions were reported as delivery times lengthened by the least amount since October 2020. Although employment indexes have weakened lately, they have held up better than other components of PMI surveys.
Source: S&P Global, Faster fall in US private sector output amid weak client demand (8-23-2022)
Source: JP Morgan, US: PMIs fall again in flash August data (8-23-2022)
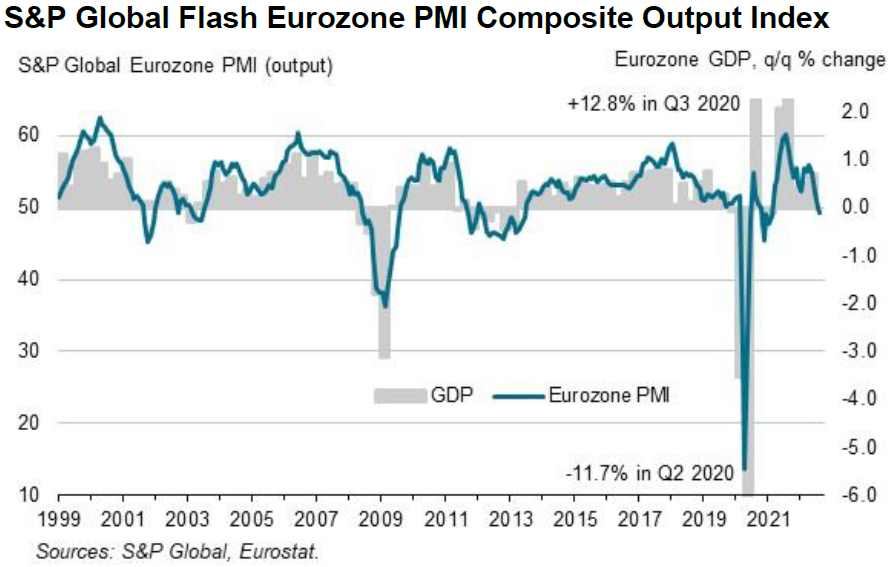
Eurozone August PMIs Disappoint
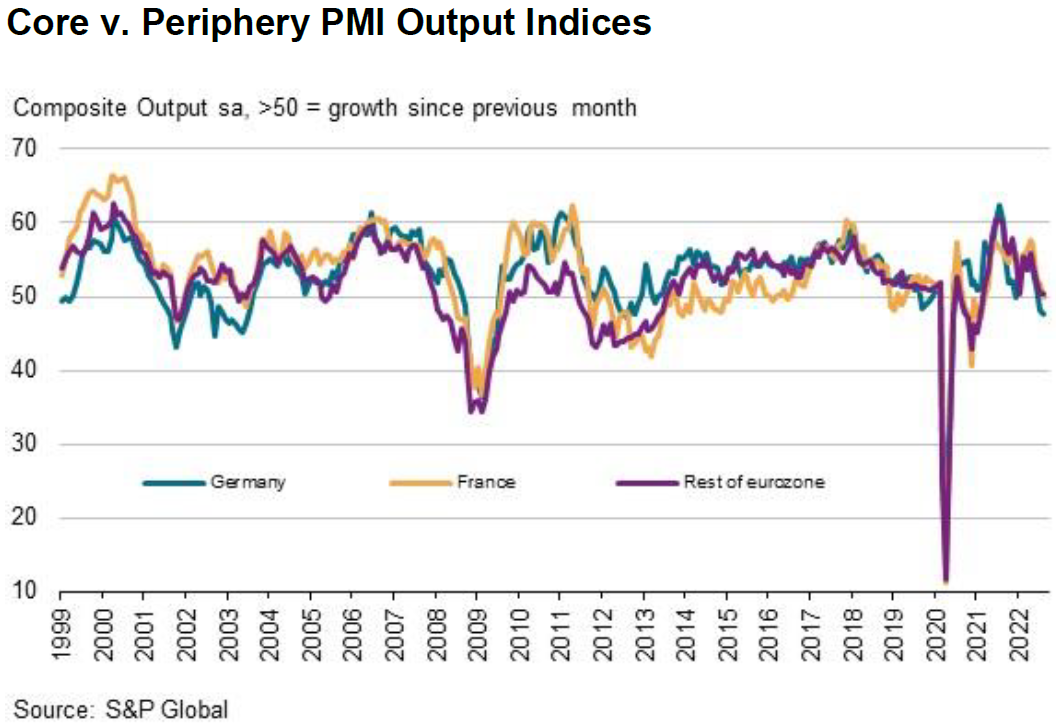
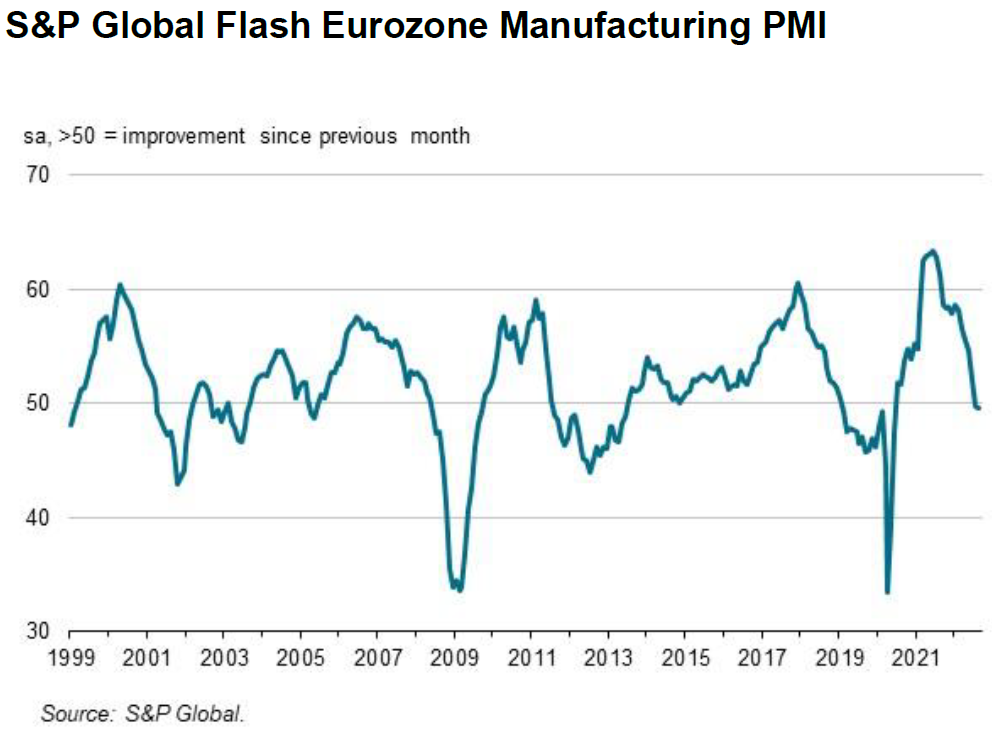
Eurozone business activity declined for the second consecutive month in August. The Eurozone PMI composite output index declined from July’s reading of 49.9 to an 18-month low of 49.2. Unlike the U.S. PMIs, it was the services sector that showed more resiliency than the manufacturing sector. The services sector was able to maintain a barely positive reading as it declined from 51.2 in July to a 17-month low current level of 50.2. New orders continued to decline and both input costs and output prices “softened across the board.” The Eurozone manufacturing output index increased slightly from 46.3 in July to a still-contractionary level of 46.5. The manufacturing PMI dropped slightly from 49.8 to a 26-month low of 49.7. The downturn in business activity in Europe was mainly concentrated in Europe’s (EU) largest economies. Germany posted the sharpest decline in composite output from 48.1 in July to a 26-month low of 47.6 for August, which was the sharpest output decline since June 2020. Activity in France decreased for the first time in a year-and-a-half, reflecting a sharp drop in manufacturing activity and softer growth in services activity. New orders declined, reflecting weakening demand. The weakening of demand led to the fastest pace of “post-production inventories” gains at the sharpest pace in 25 years. Input costs rose at the slowest pace in almost a year as prices received rose at the slowest pace this year. There were also signs of supply chain constraints easing as delivery times lengthened at the slowest rate since October 2020.
Source: S&P Global, Eurozone business activity down for second month running as service sector growth grinds to a near-halt (8-23-2022)
Selected Regional Fed Surveys
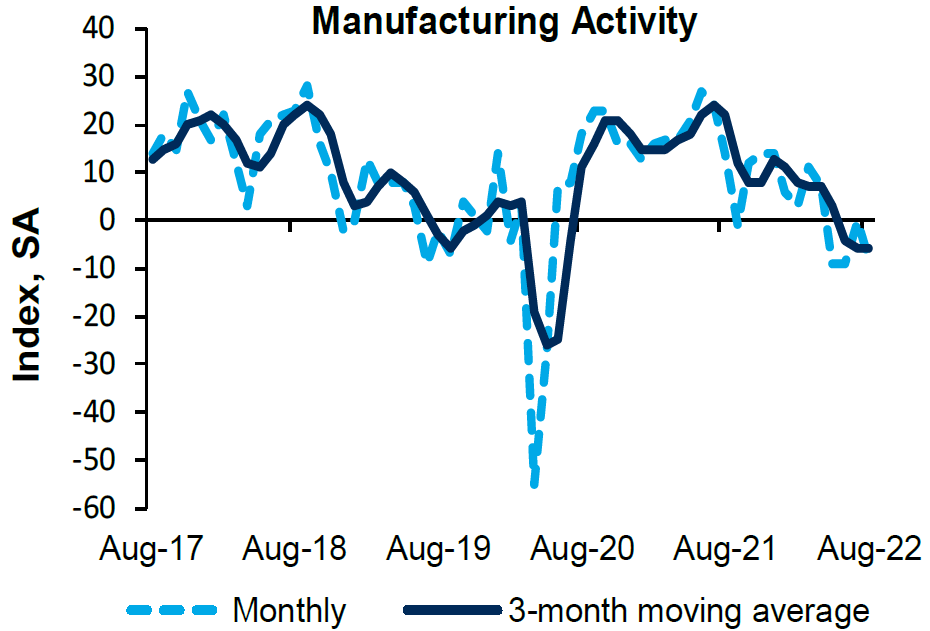
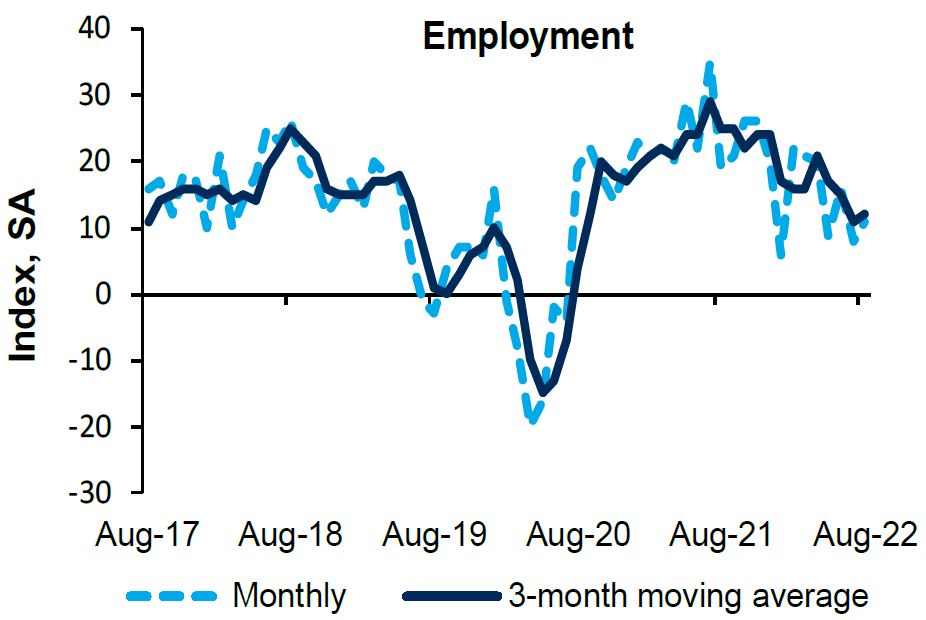
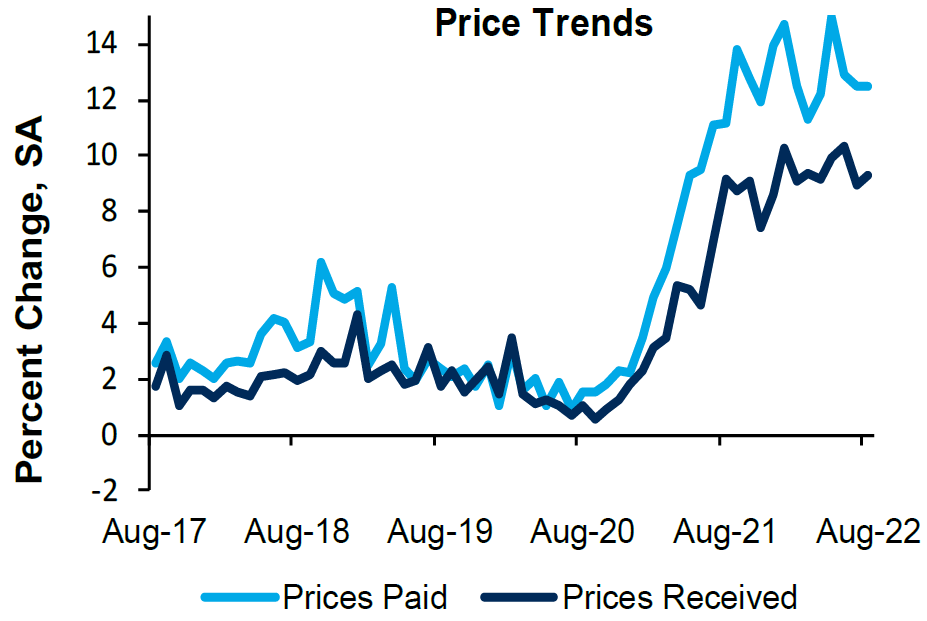
The latest Fed Regional Banks August surveys released this week continued to show a rather downbeat view of the U.S. economy. The Richmond Fed’s composite manufacturing index almost matched the -9 June level as the index fell from zero in July to -8 in August. Two of the three component indexes “tumbled.” Index for shipments slid from 7 to -8 and new orders slid from -10 in July to -20 in August. The employment index rose from 8 to 11. Expectations for business activity over the next six months remained steady. Supply chain constraints continued to ease as lead times and order backlogs decreased. The average of prices paid was virtually flat in August, while prices received “increased somewhat.”
The Kansas City Fed survey of manufacturing activity slowed “considerably” and future activity indicators also slowed as both remained in positive territory. Price levels hit their lowest levels in over a year. The composite manufacturing index dropped to 3 in August after reaching 13 in July and 12 in June. The new orders index slid to its lowest level since May 2020. The gauges measuring employment, supplier delivery times, raw materials inventories, volumes of shipments and backlog of orders also deteriorated.
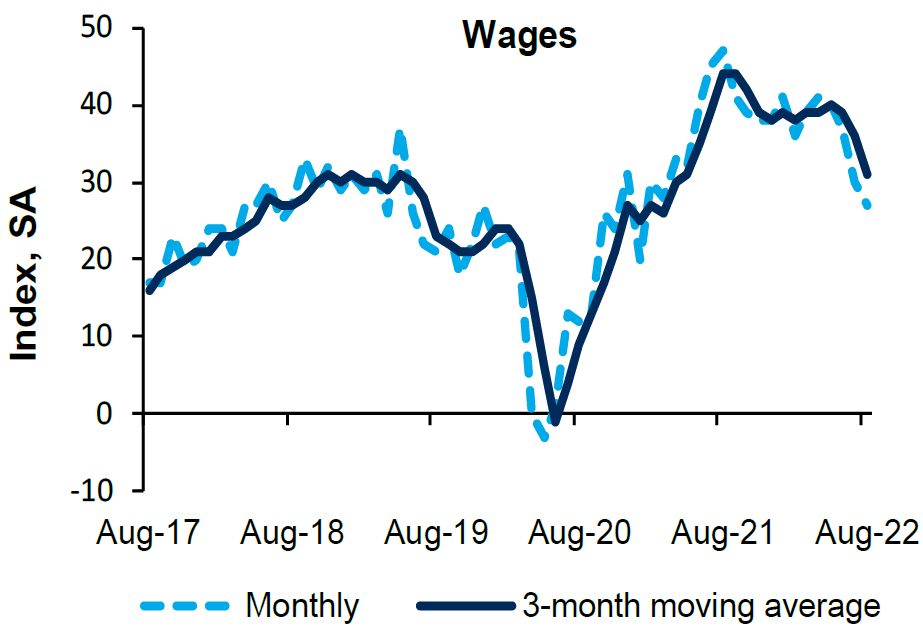
The Philadelphia Fed’s nonmanufacturing general activity index fell 12 points to zero. The new orders index fell 10 points to -5.9. The prices paid index fell 4 points to 59.6 and the prices received index fell 15 points to 17.8 in August – its lowest reading since April 2021. The median firm responding to the survey expected a 5.5% rate of inflation over the next year, compared to a 5.0% expectation in May. In contrast, the median firm expected that it could raise its own prices only 3.0% over the next year compared to a 4.0% expectation in May. Firms expected employee compensation costs – wages plus benefits – to rise 5.0% over the next year, which is unchanged from May expectations. Evidently, firms were expecting a profit margin squeeze.
Source: Federal Reserve Bank of Richmond, Fifth District Survey of Manufacturing Activity (8-23-2022)
Climate Change Possibly Affecting Supply Chains
Heat waves and droughts in China and Europe continue to affect supply chains. This has been especially true in Southwest China’s Sichuan region. This region gets about 80% of its power supply from hydroelectric power. Sichuan extended its power rationing again this week. Electric vehicle (EV) charging stations have been hit by power shortages as well. Food supplies are becoming problematic as crop production is in danger from droughts in certain areas of China and from heavy rains in other areas. Food inflation could become a more worrisome problem. Europe continues to experience extreme heat and drought conditions as well. As we indicated in last week’s commentary, effects from “climate change” could cause supply disruptions that could lead to increased rates of inflation along with slowing economic growth rates. The U.S. has not been immune from drought conditions affecting its food supplies. Concern is growing over Iowa’s corn crop. Iowa is the biggest U.S. corn grower. Corn is a major food used for livestock. This could increase food inflation. These developments could impede the general easing of supply chain disruptions described in our discussion of PMIs.
Bottom Line
For the time being, we are maintaining our basic investment approach as expressed in last week’s commentary. We will continue to favor high-quality big-cap stocks that offer good balance sheets, as well as relatively stable cash flows and profit margins. For long-term investors who are prepared to tolerate volatility, we still maintain a preference for selected high-quality big-cap tech and growth stocks, as well as energy stocks. Again, we would only add to positions on downturns. We assume continued volatility across virtually all financial markets. Much of this volatility seems to originate from the extreme volatility in fixed income markets. Many uncertainties remain. We continue to forecast very rapid changes in economic trends, many of which could be “surprising.”
We foresee that the continuing weakening trends in the U.S. and global economies should reduce demand sufficiently so that inflation rates would be lowered. Tightening financial conditions are already having deleterious effects on economic growth. This is particularly true for interest rate sensitive sectors, such as the housing sector. The lag effects of tighter monetary policies can be unpredictable somewhat in terms of timing and magnitude. We believe that the Fed should show “patience” before assessing the effects of its policies.
We continue to anticipate a 50-bps hike in the federal funds rate at the Fed’s September meeting, followed by 25-bps hikes in each of the Fed’s November and December meetings. But our conviction for a 50 bps September hike was lessened somewhat after Powell stated that “another unusually large increase [in the federal funds rate] could be appropriate at the next meeting.” It is generally accepted that “unusually large” has been interpreted to mean a 75-bps hike. Powell stated that “our decision at the September meeting will depend on the totality of the incoming data and the evolving outlook.”
The softer than consensus July PCE inflation rates were announced on Friday. This is the Fed’s preferred measure of inflation. All other things being equal, this was supportive of a 50 bps September hike. Headline July PCE inflation decreased 0.1`% m/m, while core PCE (excluding food and energy) prices increased 0.1% m /m. The headline PCE price index rose 6.3% y/y, while the core increased 4.6% y/y. In his Jackson Hole speech shortly after this release, Powell characterized this July read on inflation as “welcome” news. However, he quickly added that ”a single month’s improvement falls far short of what the Committee will need to see before we are confident that inflation is moving down.” The doubling in the monthly rate of QT beginning in September continues to influence our thinking on the size of future hikes, as well as at what level of restrictive rates the Fed will pause and for how long such a pause is maintained. We do not see any Fed rate cuts for “quite some time.”
Definitions
Flash Composite PMI – The flash Composite Purchasing Managers’ Index (PMI) provides an early estimate of current private sector business activity by combining information obtained from surveys of the manufacturing and service sectors of the economy.
Flash Services PMI – Flash services PMI is an early estimate of the Services Purchasing Managers’ Index (PMI) for a country, designed to provide an accurate advance indication of the final services PMI data.
Flash Manufacturing PMI – Flash Manufacturing PMI is an estimate of manufacturing for a country, based on about 85% to 90% of total Purchasing Managers’ Index (PMI) survey responses each month.
Federal Funds Rate – The term federal funds rate refers to the target interest rate set by the Federal Open Market Committee. This target is the rate at which commercial banks borrow and lend their excess reserves to each other overnight.
Flattening Yield Curve – The flat yield curve is a yield curve in which there is little difference between short-term and long-term rates for bonds of the same credit quality. This type of yield curve flattening is often seen during transitions between normal and inverted curves.
Inverted Yield Curve – An inverted yield curve describes the unusual drop of yields on longer-term debt below yields on short-term debt of the same credit quality. Sometimes referred to as a negative yield curve, the inverted curve has proven in the past to be a relatively reliable lead indicator of a recession.
Steeper Yield Curve – If the yield curve steepens, this means that the spread between long- and short-term interest rates widens. It typically indicates stronger economic activity and rising inflation expectations, and thus, higher interest rates. When the yield curve is steep, banks are able to borrow money at lower interest rates and lend at higher interest rates.
Neutral Rate Federal Funds Rate – The neutral rate is the theoretical federal funds rate at which the stance of Federal Reserve monetary policy is neither accommodative nor restrictive. It is the short-term real interest rate consistent with the economy maintaining full employment with associated price stability.
Federal Open Market Committee (FOMC) – The Federal Open Market Committee (FOMC) is the branch of the Federal Reserve System that determines the direction of monetary policy specifically by directing open market operations. The committee is made up of 12 members: the seven members of the Board of Governors; the president of the Federal Reserve Bank of New York; and four of the remaining 11 Reserve Bank presidents on a rotating basis.
Restrictive Federal Funds Rate – A restrictive Federal Funds Rate is the rate at which the stance of the Federal Reserve monetary policy is restrictive with the goal of taking liquidity out of the market in order to slow economic growth.
Quantitative Tightening (QT) – Quantitative tightening refers to monetary policies that contract, or reduce, the Federal Reserve System’s balance sheet.
Growth Stock – A growth stock is any share in a company that is anticipated to grow at a rate significantly above the average growth for the market. These companies generally do not pay dividends, instead growth stocks tend to reinvest any earnings they accrue in order to accelerate growth in the short term.
Personal Consumption Expenditures (PCE) Inflation – An estimated total of personal consumption expenditures (PCEs) compiled by the U.S. government monthly as one way to measure and track changes in the prices of consumer goods over time. PCEs are household expenditures.
Core Inflation – Core inflation is the change in the costs of goods and services but does not include those from the food and energy sectors. Core inflation is important because it’s used to determine the impact of rising prices on consumer income.
Headline Inflation – Headline inflation is the raw inflation figure reported through the Consumer Price Index (CPI).
Basis Points (bps) – A basis point is one hundredth of one percent, used chiefly in expressing differences of interest rates.
Eurozone – The eurozone, officially known as the euro area, is a geographic and economic region that consists of all the European Union countries that have fully incorporated the euro as their national currency.
Regional Fed Reserve Bank – The Federal Reserve System is composed of 12 regional Federal Reserve Banks that are each responsible for a specific geographic area of the U.S.
IMPORTANT DISCLOSURES
The views and opinions included in these materials belong to their author and do not necessarily reflect the views and opinions of NewEdge Capital Group, LLC.
This information is general in nature and has been prepared solely for informational and educational purposes and does not constitute an offer or a recommendation to buy or sell any particular security or to adopt any specific investment strategy.
NewEdge and its affiliates do not render advice on legal, tax and/or tax accounting matters. You should consult your personal tax and/or legal advisor to learn about any potential tax or other implications that may result from acting on a particular recommendation.
The trademarks and service marks contained herein are the property of their respective owners. Unless otherwise specifically indicated, all information with respect to any third party not affiliated with NewEdge has been provided by, and is the sole responsibility of, such third party and has not been independently verified by NewEdge, its affiliates or any other independent third party. No representation is given with respect to its accuracy or completeness, and such information and opinions may change without notice.
Investing involves risk, including possible loss of principal. Past performance is no guarantee of future results.
Any forward-looking statements or forecasts are based on assumptions and actual results are expected to vary from any such statements or forecasts. No assurance can be given that investment objectives or target returns will be achieved. Future returns may be higher or lower than the estimates presented herein.
An investment cannot be made directly in an index. Indices are unmanaged and have no fees or expenses. You can obtain information about many indices online at a variety of sources including: https://www.sec.gov/fast-answers/answersindiceshtm.html or http://www.nasdaq.com/reference/index-descriptions.aspx.
All data is subject to change without notice.
© 2024 NewEdge Capital Group, LLC


