

Weekly Summary: October 24 – October 28, 2022
Key Observations:
- We continue to be encouraged by positive stock price reactions to “good” earnings reports. We are also encouraged by the rather limited “spillover” effects from even extremely negative stock price reactions to “bad” earnings reports.
- Some of the downwardly revised earnings and margin estimates that we have been anticipating are finally beginning to be realized. We will continue to closely monitor earnings announcements and stock price reactions in our effort to decipher what is “priced in” to individual stock prices as well as equity markets in general. The importance of stock selection is highlighted in an environment of limited “spillover” effects. We believe that in such an environment, there is an enhanced probability that picking a stock that has not priced in good news sufficiently, will be rewarded.
- In our positions as fiduciary and investor, we do in fact worry. But we don’t just worry about what could go wrong. We also try to project what can go “right” for investments over the long term.
- We surmise that a critical component of favorable stock price performance of selected securities this week was the downward trajectory of interest rates and USD this week. A lower USD typically is beneficial for commodity prices. In the current environment, we also view a lower USD as beneficial for the global economy in general. We will continue to monitor these developments closely.
The Upshot: Our general investment approach remains the same as depicted in last week’s commentary. We maintain our preference for big cap quality stocks with good balance sheets, relatively stable cash flows and stable margins. Volatility across sectors continues to be supportive of a diversified portfolio for long term investors.
We believe that this week’s trading and movements in financial markets confirms that interest rates and their volatility continue to be the principal drivers of equities and currencies. The importance of downwardly revised earnings and margins that we have been anticipating have been prominently on display this week as well. The muted spillover effects from negative “surprises” from even some of the largest MegacapTech stocks has been an encouraging sign for the overall U.S. equity markets. Everything else being equal, seasonal factors could be very conducive for favorable U.S. stock performance in the near term. Most of the economic data we analyzed this week indicated a slowing U.S. economy along with a slowing of inflationary pressures.
We continue to expect the Fed to raise the federal funds rate by 75 basis points (bps) at next week’s FOMC meeting and by 50 bps at the December meeting.
Why Worry?
We have a suggestion for Meta Platforms, Inc.’s (META) CEO Mark Zuckerberg; Play Black Eyed Peas and Shakira’s song “Don’t You Worry” at the beginning of every earnings conference call for the foreseeable future. Towards the end of META’s very disappointing earnings conference call after the close of trading on Wednesday, Zuckerberg said “I think that those who are patient and invest with us will end up being rewarded.” Zuckerberg also exhibited a deep resolve to continue META’s focus on the metaverse when he said ”I think people are going to look back on decades from now and talk about the importance of the work that was done here.” In other words, he was telling us; “Don’t you worry ‘bout a thing; ‘Cause everything’s gonna be alright … Do just, do just what I like … This is how we do it, baby, this is what we say … We gon’ keep on doin’ what we do.” As the controlling shareholder of META, it will be very difficult to dissuade him from pursuing his goals. META’s stock price traded down more than 24% on Thursday. Apparently, investors were rather alarmed at the projected expense to achieve Zuckerberg’s amorphous vision. In this context, we were reminded of president Ronald Reagan’s often quoted phrase from a Russian proverb, “Trust, but verify”. Include us among those who did not just blindly put our trust in Zuckerberg’s determination to seemingly strive for his vision at any cost. We strive to invest in companies whose managements we “trust,” but we also do our own independent analysis when we decide to purchase or sell securities.
“Trust, But Verify”
In our positions as fiduciary and investor, we do in fact worry. But we don’t just worry about what could go wrong. We also try to project what can go ”right” for investments over the long term. Furthermore, we try to scrutinize constantly economic and financial market data to understand better the trends, as well as the compelling risk/reward investment opportunities. We “trust,” but we also “verify.” This week saw a dramatic drop in interest rates and the U.S. dollar (USD), which provided a more amenable backdrop for positive stock price performance. In our opinion, this made it easier for a company’s good earnings results to be rewarded by positive stock performances, even as other companies’ stock performances suffered on announcements of poor earnings reports and future guidance. We continue to be encouraged by minimal “spillover” effects from poor earnings reports and guidance to overall equity prices. Although META’s stock price had the most negative reaction to its earnings announcement, most of the other “MegacapTech” stock prices fared poorly also this week as they announced their earnings. Judging by their stock price reactions this week, much of the “bad” earnings results for Q3 were not “priced in.” We have been anticipating downwardly revised earnings and margins. Some of our expectations are beginning to be realized.
Stock Selection Matters
Most stock averages are weighted according to the capitalization of their constituents. In reports published this week, J.P. Morgan (JPM) noted that the MegacapTech stocks had a 26.5% weight in the S&P 500 index, an 11.2% weighting in the Consumer Discretionary sector and an 8.1% weighting in Communication Services. Not surprisingly, the S&P “equal-weighted” index outperformed the much more familiar “cap-weighted” index this week. Selective stock picking in such an environment is expected to lead to outperformance.
The Russell 2000 index – considered the “small cap” index – appeared to outperform even the equal-weighted S&P. Small caps are typically more U.S. centric in their sales than their larger U.S. counterparts. A strong USD for most of this year “should” have led to the outperformance of small cap stocks. Instead, small caps underperformed for a great part of this year. It has been our contention that this was due mostly to small companies being at a disadvantage relative to larger companies in their competition for labor, as well as needed materials and inputs. According to many surveys we have analyzed and summarized in prior commentaries, supply chain disruptions and delays appear to be “easing.” This trend should particularly be helpful for prospects of smaller companies. A less tight labor force would likewise be helpful. We also have noted at least some positive indications that the labor market is beginning to ”loosen.” We will monitor these developments.
S&P Global Flash U.S. October Purchasing Managers’ Index (PMI)
Like last week, most of the economic data we analyzed this week was supportive of our hypothesis that the U.S. and many foreign economies are slowing, and that U.S. inflationary pressures are beginning to dissipate. Announced on Monday, the S&P Global Flash Composite PMI for October decreased from 49.5 in September to 47.3 in October, as it decelerated further into contractionary territory, which is defined as any reading under 50. Other than at the onset of the 2020 pandemic, this was the second fastest monthly decline since 2009. The Services Business Activity Index decreased from 49.3 to 46.6, Manufacturing Output Index delivered a marginal increase of 0.1% to 50.7, but the Manufacturing PMI dropped from 52.0 to 49.9, which represents a 28-month low. Input costs remained elevated despite growing at the second slowest rate since January 2021. High interest rates, material shortages and greater wage bills all contributed to rising input costs. Margins came under pressure as prices received grew at the “softest” pace since December 2020. Faced with weaker client demand, some firms offered concessions to customers as they tried to take advantage of reduced transportation costs. Optimism about future business activity deteriorated “markedly” in October to the weakest level in more than two years. Firms noted the easing of supply chain pressures. A decline in the level of services business resulted in some of the firms in the sector reducing their employment levels via worker attrition, as well as lay-offs. October marked the first reduction of services firms’ employment levels since June 2020. Goods producers moderated their employment levels mostly through the non-replacement of workers who voluntary left.
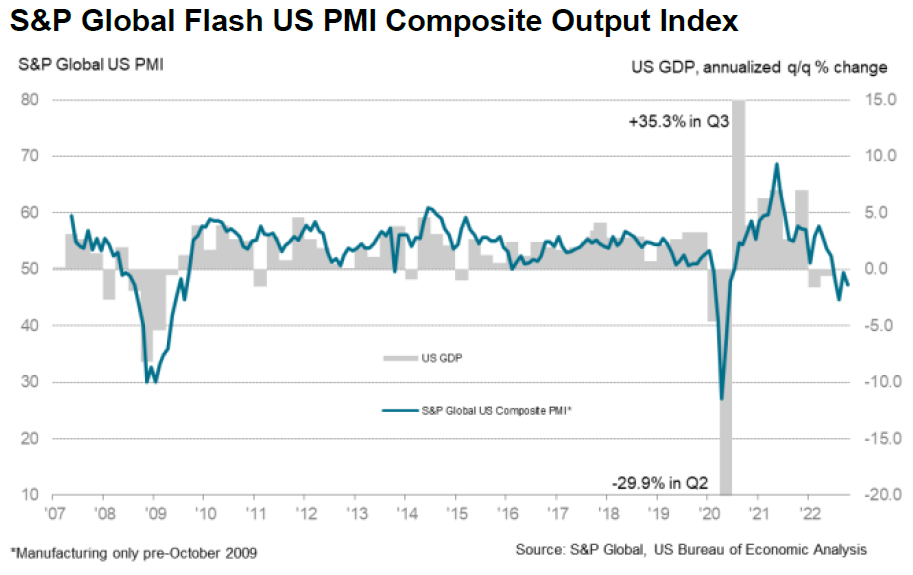
Source: S&P Global, Challenging demand conditions and inflation concerns weigh on US private sector in October (10-24-2022)
S&P Global Flash Eurozone October PMI
The Eurozone economic contraction “intensified” in October as all four PMI measures deteriorated further into negative territory reaching 20-to-29-month lows. Excluding the downturn during pandemic lockdowns, the rate of the Eurozone economic downturn in October had the fastest pace since April 2013. As reported by IHS Markit on October 24, “Manufacturing, and energy intensive sectors in particular, reported the steepest output loss, but services activity also continued to fall at an accelerating pace.” The economic contraction was steepest in Germany. Business confidence for the year ahead remained at near 24-month lows. Employment grew at the third-slowest rate over the past 1.5 years “reflecting job cutting at some firms amid signs of surplus capacity relative to sales and a broader reticence to hire amid uncertainty regarding the outlook.” Input costs remained highly elevated due to rising energy costs and upward wage pressures, even as easing raw material supply constraints alleviated some inflationary pressures. Prices received “cooled” only marginally in both manufacturing and services.
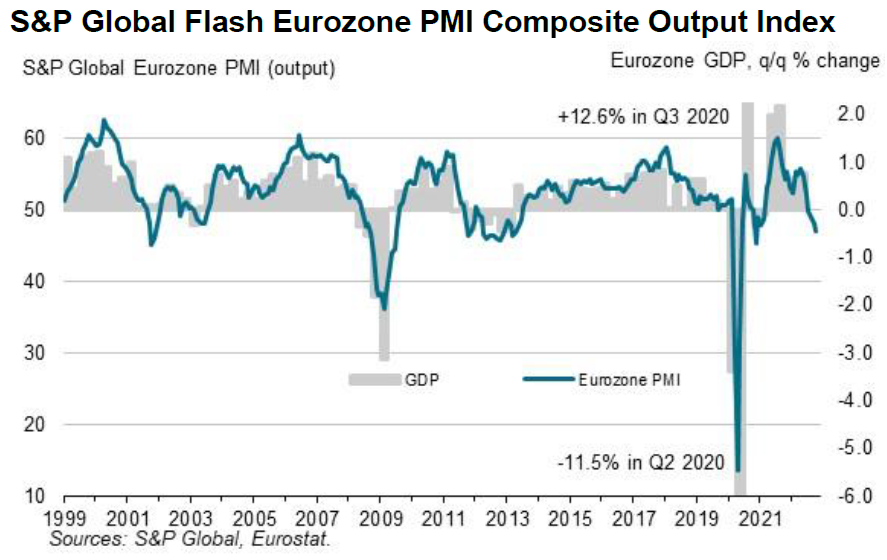
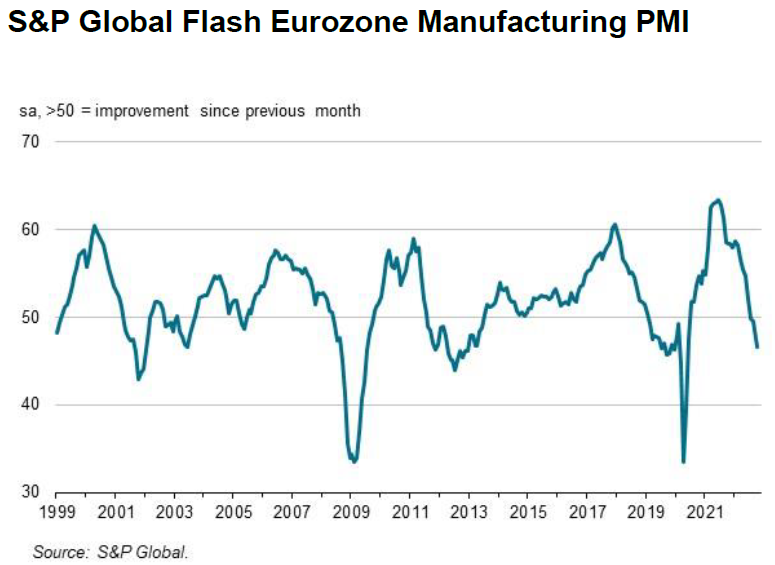
Source: S&P Global, Eurozone economic contraction intensifies in October (10-24-2022)
Philadelphia Fed October Nonmanufacturing Survey
The current general business activity index for October dropped eight points to a still-positive 11.2 that suggested a continuing expansion in nonmanufacturing activity. New orders fell four points to -5.5, which marked the third consecutive month in negative territory. The regional activity index fell 17 points to -14.9. Full and part-time employment rose slightly in October. Additionally, both prices paid and received rose as well. Most firms expected continued growth over the next six months. However, optimism was less widespread in October. The index for future business activity fell from 24.5 to 5.2.
Richmond Fed October Manufacturing Survey
As the wage index decreased slightly but remained still elevated, the composite manufacturing index fell 10 points from September’s zero level to -10. The local business conditions index fell further into negative territory as firms grew “considerably” more pessimistic about the next six months. Although supply chain issues improved “dramatically” earlier this year, little progress was observed since August. Prices paid and received increased in October after moderating in September. Expectations of price increases over the next twelve months exceeded expectations in September.
Kansas City Fed October Manufacturing Survey
The composite index fell from -1 in September to -7 in October as manufacturing declined “slightly” in October. Indexes fell “considerably” for production, shipments and new orders. There were “slight” gains in employment.
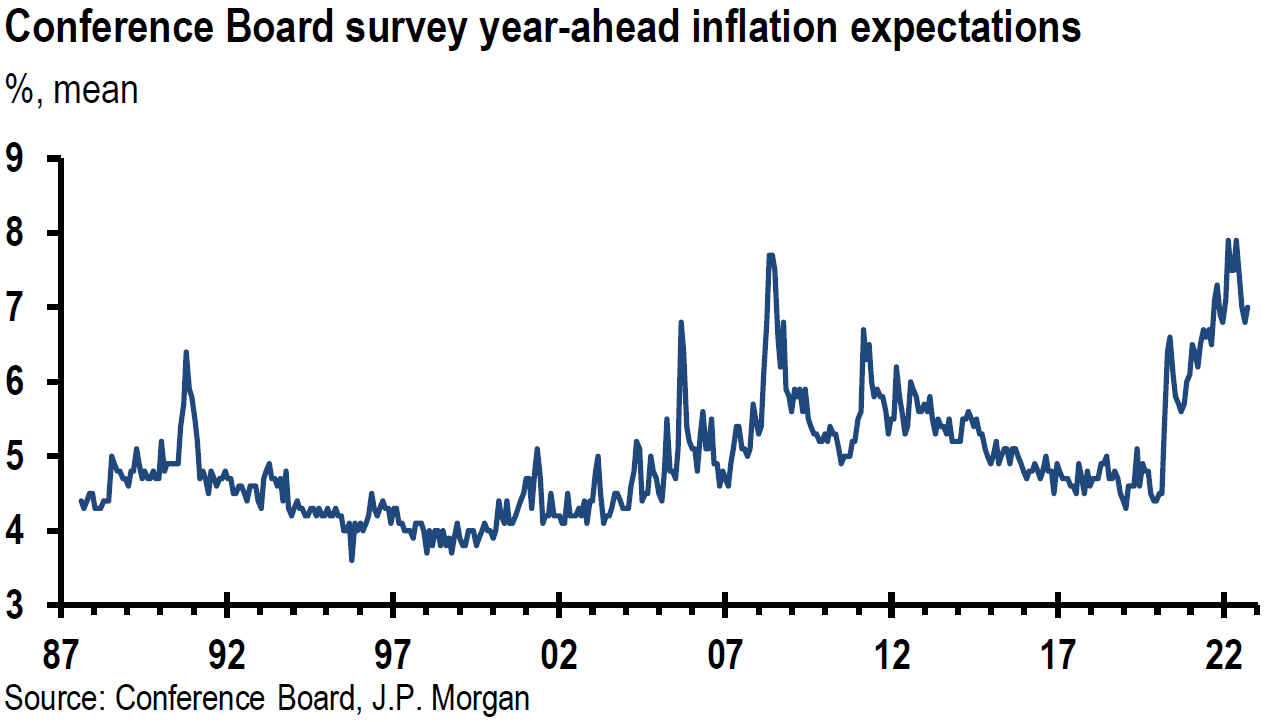
Conference Board October Consumer Confidence Index
After two monthly gains, the Consumer Confidence Index fell from September’s 107.8 level to 102.7. The “present situations” index mostly was responsible for this decline as it dropped from 150.2 in September to 138.9. In contrast, the expectations index, which reflects consumers’ short term outlook, declined only slightly from 79.5 last month to 78.1 in October. But this level was characterized as “dismal” since any level below 80 is considered to be associated with recessions. Driven mostly by gasoline and food prices and receding since July, inflation concerns rose in October. Inflationary pressures were seen as potential headwinds for consumer confidence and spending that could lead to a “challenging” holiday season for U.S. retailers. Given existing inventories, steep discounting by retailers could deliver results that would squeeze retailers’ margins. The Conference Board’s survey also reflected a narrowing of the labor differential, which is the difference between the percentage of respondents saying jobs are plentiful and those saying jobs are hard to get. The percentage of respondents indicating plentiful jobs decreased four points to 45.2% and the percentage of respondents indicating that jobs are hard to get increased 1.6 points to 12.7%. A narrowing of this differential is considered indicative of a less-tight labor market from the employers’ perspective.
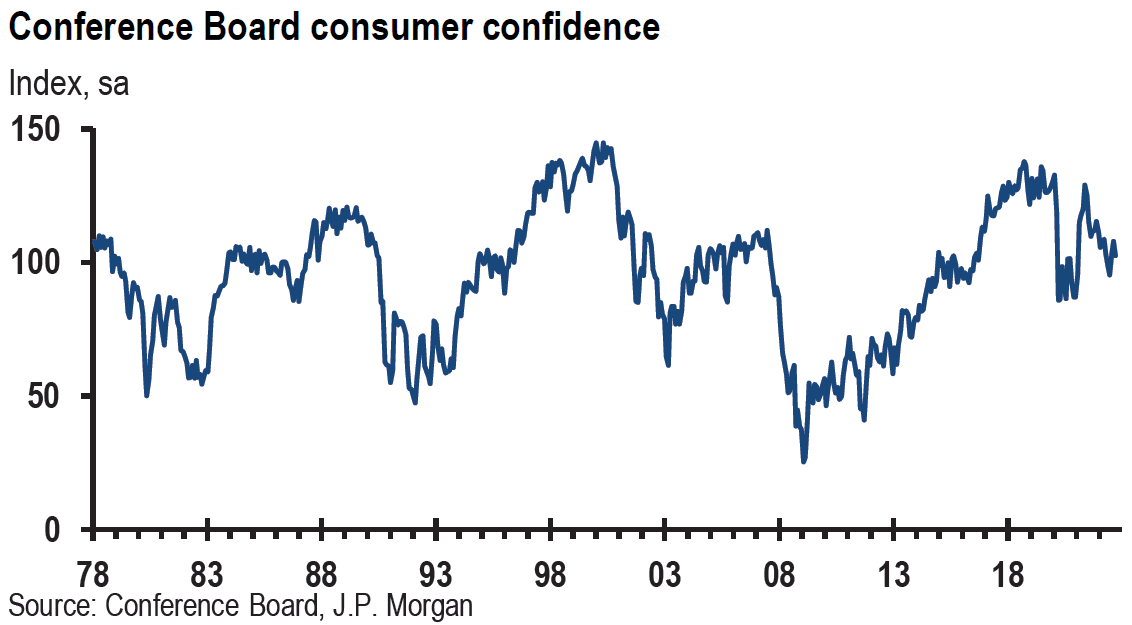
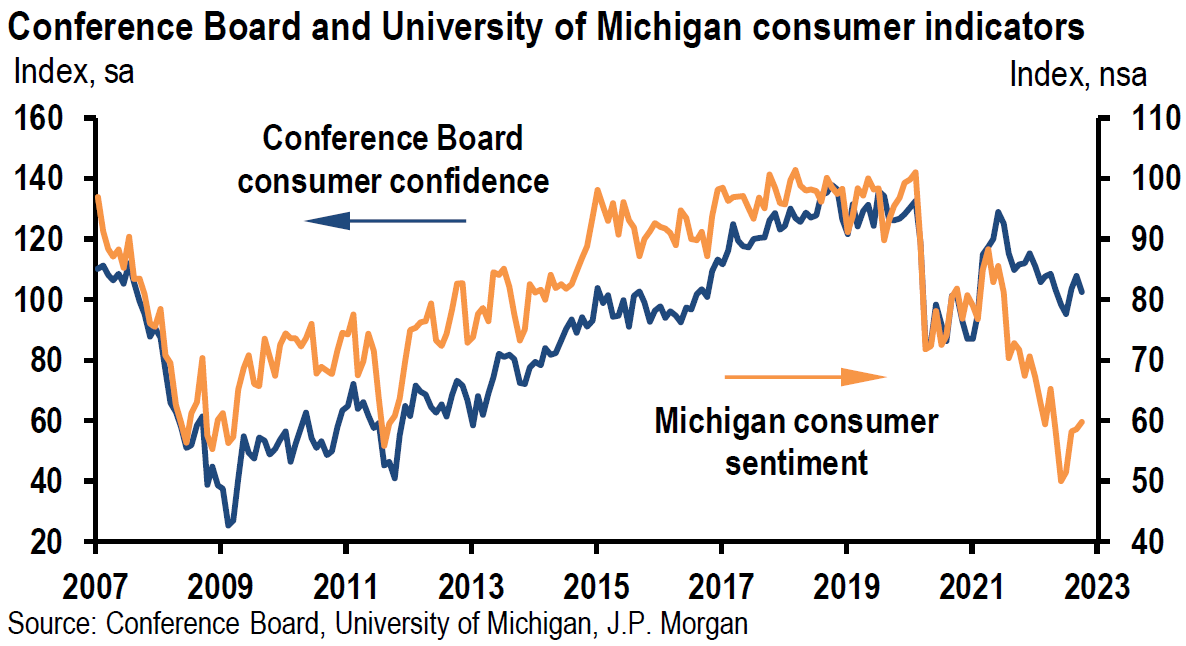
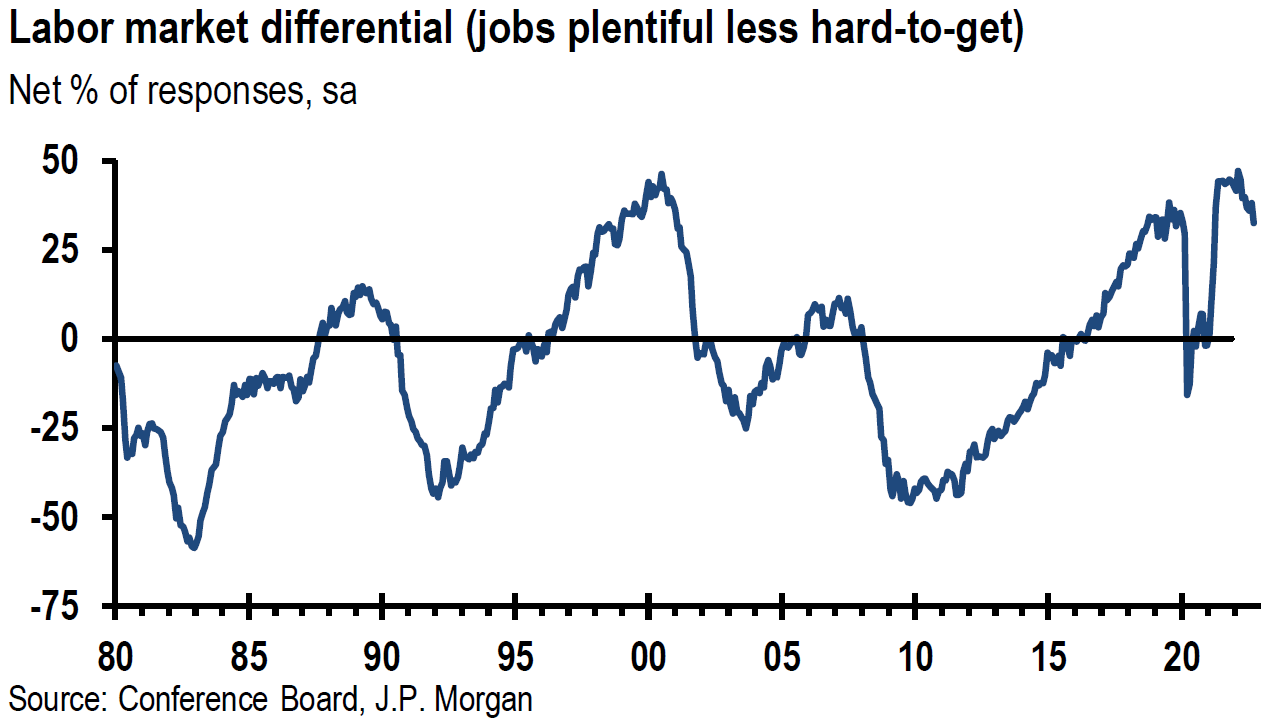
Source: JP Morgan, US: Consumer confidence moves down (10-25-2022)
Initial and Continuing Claims for Unemployment Insurance Benefits
Initial claims for the week that ended October 22 increased 3,000 to 217,000 versus an expected level of 220,000. This relatively low level reflected a still “tight” labor market. But continuing claims for the week that ended October 15, rose from the prior week by a more-than-expected 55,000 to 1.438 million. This was the highest number since early April and could be interpreted as an indication of a somewhat less-tight labor market. On a cumulative basis, continuing claims increased by 92,000 over the most recent four weeks.
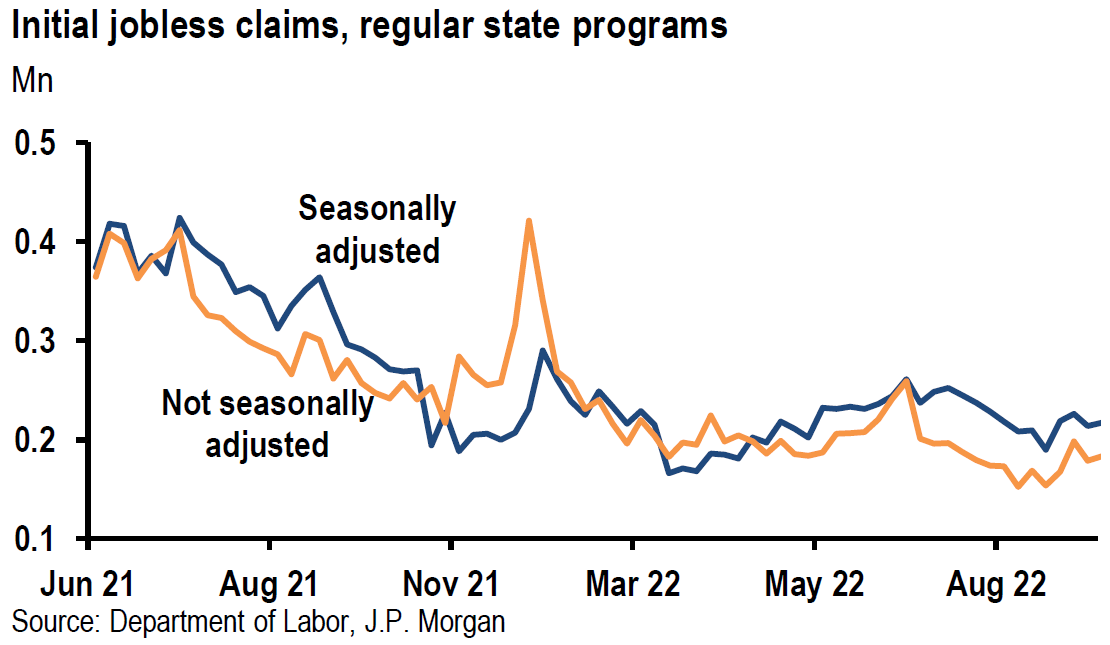
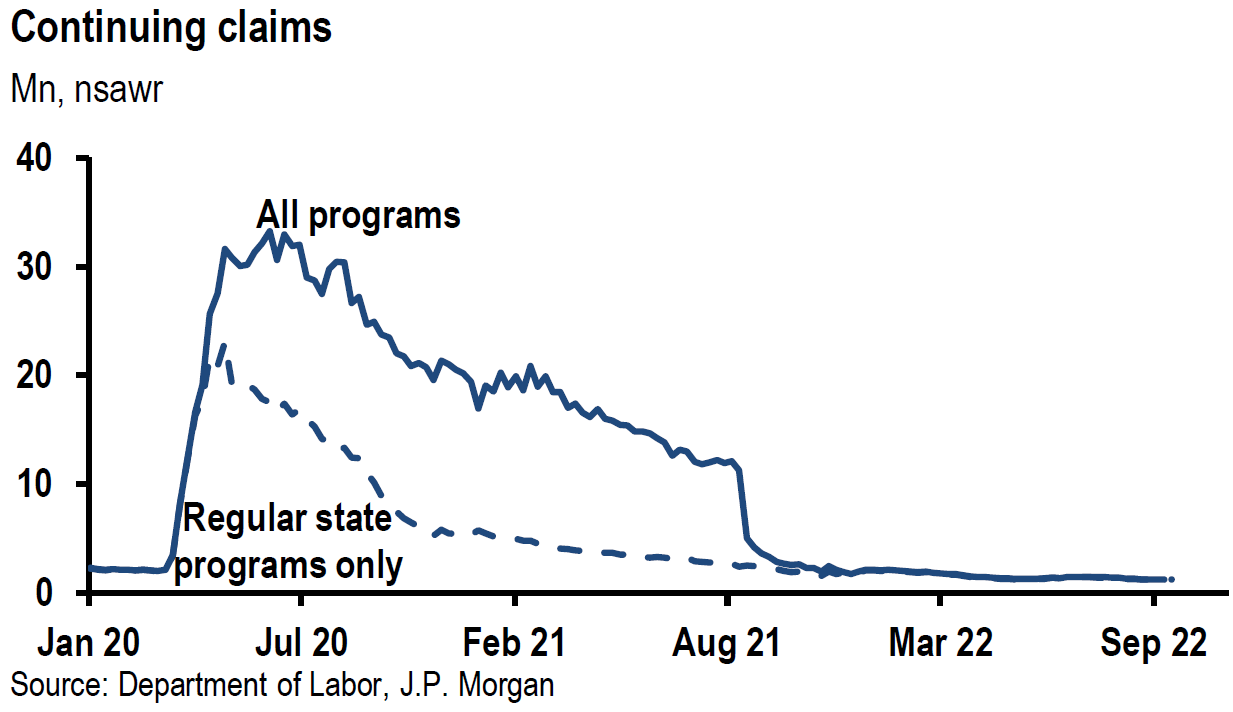
Source: US: JP Morgan, Initial claims edge up to 217,000 (10-27-2022)
Weaker U.S. Housing Market
Both the Federal Housing Finance Agency (FHFA) and Case-Shiller house price indexes for August showed month-over-month (m/m) declines. The FHFA index was 0.7% lower m/m and +11.9% y/y. July prices were 0.6% lower m/m. This was the first back-to-back monthly decline in house prices since March 2021. The Case-Shiller home price index declined 1.1% m/m in August after declining m/m in July, which was the first decline for the national index since February 2012. The Case-Shiller y/y increase in August was 13.0% versus a 15.6% y/y gain in July. The 2.6% differential in y/y totals over two consecutive months was the largest in the history of the survey. U.S. housing prices peaked in the spring of this year.
In September 2022, new U.S. home sales fell by a less-than-expected 10.9% m/m and 17.6% y/y. The seasonally adjusted annual rate of 603,000 new homes sold in September was above the 585,000 expected annualized sales rate. September sales were 10.9% below August’s annualized rate of 677,000. Although the drop in sales was less than expected, it still appears that the trend for new home sales remains lower. The September inventory of new homes for sale corresponded to 9.2 months of supply at the current sales pace. The 30-year fixed rate mortgage hit 7.16% this week.
The National Association of Realtors released its September Pending Home Sales (PHS) Index on Friday. This index is based on signed contracts to buy existing homes and generally leads existing home sales by a month or two. Pending home sales fell by 10.2% m/m versus an expected decline of 3.8% and were 41% lower y/y. Contract signings decreased in every region in the U.S. Excluding April 2020, the PHS index was at its lowest level since June 2010.
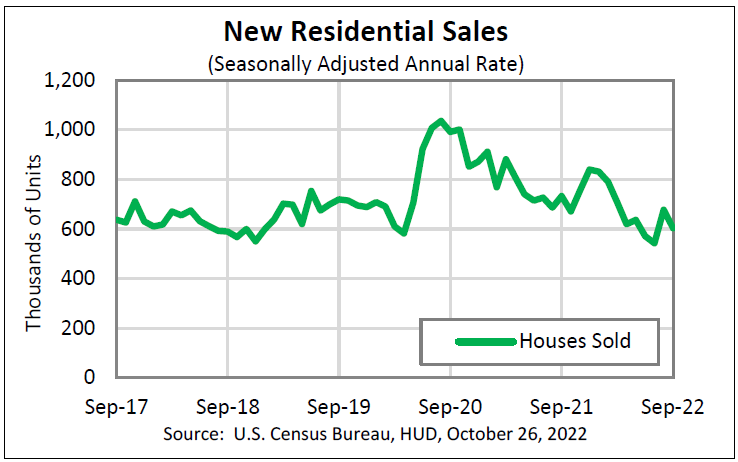
Source: U.S. Census Bureau, Monthly New Residential Sales, September 2022 (10-26-2022)
Real Q3 U.S. GDP
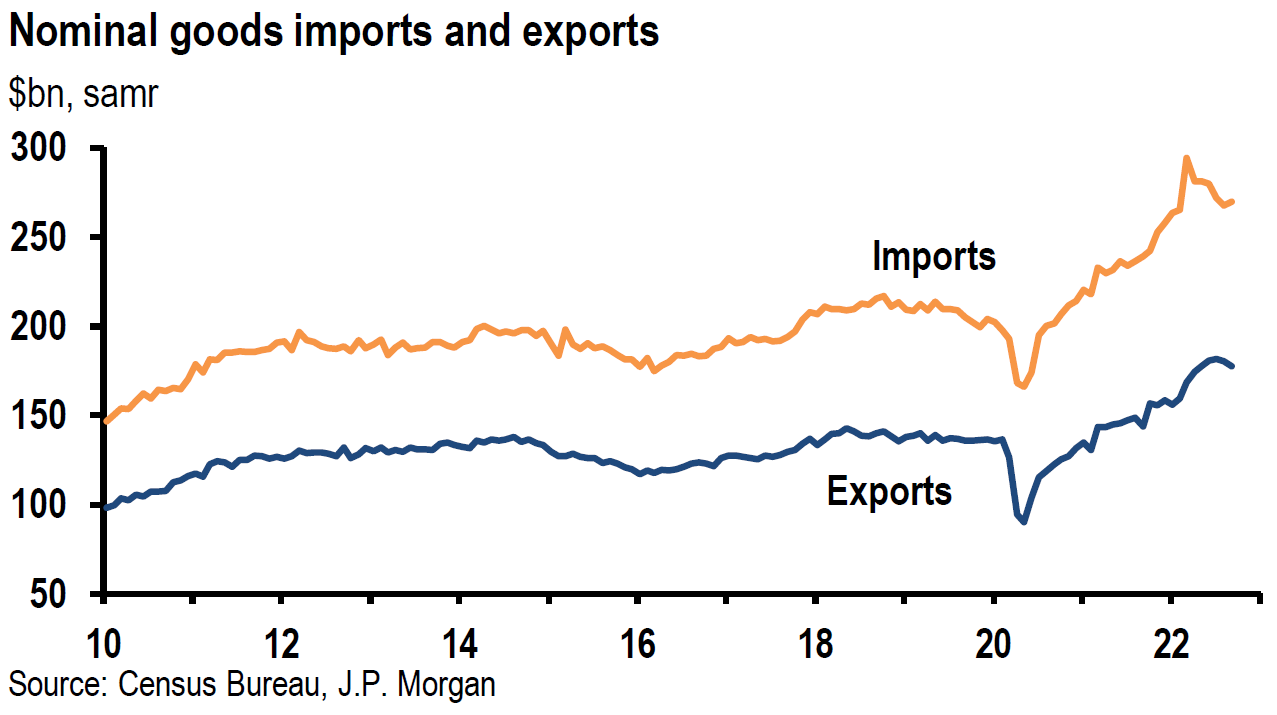
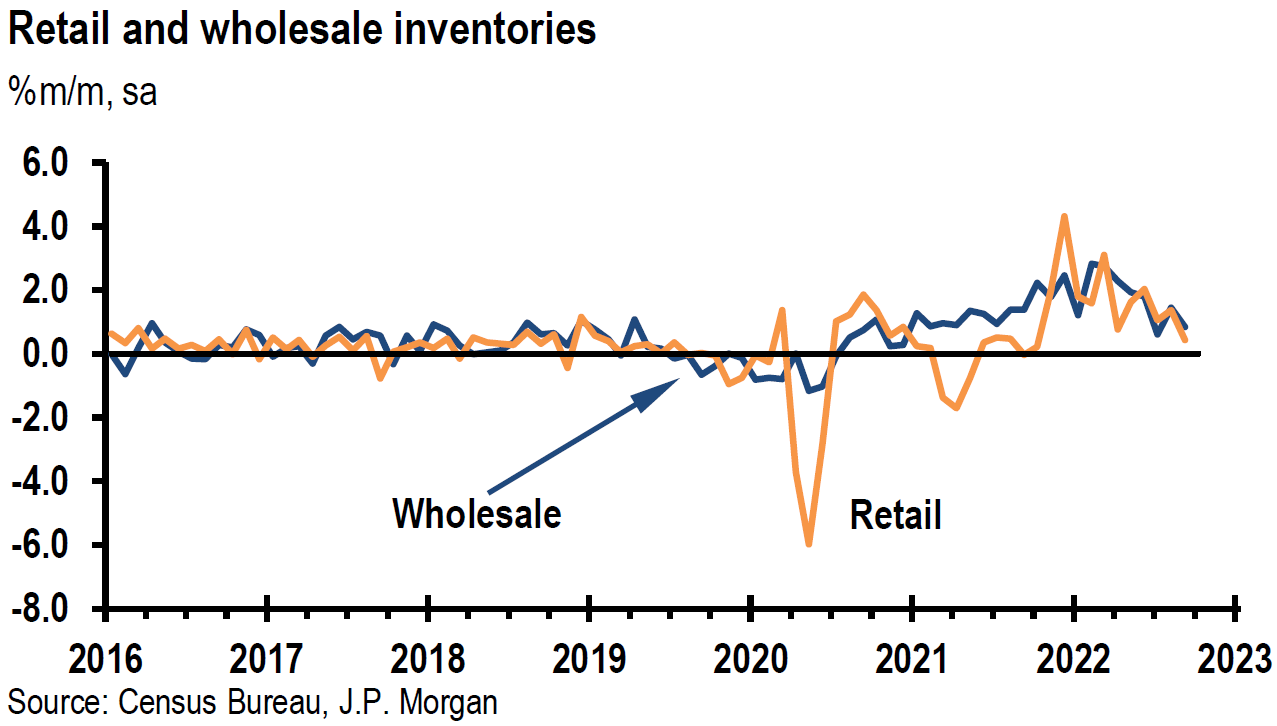
Real GDP rose 2.6% annualized in Q3 versus an expected increase of 2.3%. The shrinking U.S. trade deficit in Q3 contributed greatly to this increase. Net exports added 2.8% as real exports rose 14.4% (annualized) and real imports dropped 6.9% (annualized). The pace of inventory accumulation slowed, subtracting 0.7% from Q3 GDP.
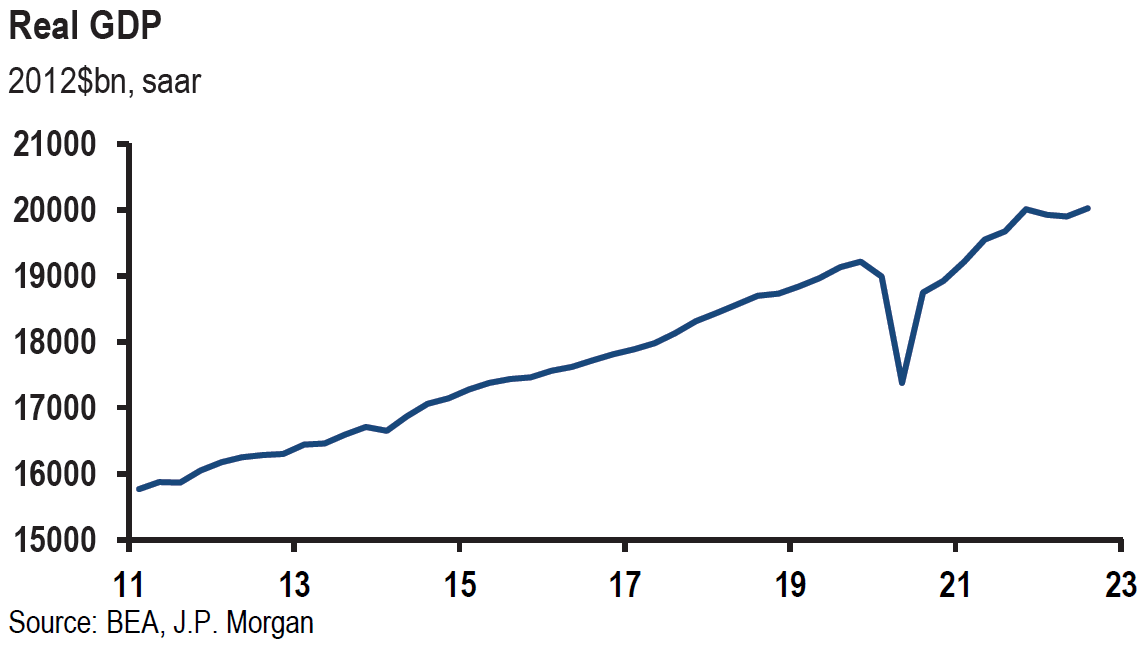
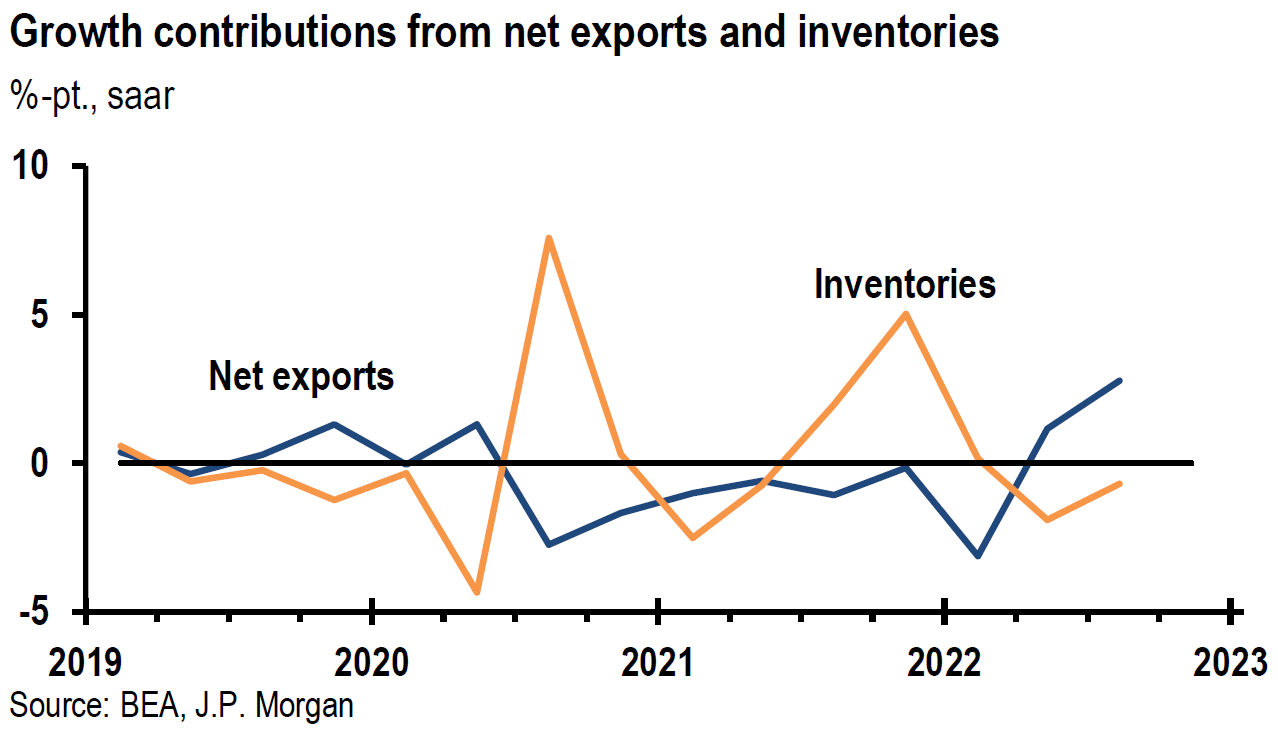
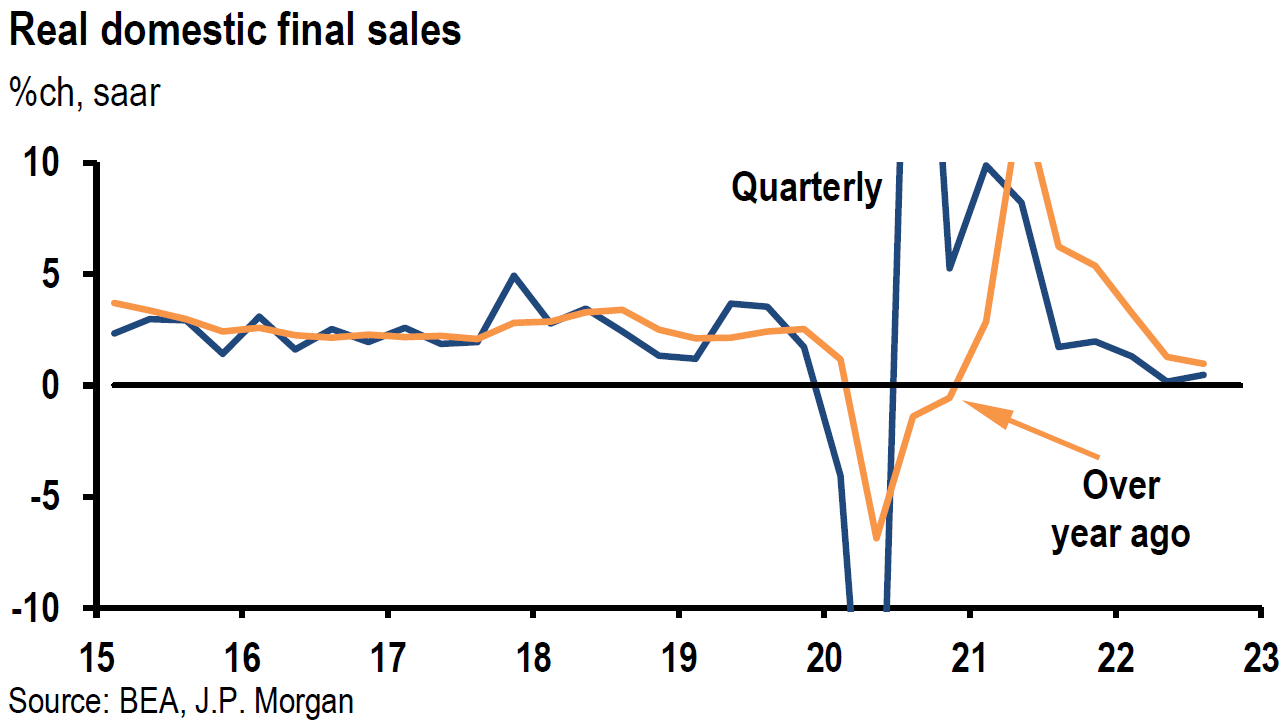
Source: JP Morgan, US: Real GDP increases 2.6% saar in 3Q with boost from trade (10-27-2022)
Source: JP Morgan, US: 3Q real GDP still tracking 3.0% saar (10-26-2022)
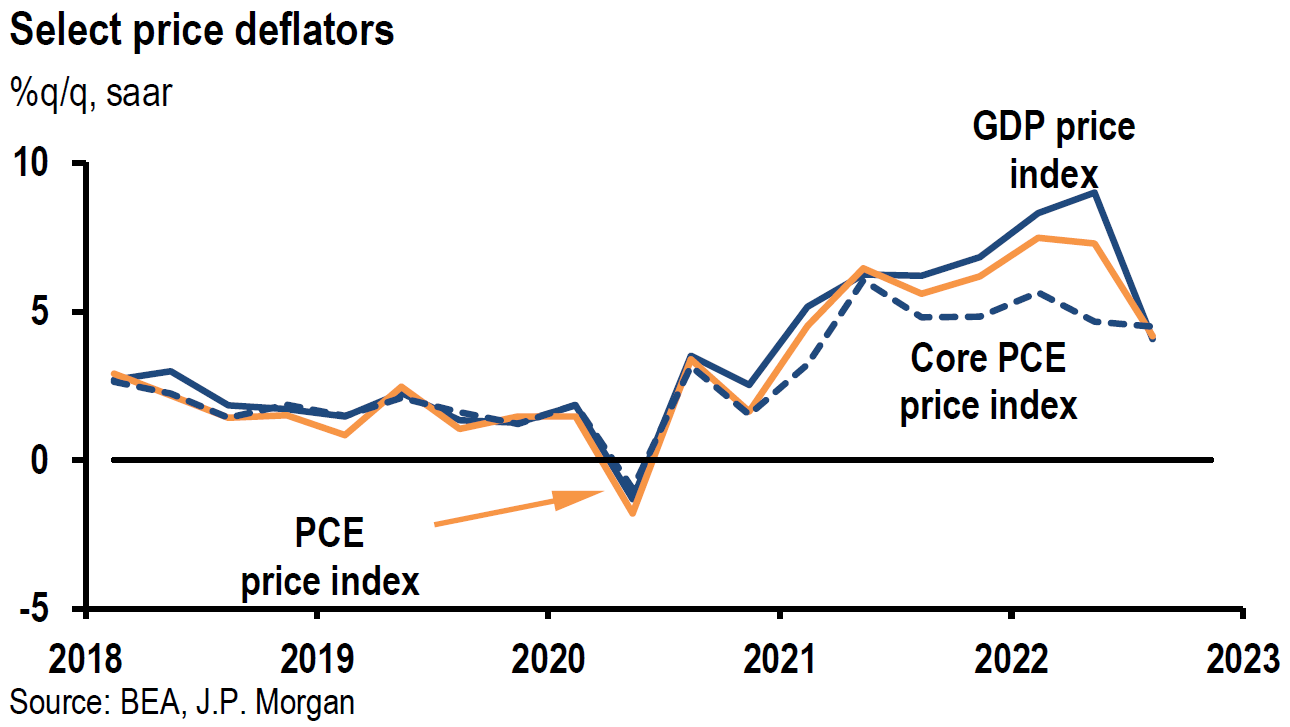
Personal Consumption Expenditures (PCE) September Inflation Report
PCE inflation data is the Fed’s preferred measure of inflation. Headline PCE inflation rose 0.3% m/m and 6.2% y/y in September and core PCE inflation was 0.5% higher/and 5.1% higher y/y, which was close to expectations. Among the other data included in this report nominal consumer spending rose 0.6% m/m, above expectations of a gain of 0.4%. Real spending was 0.3% higher m/m versus an expected increase of 0.2%. The Employment Cost Index (ECI) met expectations as it increased 1.2% m/m. Nominal personal income rose 0.4% m/m versus an expected gain of 0.3%. The savings rate moved lower to 3.1%, closer to its recent low of 3.0% recorded in June. The “good” news was that inflationary pressures were not appreciably above expectations, Nevertheless, these were strong inflation numbers.
Durable Goods Disappoint
Durable goods orders rose 0.4% m/m in September. This headline number was boosted by a 21.9% increase in nondefense aircraft orders. Durable goods ex volatile transportation fell 0.5% m/m. Core capital goods was 0.9% lower compared to expectations of a 0.4% increase. We interpret the weaker than expected core durable goods figure as an indication that many companies are perhaps revising lower their capital expenditure. This would be consistent with the PMI data discussed in this week’s commentary.
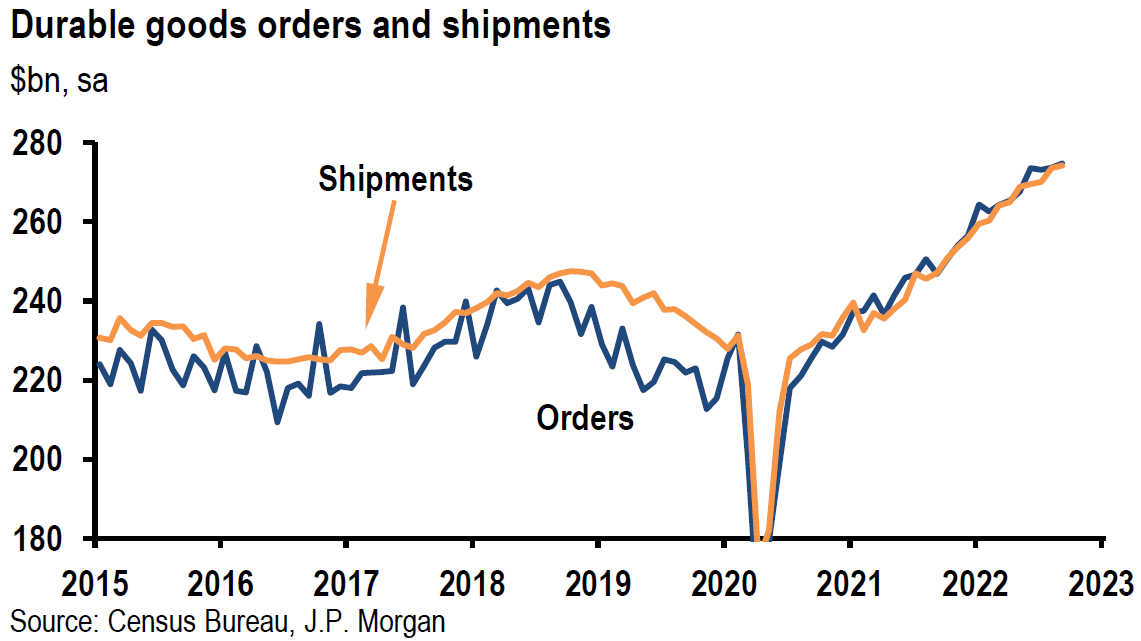
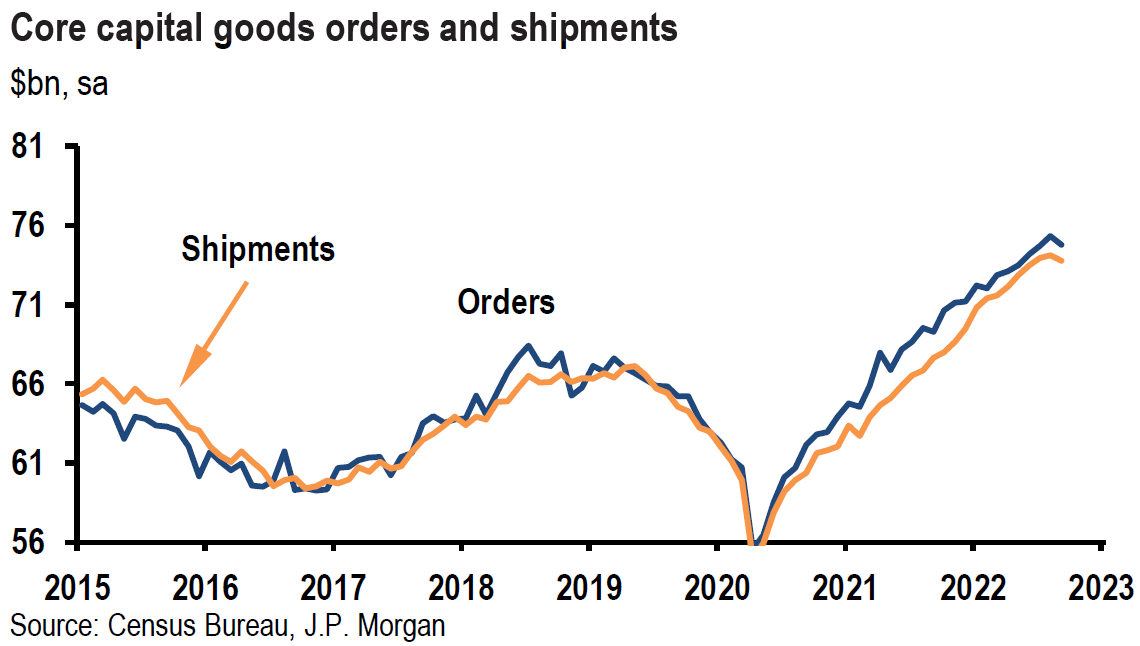
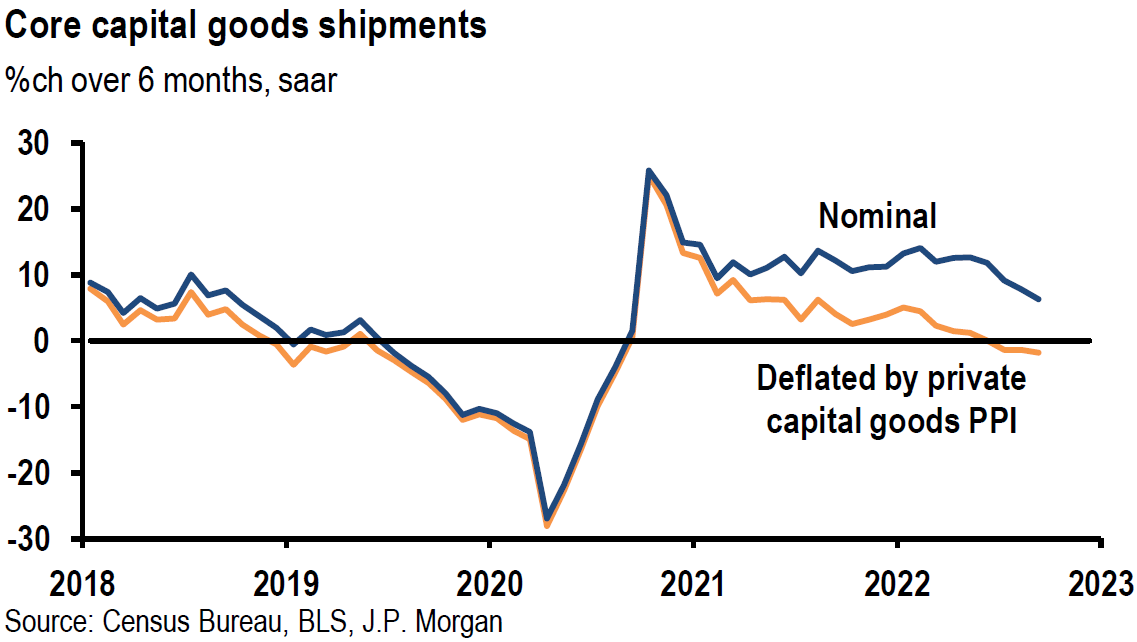
Source: JP Morgan, US: Core capital goods data weaken in September (10-27-2022)
Bottom Line
For the time being, we are maintaining our basic investment approach as expressed in last week’s commentary. We continue to prefer high quality big cap stocks that offer good balance sheets, as well as relatively stable cash flows and profit margins. A well-diversified portfolio for long term investors will be most likely the preferred approach.
We expect volatility across virtually all financial markets to continue. We were encouraged this week by limited spillover effects on to the overall equity markets from negative earnings reports and negative stock price reactions to such reports. We believe that lower interest rates and a lower USD played a vital role in this week’s many favorable equity trends. We will continue to monitor earnings announcements very closely and stock price reactions in our effort to decipher what is priced into financial markets.
We continue to expect the Fed to raise the federal funds rate by 75 bps at next week’s FOMC meeting and by 50 bps at the December meeting.

Definitions
Federal Funds Rate – The term federal funds rate refers to the target interest rate set by the Federal Open Market Committee. This target is the rate at which commercial banks borrow and lend their excess reserves to each other overnight.
U.S. Dollar Index (DXY) – The U.S. dollar index is a measure of the value of the U.S. dollar relative to a basket of foreign currencies.
Federal Open Market Committee (FOMC) – The Federal Open Market Committee (FOMC) is the branch of the Federal Reserve System that determines the direction of monetary policy specifically by directing open market operations. The committee is made up of 12 members: the seven members of the Board of Governors; the president of the Federal Reserve Bank of New York; and four of the remaining 11 Reserve Bank presidents on a rotating basis.
Manufacturing Purchasing Managers’ Index PMI – A manufacturing Purchasing Managers’ Index (PMI) is a survey-based economic indicator designed to provide a timely insight into changing business conditions in the goods-producing sector.
Services Purchasing Managers’ Index PMI – A services Purchasing Managers’ Index (PMI) is a survey designed to better understand changing business conditions in the wider economy. Coverage includes financial services, consumer services and all other business services.
Composite Purchasing Managers’ Index PMI – A composite Purchasing Managers’ Index (PMI) is the weighted average of manufacturing and service sector PMIs for a given geography or economy.
Basis Points (bps) – A basis point is one hundredth of one percent, used chiefly in expressing differences of interest rates.
Mega Cap – Mega cap is a designation for the largest companies in the investment universe as measured by market capitalization. While the exact thresholds change with market conditions, mega cap generally refers to companies with a market capitalization above $200 billion.
Russell 2000 – The term Russell 2000 Index refers to a stock market index that measures the performance of the 2,000 smaller companies. The Russell 2000 is managed by London’s FTSE Russell Group and is widely regarded as a bellwether of the U.S. economy because of its focus on smaller companies that focus on the U.S. market.
S&P 500 – The S&P 500 is a total return index that reflects both changes in the prices of stocks in the S&P 500 Index as well as the reinvestment of the dividend income from its underlying stocks.
Equal Weighted S&P 500 – Every stock in the index has the same weight, regardless of how large or small the company is. Therefore, even Apple will have the same weight as the smallest company that is a constituent in the S&P 500.
Cap Weighted S&P 500 – Similar to many stock indexes, the S&P 500 is a market capitalization-weighted index. The market capitalization of each stock is determined by taking the share price and multiplying it by the number of shares outstanding. The companies with the largest market capitalizations, or the greatest values, will have the highest weights in the index.
Technology Sector – The technology sector is the category of stocks relating to the research, development, or distribution of technologically based goods and services. This sector contains businesses revolving around the manufacturing of electronics, creation of software, computers, or products and services relating to information technology.
Communication Services Sector – The Communications Services Sector contains companies that provide communications services primarily through a fixed-line, cellular, wireless, high bandwidth and/or fiber optic cable network.
Consumer Discretionary Sector – Sector classified by goods and services that are considered non-essential by consumers, but desirable if their available income is sufficient to purchase them.
Flash Composite PMI – The flash Composite Purchasing Managers’ Index (PMI) provides an early estimate of current private sector business activity by combining information obtained from surveys of the manufacturing and service sectors of the economy.
Flash Services PMI – Flash services PMI is an early estimate of the Services Purchasing Managers’ Index (PMI) for a country, designed to provide an accurate advance indication of the final services PMI data.
Flash Manufacturing PMI – Flash Manufacturing PMI is an estimate of manufacturing for a country, based on about 85% to 90% of total Purchasing Managers’ Index (PMI) survey responses each month.
Initial Unemployment Insurance Claims – Initial claims are new jobless claims filed by U.S. workers seeking unemployment compensation, included in the unemployment insurance weekly claims report.
Continuing Claims – Continuing claims track the number of U.S. residents filing for ongoing unemployment benefits in a given week. Continuing claims measure ongoing unemployment benefits, which is in contrast to initial claims, which track new filings for benefits.
Durable Goods – Durable goods derive their name from the fact that they last in value for a relatively long time. An individual’s wealth is preserved by spending a high proportion of their income on durable, investment, or capital goods, because the goods retain their economic value for longer periods of time.
Real GDP – Real gross domestic product (GDP) is an inflation-adjusted measure that reflects the value of all goods and services produced by an economy in a given year. Real GDP is expressed in base-year prices. It is often referred to as constant-price GDP, inflation-corrected GDP, or constant dollar GDP. Put simply, real GDP measures the total economic output of a country and is adjusted for changes in price.
Headline PCE Inflation – A measure of the prices that people living in the United States, or those buying on their behalf, pay for goods and services. The PCE price index is known for capturing inflation (or deflation) across a wide range of consumer expenses and reflecting changes in consumer behavior.
Core PCE Inflation – A measure of the prices that people living in the United States, or those buying on their behalf, pay for goods and services that excludes food and energy prices. The core PCE gives a more accurate reading of inflation because food and energy are very volatile parts of the economy.
Eurozone – The eurozone, officially known as the euro area, is a geographic and economic region that consists of all the European Union countries that have fully incorporated the euro as their national currency.
IMPORTANT DISCLOSURES
The views and opinions included in these materials belong to their author and do not necessarily reflect the views and opinions of NewEdge Capital Group, LLC.
This information is general in nature and has been prepared solely for informational and educational purposes and does not constitute an offer or a recommendation to buy or sell any particular security or to adopt any specific investment strategy.
NewEdge and its affiliates do not render advice on legal, tax and/or tax accounting matters. You should consult your personal tax and/or legal advisor to learn about any potential tax or other implications that may result from acting on a particular recommendation.
The trademarks and service marks contained herein are the property of their respective owners. Unless otherwise specifically indicated, all information with respect to any third party not affiliated with NewEdge has been provided by, and is the sole responsibility of, such third party and has not been independently verified by NewEdge, its affiliates or any other independent third party. No representation is given with respect to its accuracy or completeness, and such information and opinions may change without notice.
Investing involves risk, including possible loss of principal. Past performance is no guarantee of future results.
Any forward-looking statements or forecasts are based on assumptions and actual results are expected to vary from any such statements or forecasts. No assurance can be given that investment objectives or target returns will be achieved. Future returns may be higher or lower than the estimates presented herein.
An investment cannot be made directly in an index. Indices are unmanaged and have no fees or expenses. You can obtain information about many indices online at a variety of sources including: https://www.sec.gov/fast-answers/answersindiceshtm.html or http://www.nasdaq.com/reference/index-descriptions.aspx.
All data is subject to change without notice.
© 2024 NewEdge Capital Group, LLC


