

Weekly Summary: July 11 – July 15, 2022
Key Observations:
- Financial markets continue to price in a greater likelihood of recession risks, particularly in Europe. Higher-than-expected U.S. June CPI and PPI readings will put increasing pressure on the Federal Reserve (Fed) to increase the federal funds rate by at least 75 basis points (bps) at their end of July meeting. Financial markets initially priced in a great likelihood of a 100 bps hike this month. But after Fed Governor Waller on Thursday commented that aggressive market pricing in of a 100 bps hike was “kind of getting ahead of itself,” the probability of a 100 bps hike quickly declined from 80% to 44%. After the University of Michigan’s preliminary five-year inflation outlook declined from 3.1% in the prior survey to 2.8%, we view a 75 bps hike as more likely at the Fed’s upcoming late July meeting.
- The dramatic recent decrease in food and energy prices argue for a decrease in headline inflation rates in July. As an example, the price of wheat has declined from as much as a 66% YTD gain in May to a gain of 3.8% YTD this month. Given the encouraging upward reversal in crude oil prices on Thursday, we foresee a more unpredictable energy price trajectory.
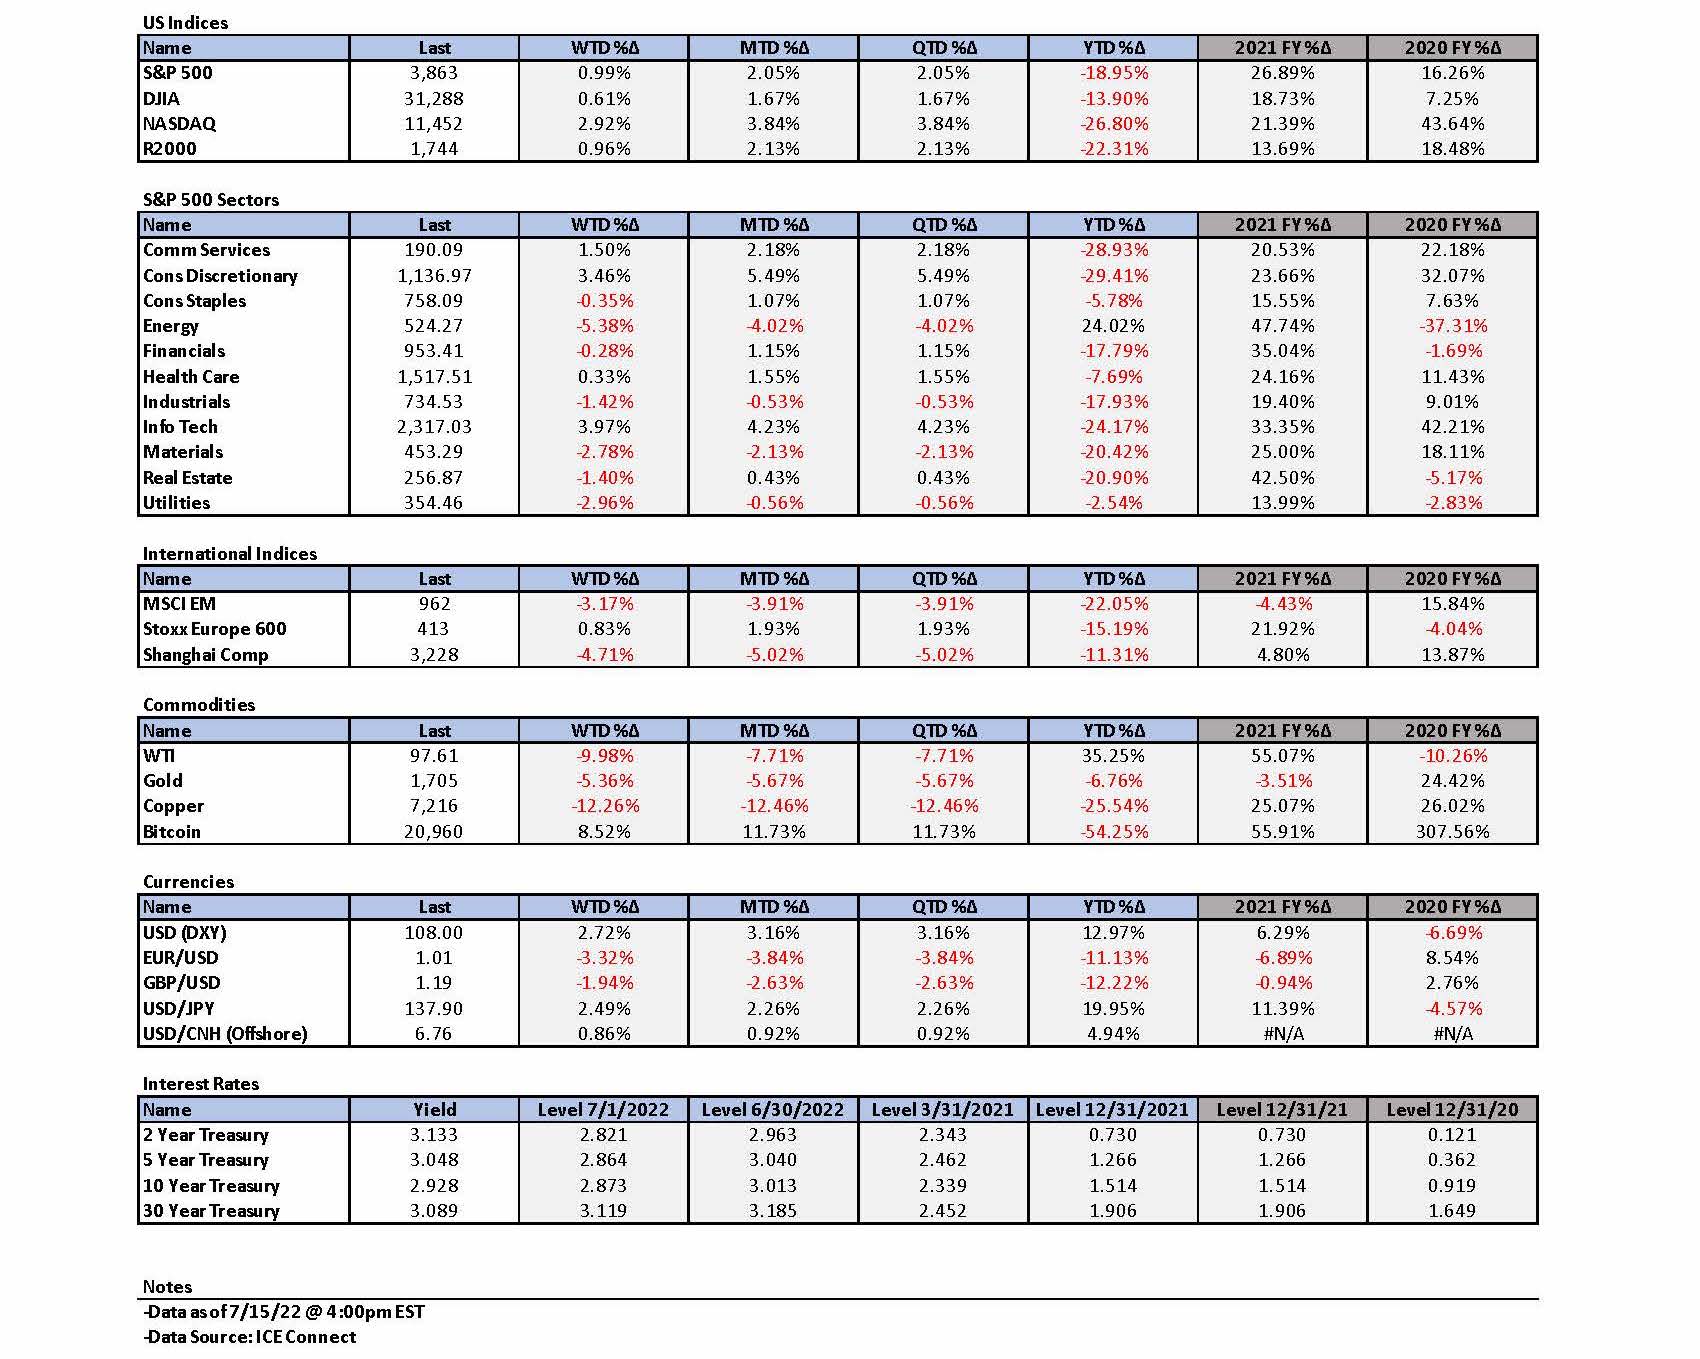
- Financial market volatility was on display clearly on the day that June CPI was announced, particularly in regard to the 10-year Treasury yield curve. The two-to-10-year yield curve inverted over 20 bps, which is the steepest inversion level since 2000. Lower real yields that day enabled the Nasdaq index to outperform other major U.S. stock indexes. Nasdaq continued its outperformance on Thursday. Since mid-June, the 10-year Treasury yield seems to have vacillated between inflation and recession concerns.
- We will be “watching” for incoming economic data as we retain our “data dependency” in formulating our investment views. Additionally, we also will be watching financial market reaction to each bit of new data to provide clues to us of which sectors and/or stocks to favor. The more difficult part of this investment approach will be to determine the duration of any trend that we might “spot.”
The Upshot: Our investment posture continues to be very closely aligned to that expressed in last week’s commentary. We remain convinced that we have not reached a sustainable bottom in U.S. stocks. The recent outperformance of Nasdaq relative to other major U.S. stock indexes has enhanced our conviction on high quality tech stocks, including a few of the mega-cap growth stocks on a very selective basis, as well as selected “chip” stocks. Stock selection remains key to relative outperformance. We are well aware that U.S. tech companies have a very high concentration of their revenues overseas and that their financial performance will suffer when their foreign earnings are translated back into U.S. dollars (USD). But everyone else is also very aware of this. Therefore, we postulate that at least some of this knowledge is already priced into the market. Everything else being equal, we would be buyers on stock price decreases that were based on foreign exchange fluctuations. Although we don’t expect USD weakness in the near term, we maintain our belief that the eventual next big USD move will be to the downside. We also are aware that many analysts and investors believe that the stocks which outperformed in the last “bull” cycle are very unlikely to outperform in the next up market cycle. But given the indications of weakening U.S. and global economies, some of our favored high-quality tech stocks should have more predictable earnings relative to many other companies. Many of our favored companies in this sector have very healthy balance sheets and relatively more stable margins as well. In general, many of our favored “growth”-type stocks at the recent depressed stock prices are beginning to look more like “value”-type stocks. Our preference for health care stocks continues, including selected biotech shares. The dramatic upward reversal of crude oil prices on Thursday encourages our conviction that at that day’s closing prices; many energy stocks presented compelling risk/reward opportunities from the long side. We also have observed that many investors have been waiting until after President Biden’s visit to Saudi Arabia late this week to invest in the energy sector. Investors were awaiting a potential announcement indicating a “deal” with the Saudis that would somehow increase oil supplies and/or production. We wish to reiterate that since our investment view is that we have not yet reached a sustainable bottom in U.S. equities, there is a great likelihood that whatever stock is purchased at today’s prices will trade lower at some point. But we also believe that long term investors will be pleased in the medium to long-term.
We still are waiting for downward revisions of earnings and margins for many companies. We believe that financial market volatility will persist for at least as long as the Russia-Ukraine war endures. In general, we continue to favor big cap high-quality stocks with strong balance sheets, as well as relatively stable cash flows and margins. We will search across all sectors to find stocks that meet these characteristics. We also favor at least some commodity exposure in a diversified portfolio.
We are “Watching”
As reiterated in our last weekly commentary, “we will remain ‘data-dependent’ in our investment approach and will try to maintain an “open mind.’” This attitude is expressed in the refrain of the song “Every Breath You Take” by the “Police.” “Every move you make; Every step you take; I’ll be watching you.” We will continue to scrutinize carefully incoming economic data and news, as well as observe financial market reactions to such information. Last week, we described some of the economic data that we were “watching” and that in our opinion it generally showed weakening global economies accompanied by elevated and mostly rising rates of inflation. Our overall view of rising stagflation or recession probabilities was confirmed further by this week’s economic data.
Will Q2 be Another Quarter of Negative Economic Growth?
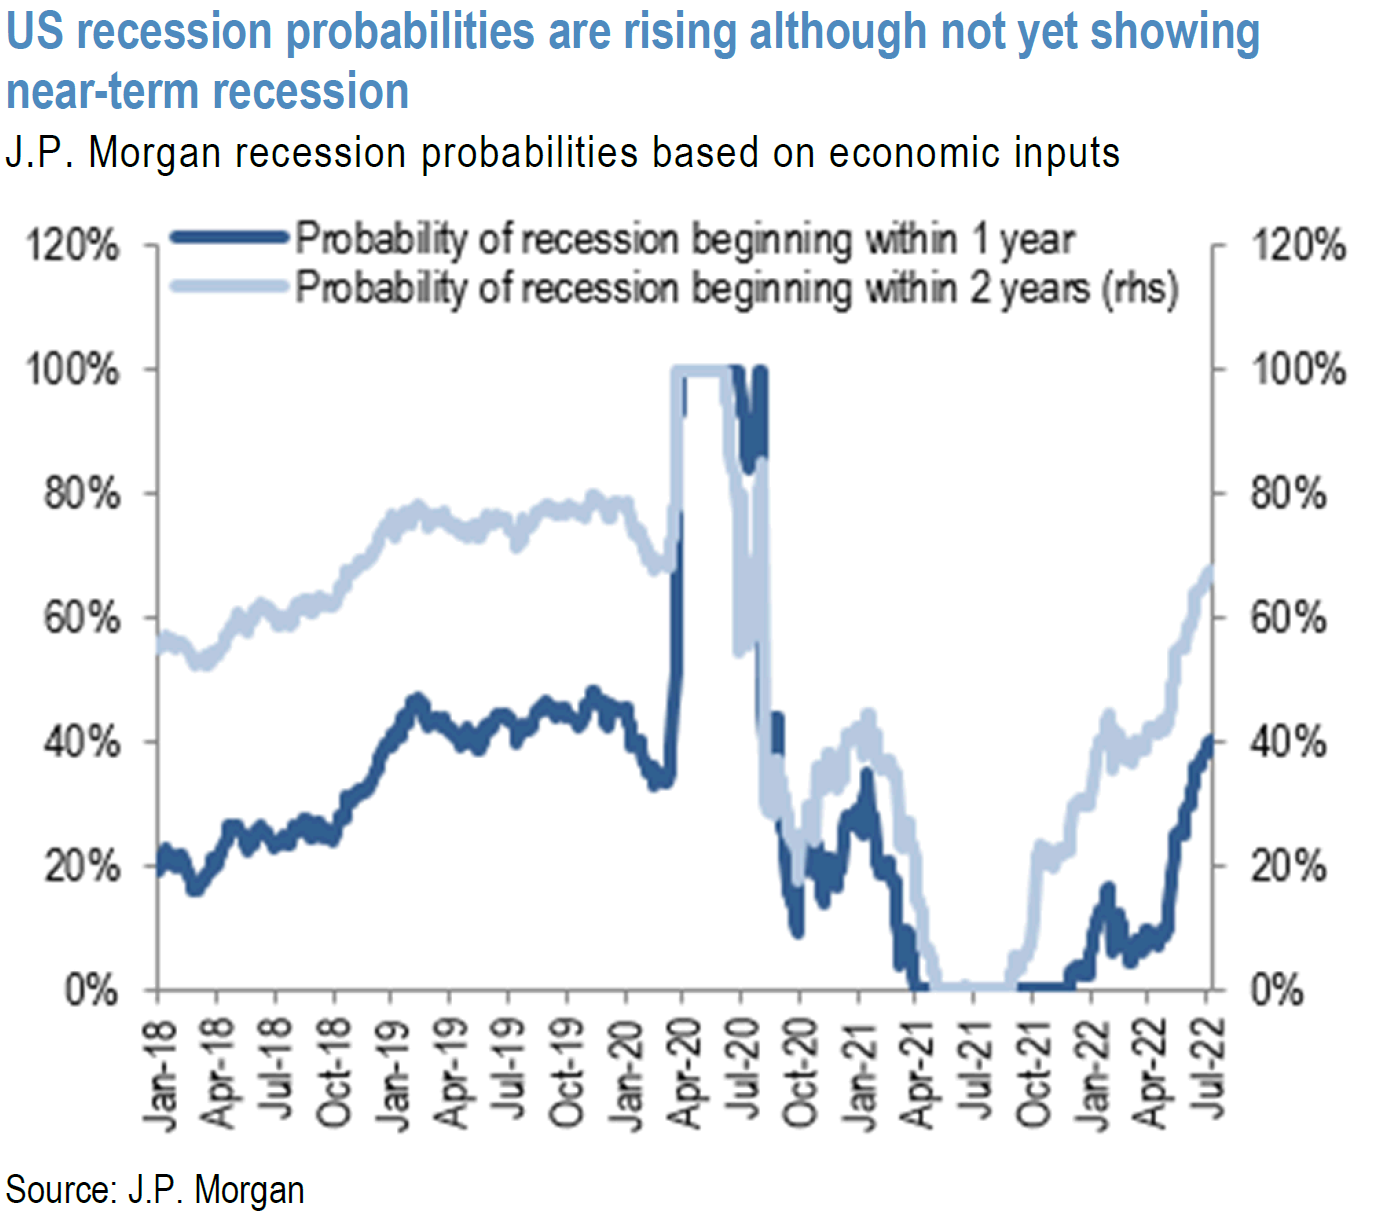
We have stated in many of our recent commentaries that markets are reflecting increased probabilities of recession. A recession can be defined in various ways. The classic definition of a recession is two consecutive quarters of negative growth – actual contraction of an economy versus its prior quarter. The U.S. economy did in fact contract in Q1 2022 – mostly due to an increasing U.S. trade deficit and inventory adjustments. Many analysts have taken down their estimates of Q2 growth, some of which are perilously close to going negative. In fact, the widely followed GDPNow forecasting model of the Federal Reserve Bank of Atlanta (Atlanta Fed) forecasted as of July 8 a 1.2% negative real GDP growth in Q2. One of the biases of this modeling tool is that it tends to overstate trade deficit momentum, which has recently begun to improve for the U.S. This is not an official forecast by the Atlanta Fed but is an updated estimate based on the latest currently available economic data.
Recession Defined – Don’t Think We’re in One – At Least not Yet
The official U.S. definition of a recession is entrusted to the National Bureau of Economic Research (NBER), which defines it as a “significant decline in economic activity that is spread across the economy and lasts more than a few months.” Included among the factors considered by the NBER in assessing the timing of a recession are GDP, gross domestic revenue, industrial production, personal income less transfer payments, gross domestic income, and nonfarm payrolls. Most of these indicators remain positive. The labor market is considered as a lagging indicator. In the post-World War II era, 1947 was the only time that two consecutive negative quarters were not declared a recession. That year was characterized by a substantial drag from net exports (trade deficit) and inventory accumulation while consumption growth was positive. This sounds very much like the current environment. We have highlighted the importance of both manufacturing and services Purchasing Managers Indexes (PMIs) in helping us determine the onset of economic downturns. The new orders index, backlogs, consumer and business expectations are all very good leading indicators. Initial jobless claims is another example of a leading indicator. The latest initial jobless claims continued a recent trend of increases that could be a precursor to a less tight labor market. We have “watched” every “move” in this data very carefully and will continue to do so. We also “watch” closely the earnings reports and guidance from company managements. Under current circumstances, we are especially watchful for any trends and commentary on profit margins.
Increased Risks of Recession
Last week’s summary of economic data pointed to increased risks of a recession. We noted sluggish consumer spending patterns. New orders for the U.S. contracted in both manufacturing PMI surveys and declined in services as well. Employment contracted in both surveys. It appeared that higher interest rates began to affect demand, particularly in the manufacturing sector. Fed policy actually does work. Business confidence for future conditions dropped to their lowest levels since 2020. A drop in mortgage demand and rising housing inventories also was cited as an indicator of a slumping economy. Once again, higher interest rates were clearly playing a significant role. Consumer confidence continued to deteriorate in response to elevated inflation and higher rates.
Source: J.P. Morgan Global Emerging Markets Research: EM concerns add recession risks to tightening of financial conditions (7/11/2022)
Higher than Expected CPI
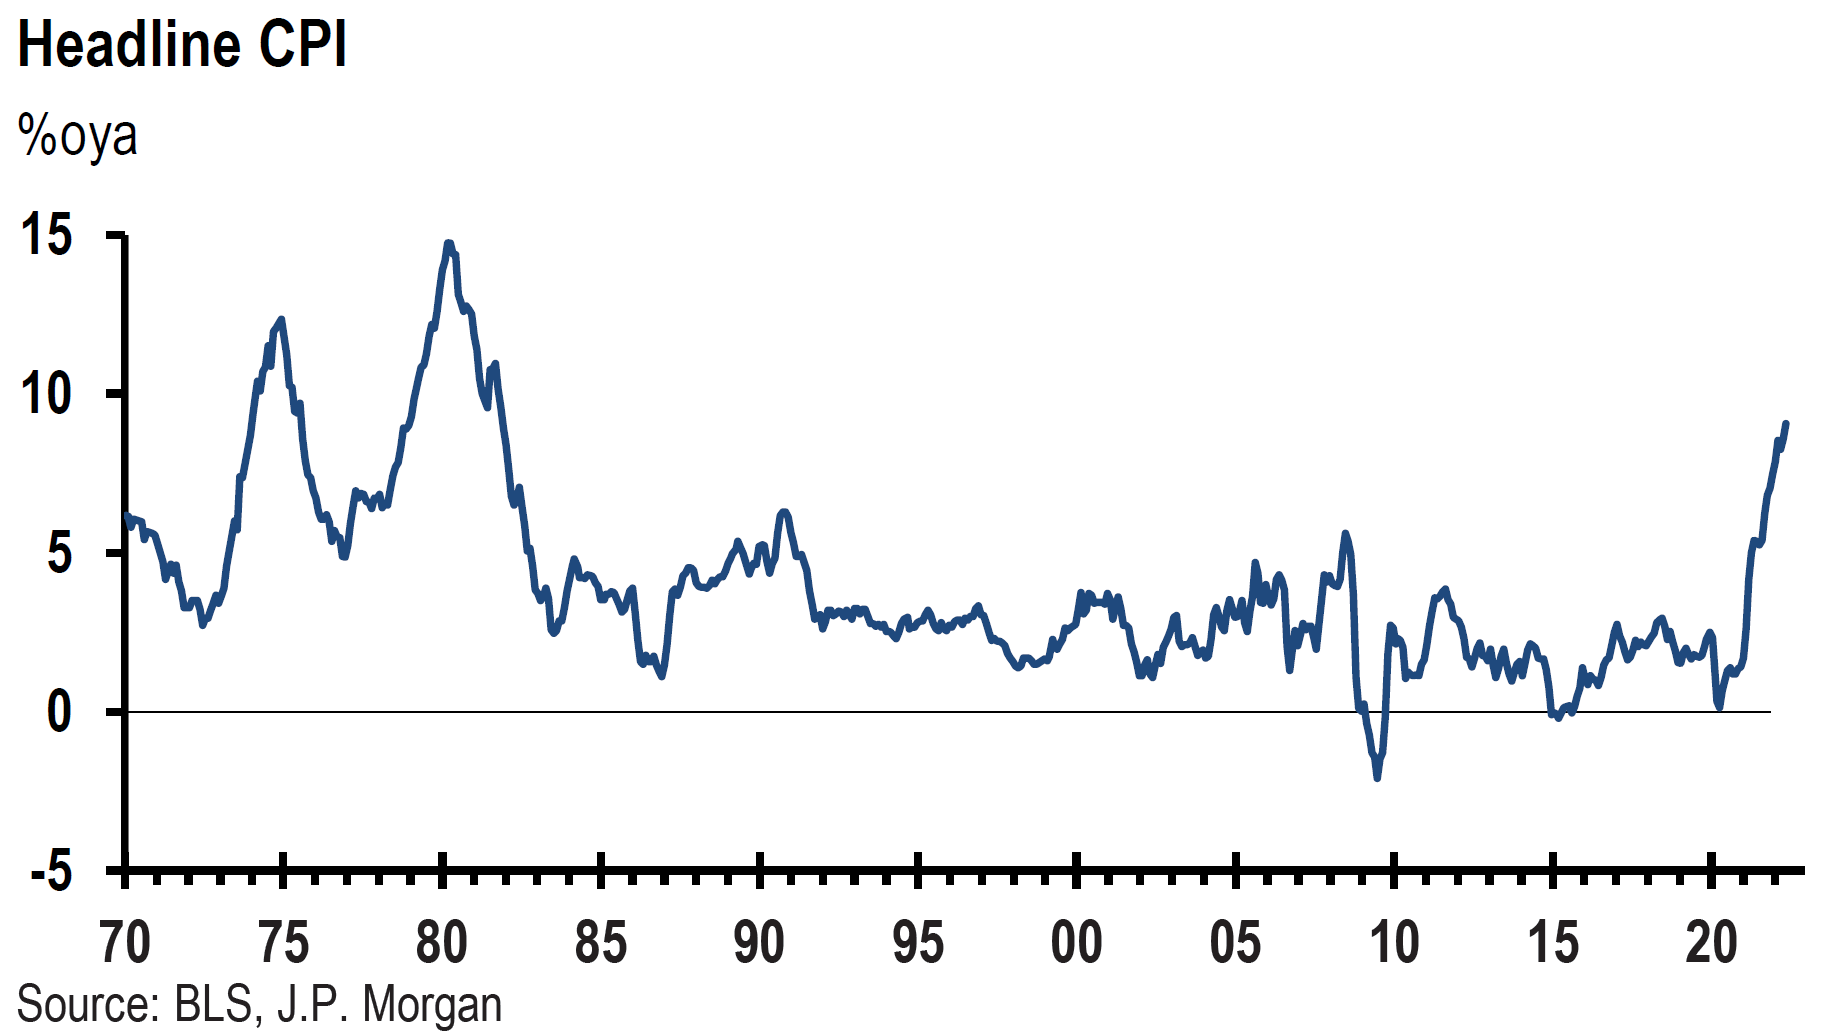
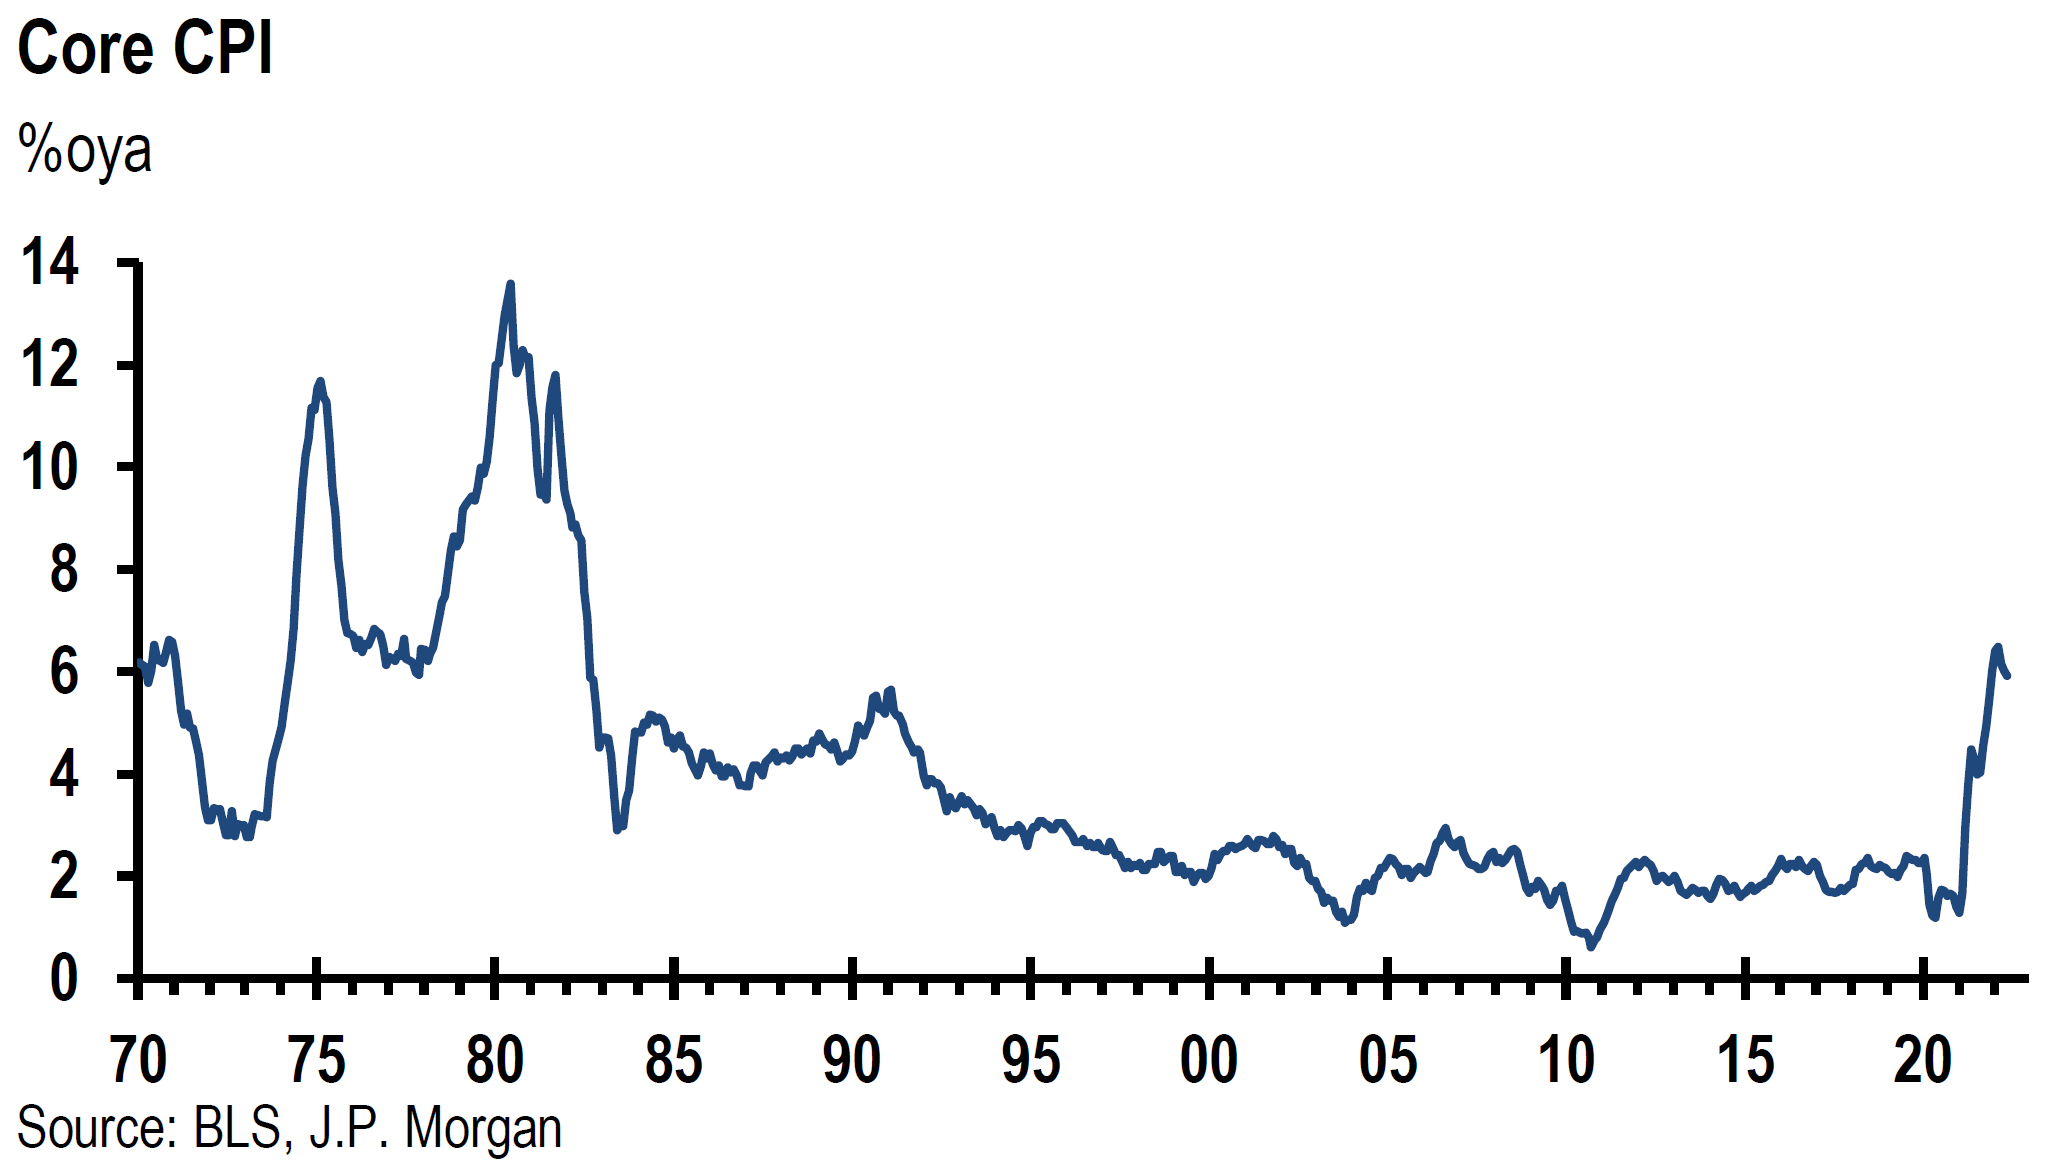
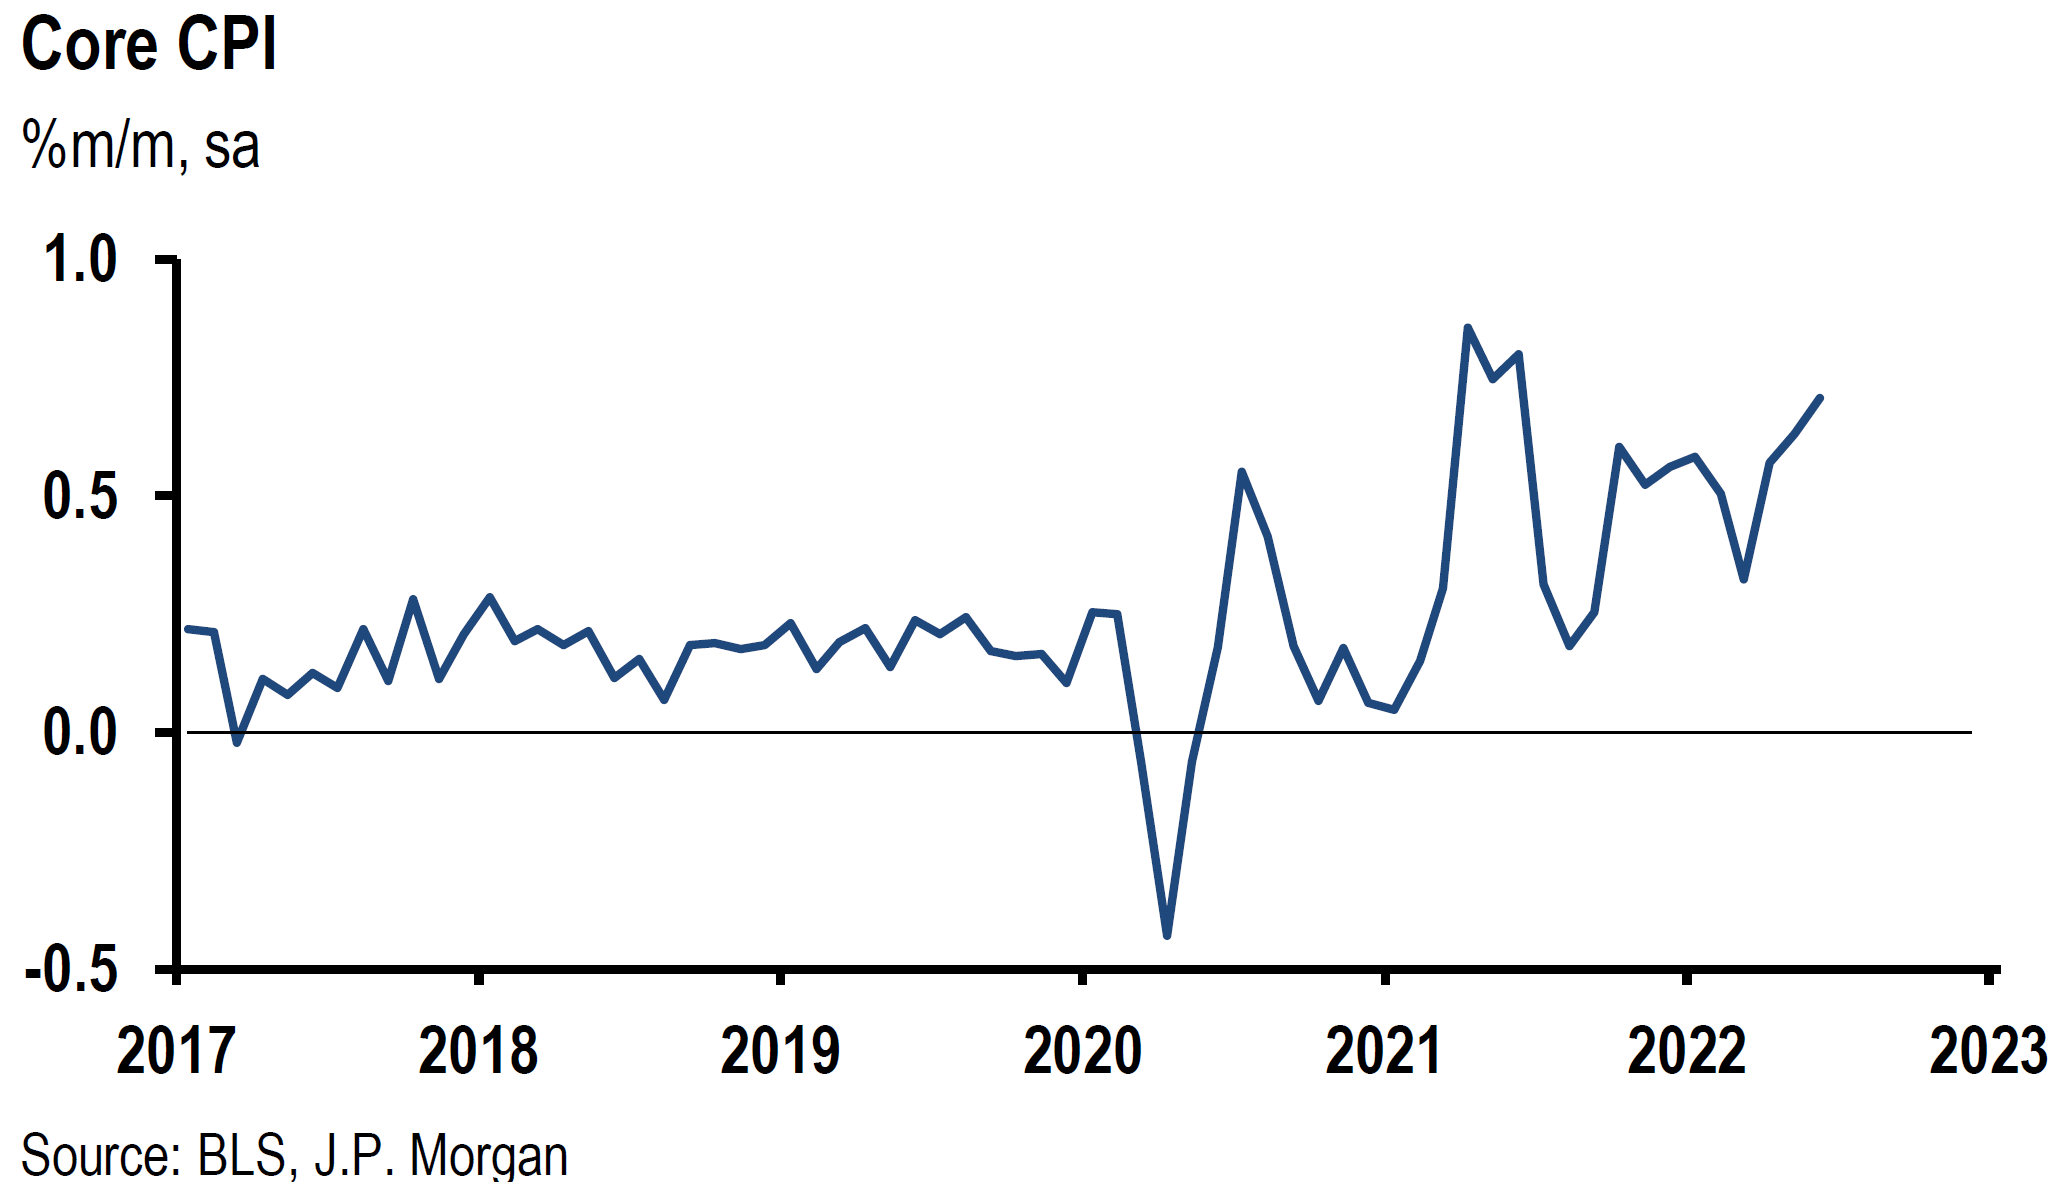
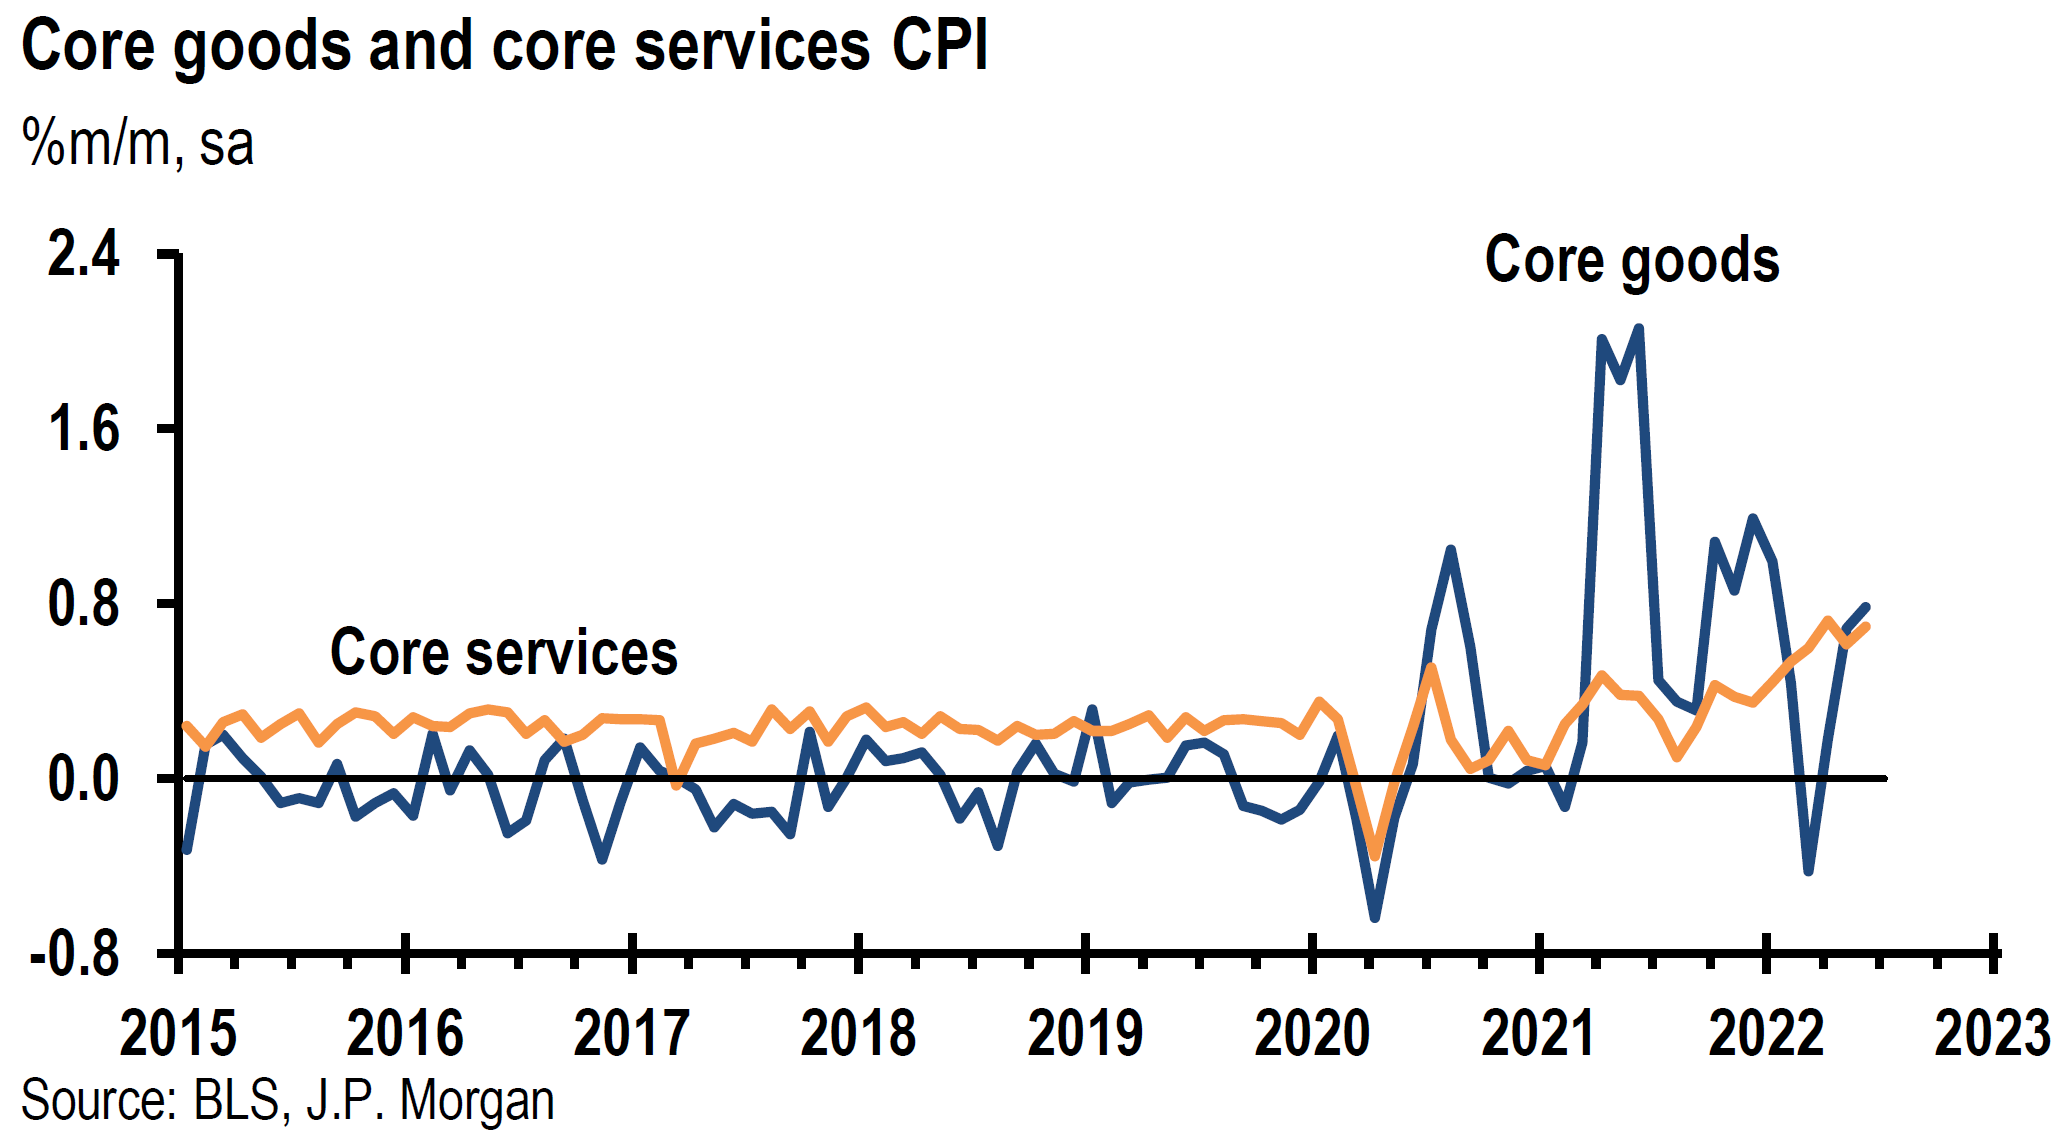
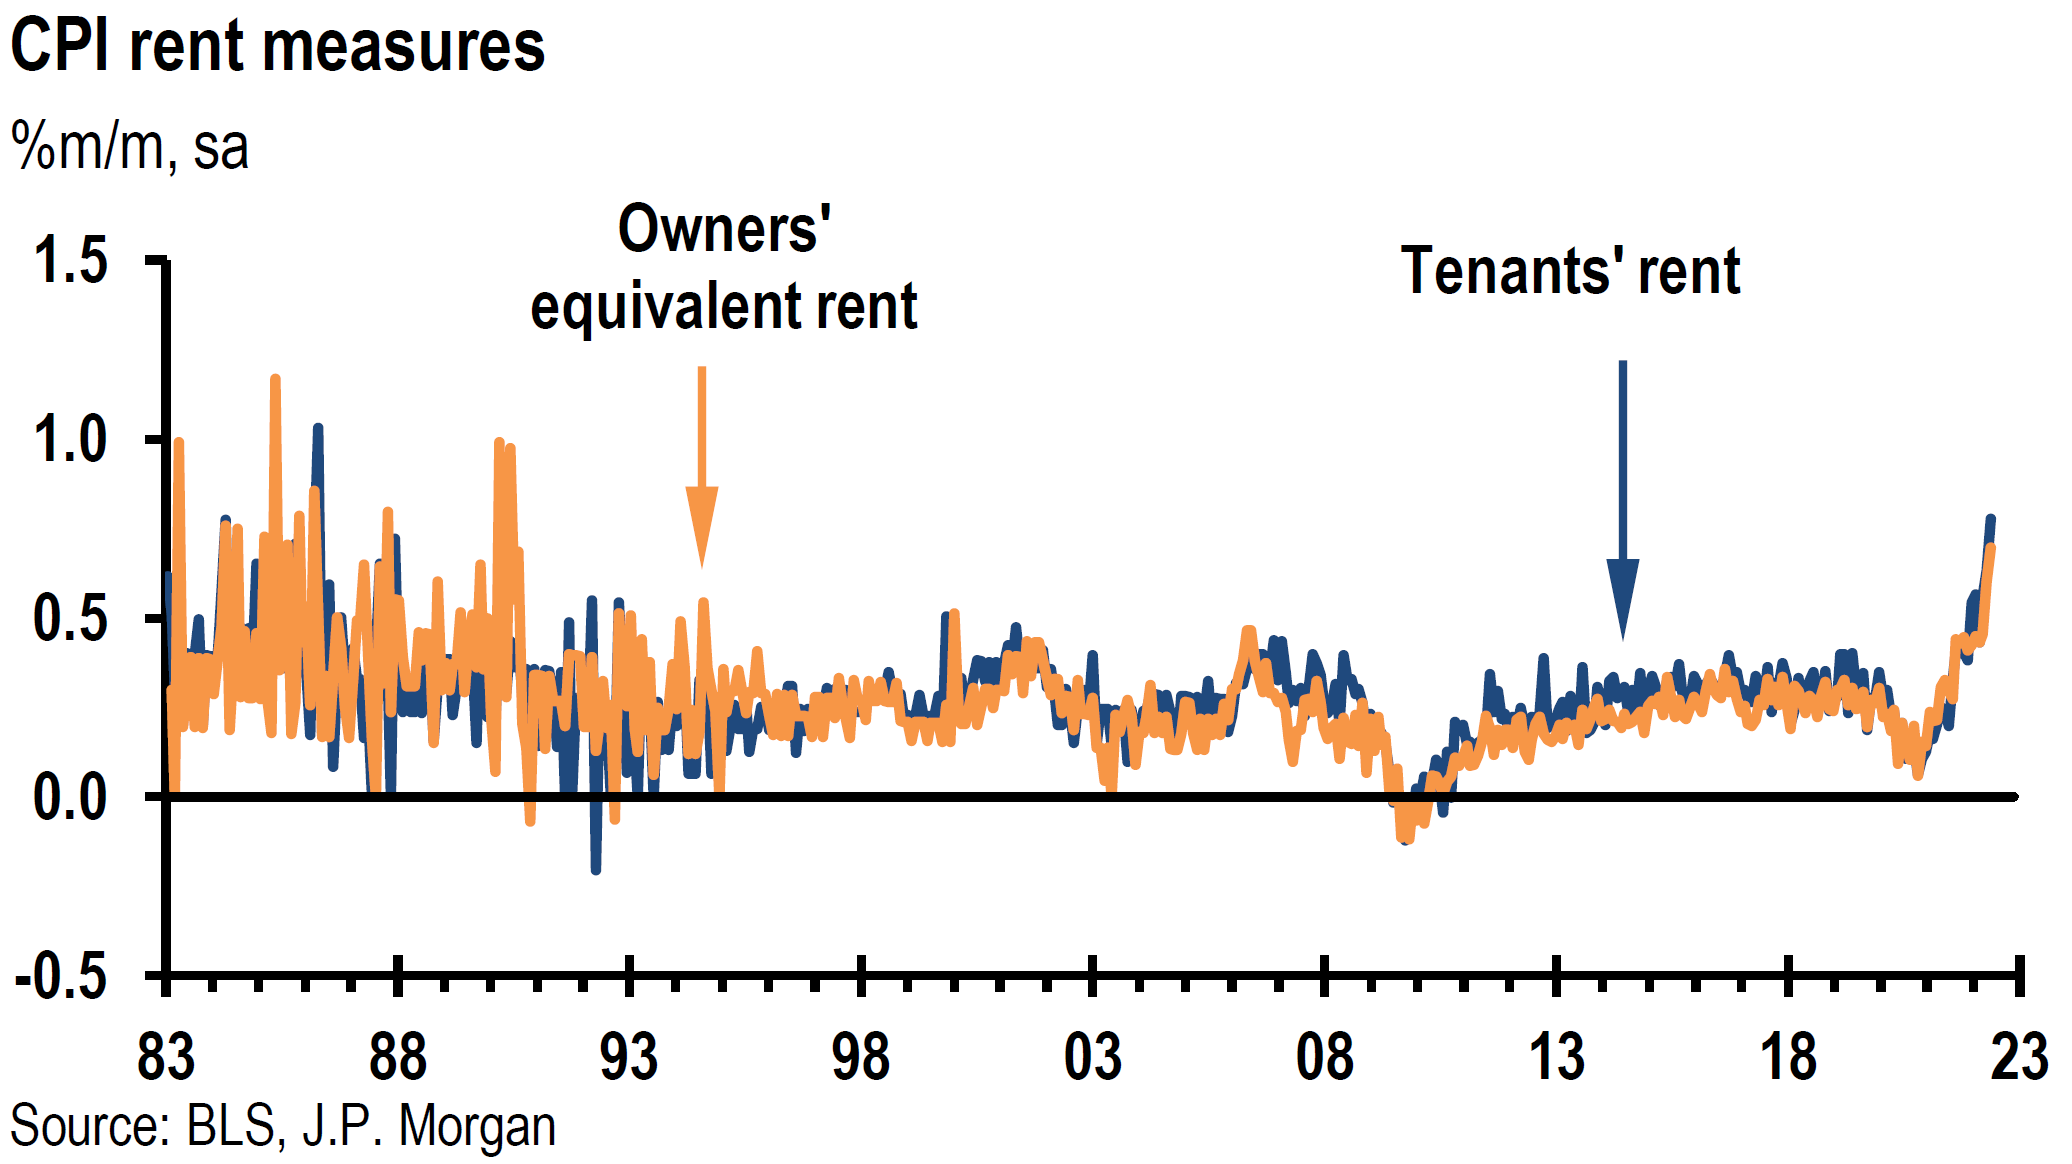
Announced mid-week, the higher-than-expected Consumer Price Index (CPI) for June only added to consumers’ anxiety since recent surveys of consumer sentiment have consistently shown that elevated inflation remains consumers’ principal concern. The headline CPI for June rose 9.1% year-over-year (y/y) compared to vs. 8.6% in May, which was higher than the 8.8% expectation and highest since November 1981. On a monthly basis, CPI rose 1.3% vs 1.0% in May and 1.1% expected. This was the largest monthly increase since 2005. Core CPI – excluding food and energy – increased 5.9% y/y versus 6.0% in May, 5.7% expected and a high of 6.5% in March. The core rose by a better-than-expected monthly gain of 0.71%. Inflation was very broad based. On July 13, Goldman Sachs observed that 42% of items in the core CPI basket has a six-month annualized inflation rate of more than 6%. Indexes for gasoline, shelter and food were the largest contributors to headline inflation. The monthly energy gain in CPI of 7.5% accounted for nearly half of the monthly headline gain. The 11.2% monthly price of gasoline gain was included in the energy component. The 59.9% y/y gasoline prices gain was the largest since 1980. The food component of CPI rose 1.9% vs. 1.2% in May m/m, and increased 10.4% y/y. The 13.75% electricity price annual increase was the most since 2006. Rent prices rose 0.8% m/m and owners’ equivalent rent rose 0.7%. The shelter index rose 5.6% y/y – the largest annual gain since 1991. The shelter component of core inflation is considered generally to be relatively “sticky” or persistent. Shelter costs account for about one-third of core inflation measures.
Source: J.P. Morgan US: Strong CPI keeps pressure on households and the Fed (7/13/2022)
Dramatic Decreases in Commodity Prices – Particularly Energy Prices – But for How Long?
Given the dramatic decreases in July energy prices, we assume that the headline inflation measures will begin to diminish. The U.S. average price of gasoline in June topped out at over $5 per gallon. This price dropped to the mid-$4 range in July, which was still about $1.5 per gallon higher than one year ago. Food inflation should also come down as corn and wheat prices, along with other items, have decreased as recession fears took their toll on many commodity prices. We anticipate that commodity prices will continue to fluctuate, and that headline inflation will become even more unpredictable. Furthermore, we are most confident of crude prices resiliency after their severe downturn. The crude prices reversal from a severe drop to roughly unchanged on Thursday this week was an encouraging sign. According to CNBC on July 13, Chevron CEO Michael Wirth stated that the crude oil market remained “physically tight” and that he therefore believed that the recent price declines crude oil prices would be relatively short lived. The general decline in financial markets liquidity along with technical and “positioning” of market participants in the oil markets, were also instrumental most likely in recent oil price declines. On July 14, J.P. Morgan (JPM) seemed to agree with Mr. Wirth. JPM was rather confident that the Brent oil price should maintain a price over $80 per barrel for quite some time. Additionally, JPM retained an “overweight” on energy stocks, which it thought were pricing in a $60 per barrel level. We agree with JPM that at Thursday’s closing prices, we found many high-quality oil stocks to be trading at compelling risk/reward entry points for long term investors. Moreover, JPM also observed that oil demand weakened in only ten years since 1965. Along with many other commodity prices, energy prices could see a large increase in demand to the extent that China’s economy starts to recover. The Chinese June rebound was described more completely in last week’s commentary. We reiterate the caveat that much will depend on the evolution of China’s “dynamic” zero COVID-19 policies. The stability of China’s property sector might also play a dominant role in the trajectory of China’s economy and its appetite for commodities.
Financial Market Volatility on “CPI Day”
On the day of the CPI announcement, financial market volatility was rather remarkable. The initial reaction of the higher-than-expected CPI measures was a loss of 1.5% in S&P 500 futures, a 2.1% decline in Nasdaq futures and a greater-than 1% decrease in Dow Jones Industrial Average futures. Stocks rebounded generally from these depressed levels with the Nasdaq recouping most of its losses and outperforming the other two indexes. The Treasury market trading was even more unpredictable. The two-year Treasury yield held its gains and closed at 3.142%, versus a closing of 3.043% the prior day. Down from an intra-day high of 3.069%, the 10-year Treasury yield closed at 2.904%, compared to the prior day’s closing yield of 2.958%. The more-than 20 bps inversion of the two-year over the 10-year yield spread was the greatest since 2000. Over the past month, the 10-year yield has seemed to be most susceptible to mood swings between a shifting focus on inflation or recession concerns. On July 14, the Wall Street Journal noted that the 10-year yield has fluctuated since mid-June between almost 3.5% and 2.8%, depending on which set of concerns were the focus of the day. Market indicators initially priced in a much greater probability of a 100 bps Fed hike in the federal funds rate at the upcoming Fed meeting later this month. That probability of a 100-bps rate increase was reinforced after the Atlanta Fed president Bostic and Cleveland Fed president Mester expressed their opinions that the Fed should hike by at least 75 bps and they were open to a 100-bps hike. Mester said that the June CPI report was “uniformly bad” and that there was “no good news in that report at all.” She reiterated that the Fed’s priority was to bring inflation down even while “knowing the risks of recession have gone up.” When asked about the possibility of a 100-bps hike in July, Bostic replied that “everything is in play.” The implied odds of a 100bps hike increased from just over 50% to almost 70%. A 100-bps hike would be the highest since the early 1980s. Fed Governor Waller’s comments the next day reduced the market’s expectation of a 100 bps hike in July to less than 50%.
Higher than Expected PPI
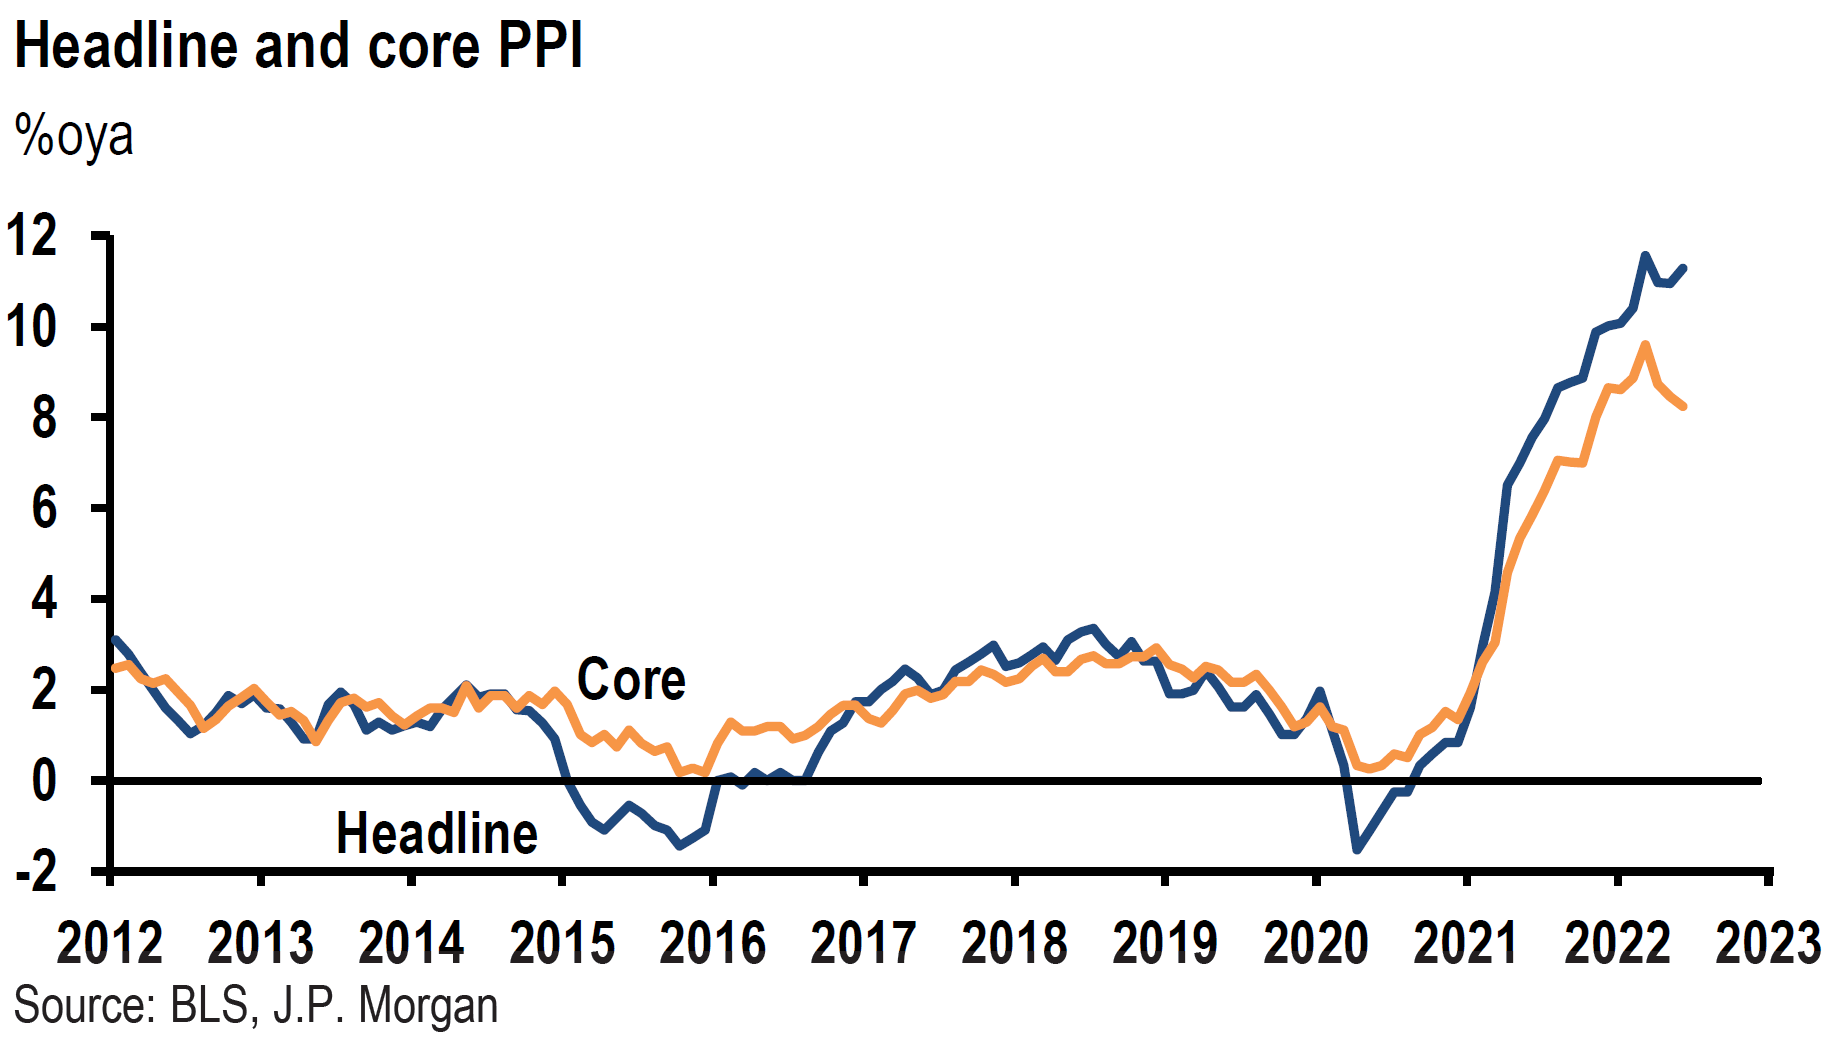
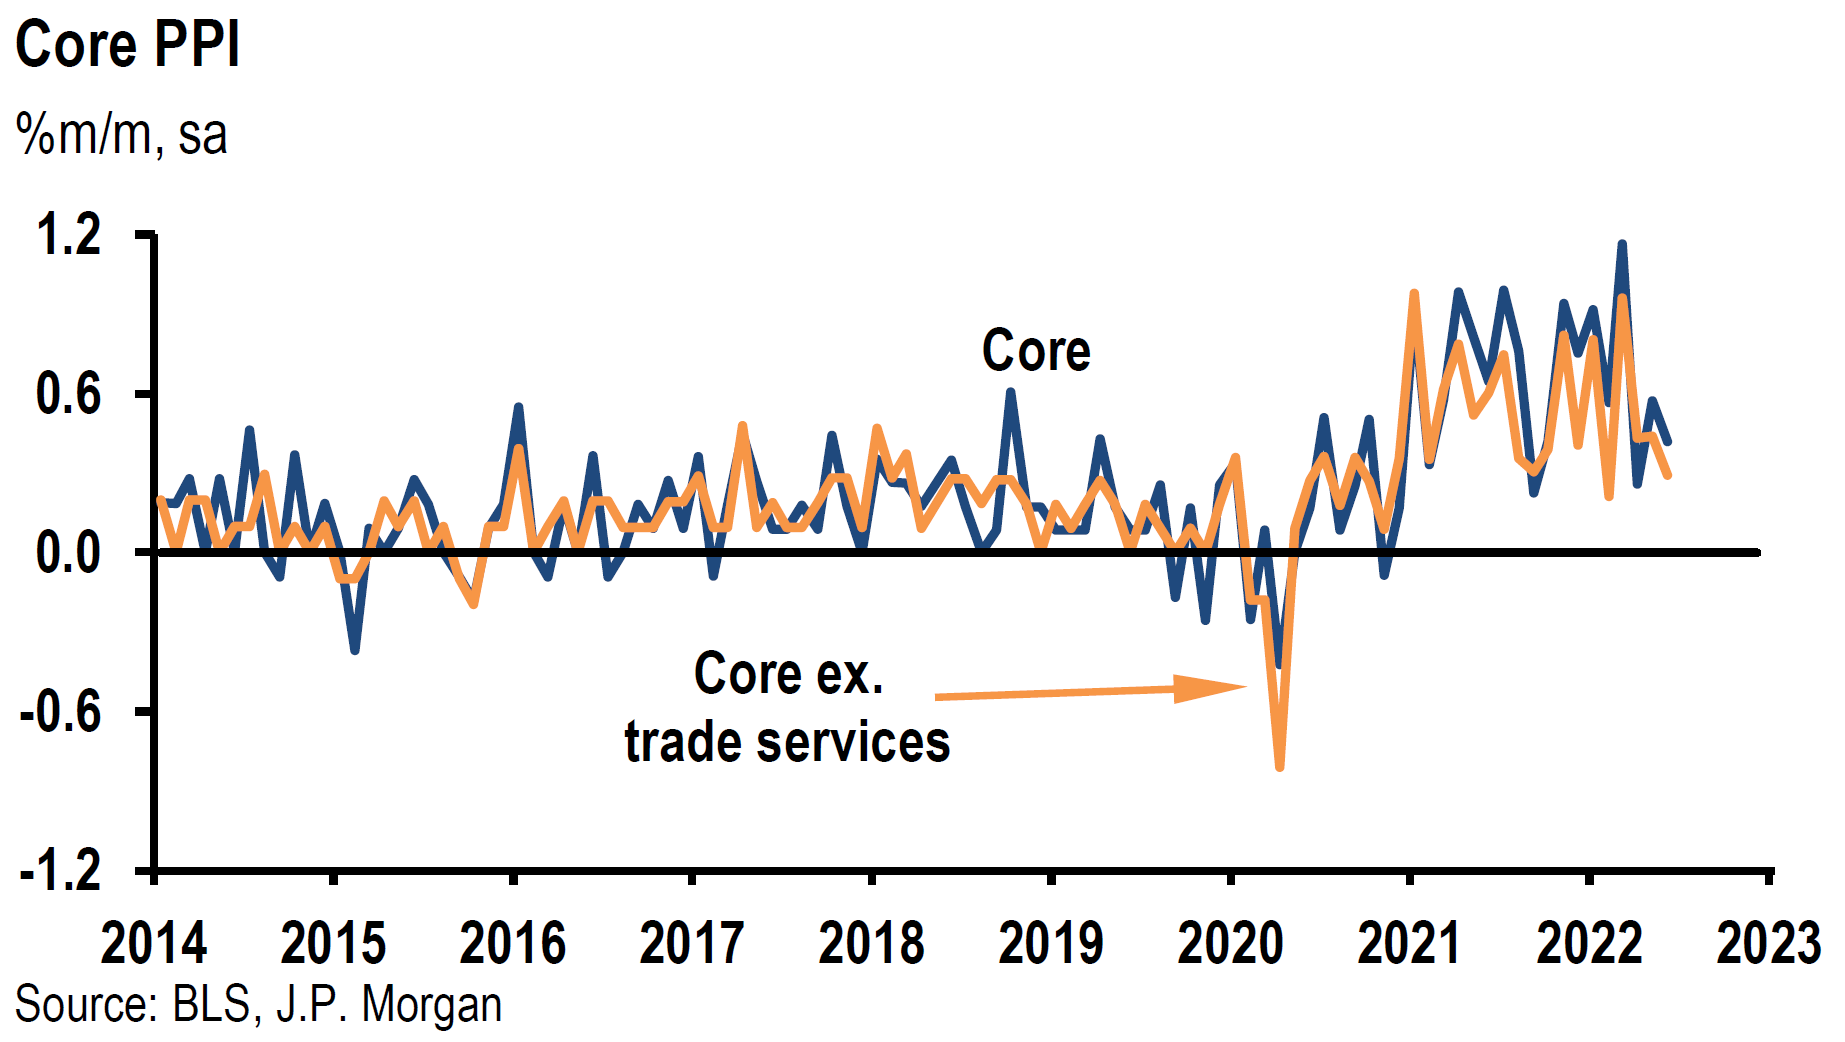
The U.S. Producer Price Index (PPI) for June was announced on Thursday. In general, the PPI numbers were higher than expected. The headline y/y increase of 11.3% – versus 10.7% expected and 10.9% for May – was close to the record March level of 11.6%. According to the Bureau of Labor Statistics (BLS), most of the increase in the headline reading was due to large increases in energy prices. The monthly increase in the headline reading increased 1.1% versus 0.8% expectations, 0.9% for May and 0.4% in April. Excluding food, energy and trade, the PPI increased 6.4% y/y versus 6.8% in May. The monthly gain was 0.3% versus expected 0.5%. Excluding food and energy, the PPI increased 8.2% y/y versus 8.1% expected. More than half of the monthly headline increase in PPI was attributable to gasoline that saw a monthly increase of 18.5%. Given the energy prices declines in July, we assume that headline PPI could show a large potential decrease from the June increases.
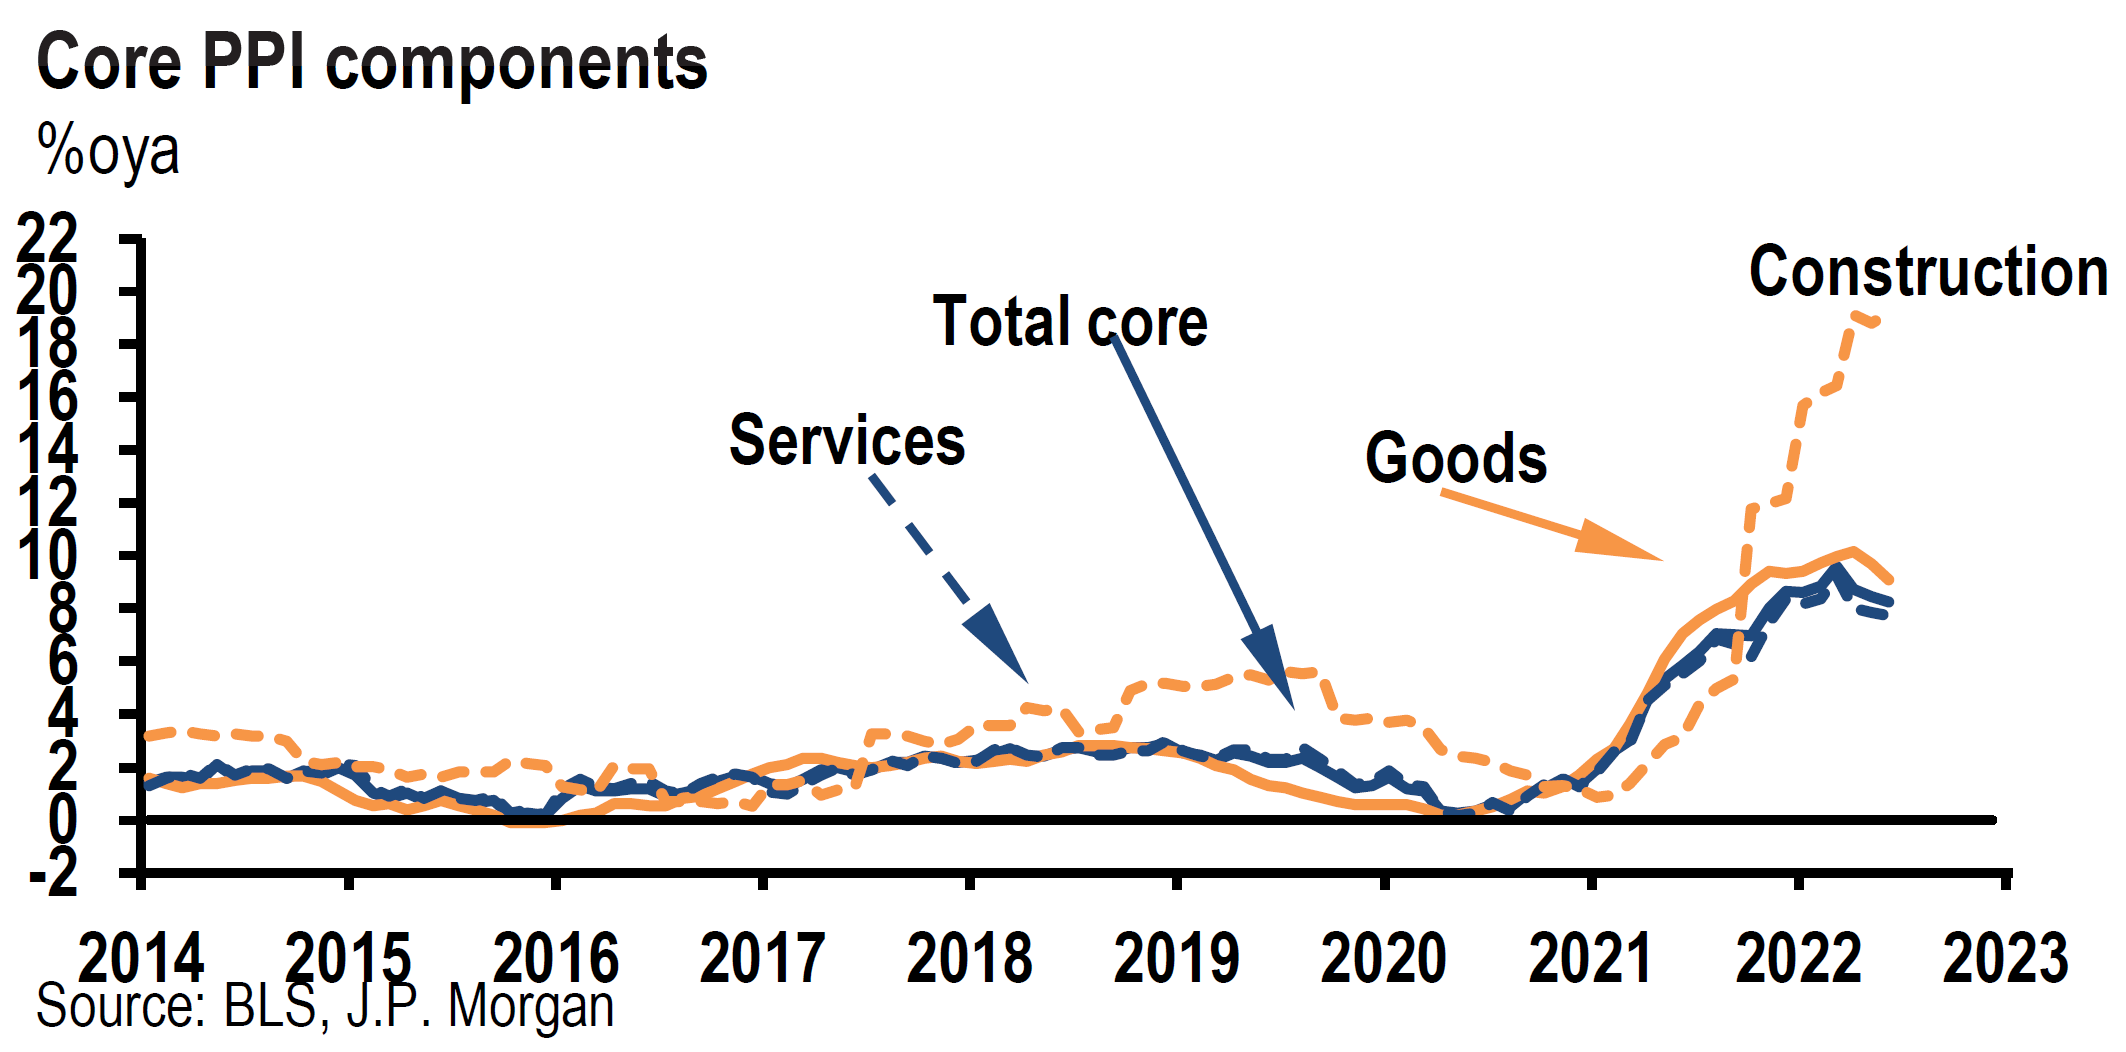
Source: J.P. Morgan US: June PPI boosted by jump in energy prices (7/14/2022)
Nasdaq Recent Outperformance
Most analysts attributed the Nasdaq Wednesday’s outperformance to a decrease in real interest rates that day. Even without such a tailwind, Nasdaq continued to outperform, and it outpaced the other major U.S. stock indexes on Thursday as well, closing with a very slight gain. The better-than-expected earnings, revenues and guidance from Taiwan Semiconductor helped the outperformance of semiconductor stocks in general. JPM and Morgan Stanley (MS) both missed on the top and bottom line and suspended their buybacks. MS recouped most of its losses for the day, whereas JPM did not. JPM announced an increase in its loan loss provisions. This will be a continued focus for bank stocks. Fears of recession might keep pressure on banks as they increase their loan loss provisions in anticipation of delinquencies. As always, the question remains, how much of the potential “bad” news is reflected in bank stock prices.
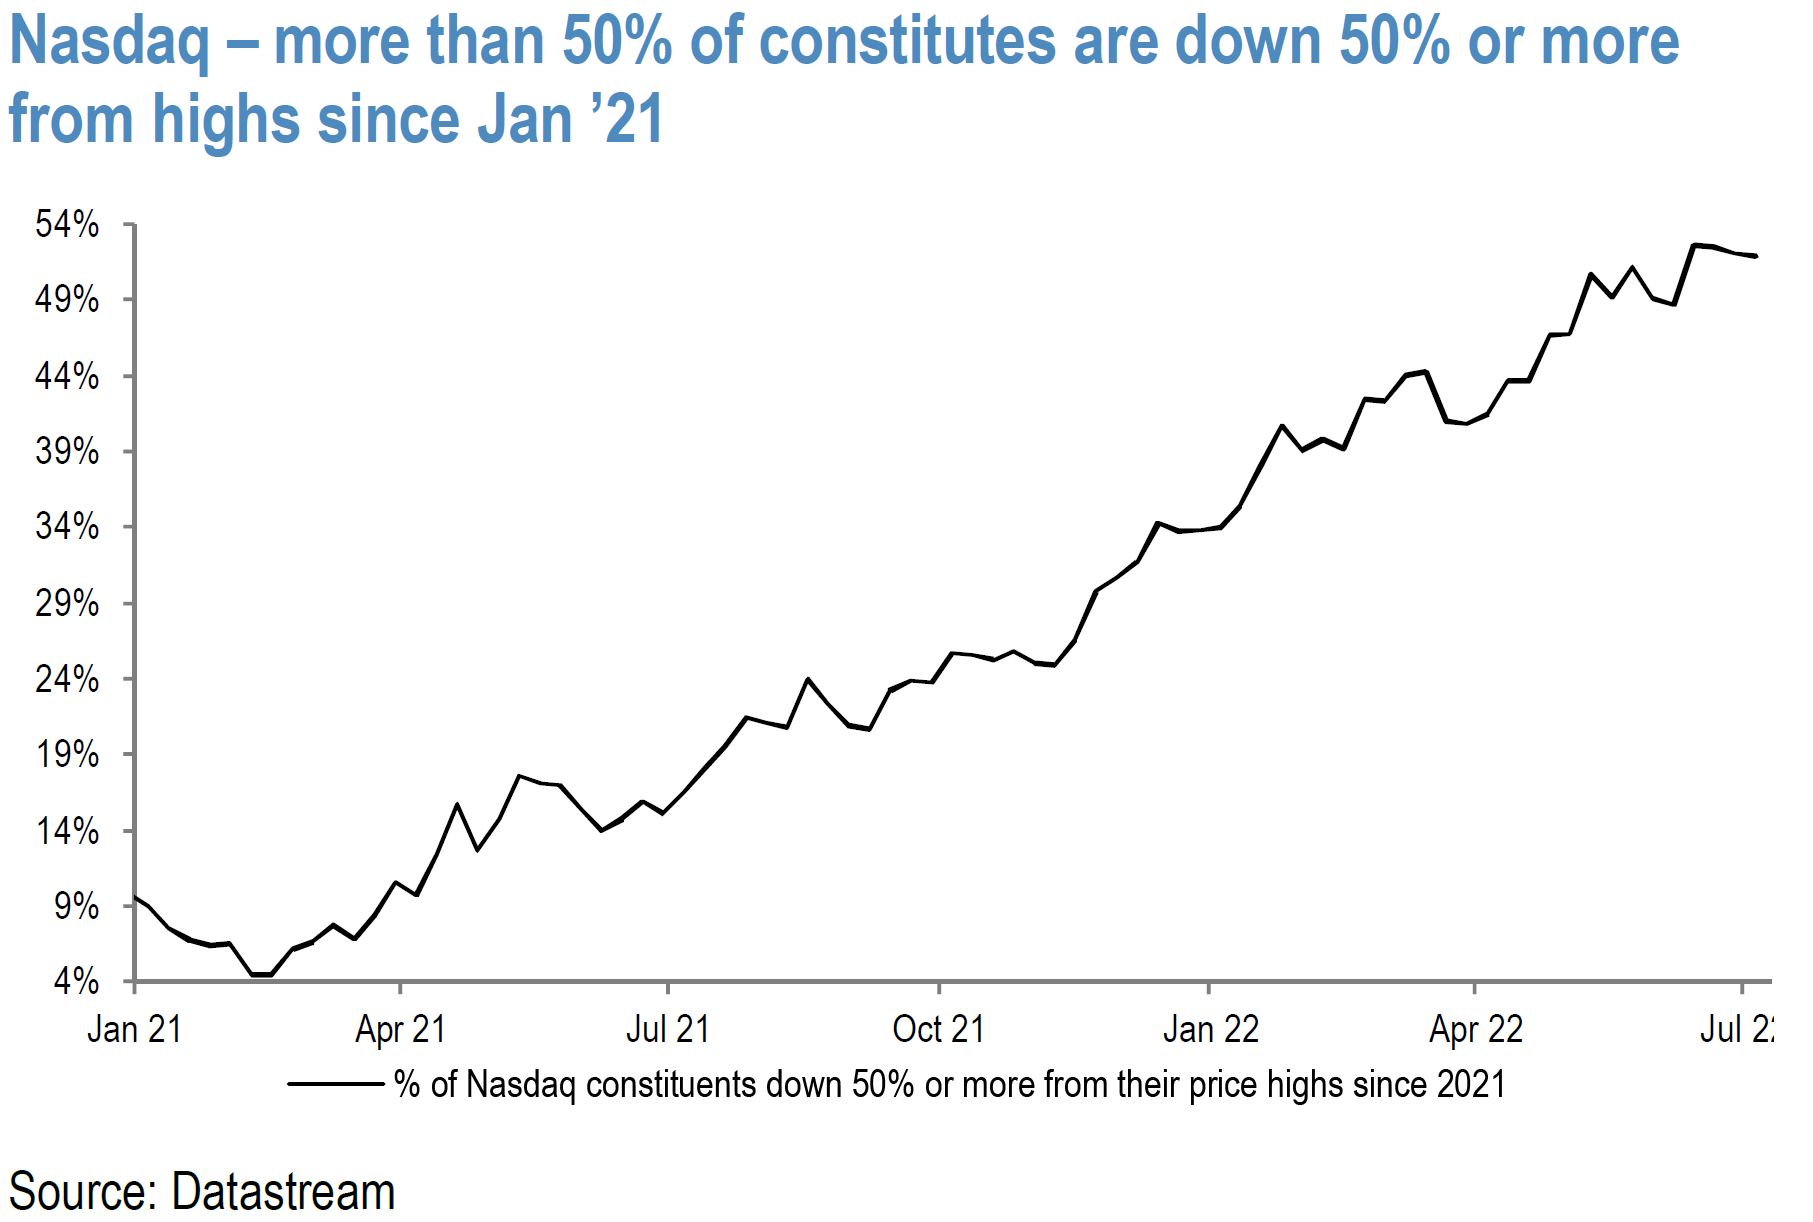
Source: J.P. Morgan Equity Strategy: Tactical opportunity for Growth style to trade better (7/11/2022)
Frontloading Interest Rate Hikes
The elevated June inflation data increase the chances for the Fed frontloading its interest hikes to dampen demand and prevent inflation expectations from becoming “entrenched.” Most investors and analysts assume that the faster the Fed tightens into a slowing economy, the risks of recession will increase. The Fed is not the only central bank with these concerns. The Bank of Canada opted to increase its key policy rate by 100 bps instead of the expected 75 bps. They were also concerned about inflation expectations becoming entrenched. The more such expectations became entrenched the greater the cost of finally reining in inflation. This is precisely the Fed’s thinking as well. The Monetary Authority of Singapore also surprised the financial markets this week with an unexpected further tightening of its monetary policy. The Fed’s focus on inflation expectations was visibly on display when it decided to increase the federal funds rate by 75 bps at its last meeting. The University of Michigan consumer sentiment survey showed an unexpected increase in consumers’ longer term inflation expectations from 3% to 3.3%, subsequently revised down to the 3.1% level. Fed chair Powell referred to this inflation expectation increase as “eye catching.” The Fed took this as a possible first sign of consumers’ inflation expectations becoming “unanchored.” The Fed should take some comfort from the New York Fed survey announced at the beginning of this week. That survey showed an expectation of inflation increasing by 6.8% over the following year, which is a record high from its inception in 2013. This is 0.2% higher compared to the May survey. But the “good” news was that the three-year inflation outlook decreased 0.3% from May’s level to 3.6% in June. The five-year inflation expectation also dropped 0.1% to 2.8%. The preliminary five-year inflation expectations of consumers reflected in The University of Michigan report released Friday confirmed the New York Fed survey when it reflected a decrease by 0.3% to the same 2.8%.
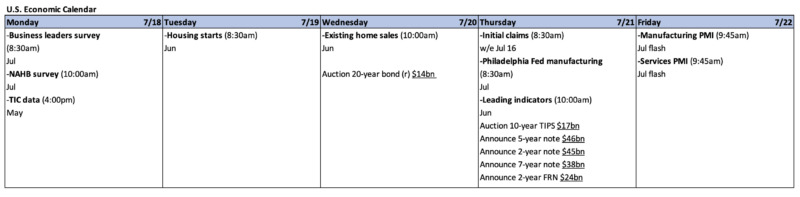
Weakening Housing Market
Much like last week’s narrative, the housing market showed a weakening economic trend. According to Redfin, the share of sale agreements on existing homes that were cancelled in June was about 15% of all homes that went under contract. The Mortgage News Daily reported that homebuilders were also experiencing higher contract cancellation rates, reaching 9.3% in May compared to a 6.6% cancellation rate of May 2021. On July 13, Goldman Sachs determined that U.S. housing affordability deteriorated to its worst levels since 1996 largely due to higher mortgage rates. The expectation was for affordability issues to “linger” at “historically challenging” levels at least through year’s end.
Small Business Expectations Continue to Deteriorate
The National Federation of Independent Business (NFIB) small business expectations index continued to deteriorate as expectations for future business conditions hit an all-time low for this 48-year-old survey. The highest percentage of business owners since Q4 1980 – 34% – cited inflation as their single most important problem. Expectations for better business conditions have worsened in every month this year.
Inflation and Recession Concerns – U.S. and Europe
European inflation and recession concerns continued to increase this week. The European Commission raised its inflation forecasts and decreased its economic growth expectations. The Nord Stream natural gas pipeline from Russia into Germany was shut down for maintenance July 11 and is scheduled to reopen July 21. Many fear that the Russians might halt the flow of natural gas into Europe after July 21 as well. The ZEW Economic Sentiment Indicator dropped to -53.8 in July, versus an expected level of -38.3 and the prior reading of -28.0. This was the worst level since the EU debt crisis of 2011. The drop was attributed to concerns about energy supply to Germany, The European Central Bank’s (ECB) announced interest rate hike, and further COVID-19 related lockdowns in China. The ZEW index is a survey of up to 300 experts from banks, insurance companies and financial departments of various corporation on their views of economic conditions. A recent survey by MagnifyMoney conducted between June 10 and June 14 indicated that about 70% of Americans think a recession is coming. Elevated inflation was cited by 88% of respondents as the probable cause of an upcoming recession. Sixty-two percent said they were cutting back on their spending.
IMF – U.S. Recession Concerns and Emerging Market Debt Concerns
On July 12, Reuters reported that the International Monetary Fund (IMF) cut its U.S. 2022 GDP forecast from 2.9% to 2.3% as recent data showed weakening consumer spending. The IMF warned that avoiding a recession in the U.S. will be “increasingly challenging.” The IMF chief also expressed concerns over a possible global debt crisis as interest rates rise and the USD strengthens. The IMF estimated about 30% of developing and emerging market nations were either at or near distressed debt levels. This would be especially true for those countries with USD-denominated debt.
Fed Beige Book – Signs of Economic Slowdowns but Still Elevated Prices
The Fed’s latest Beige Book, which is a compilation of anecdotal comments about the economy in each of the Fed’s 12 Districts, pointed to a U.S. economy that was expanding at a “moderate pace” on balance since mid-May. However, several Districts reported signs of slowing demand and five Districts noted concerns over increased recession risks. Most consumer spending moderated as elevated food and gasoline prices reduced purchasing power for other goods and services. It was noted that housing demand weakened “noticeably” as affordability became more of an issue. Some financial institutions reported an increase in their customers’ use of revolving debt, i.e., credit cards. The outlook for future economic growth continued to be negative with contacts reporting expectations for a further weakening of demand over the next six to 12 months. A modest improvement in labor availability was observed amid weaker demand for labor. Most contacts expected “price pressures” to persist at least through year end.
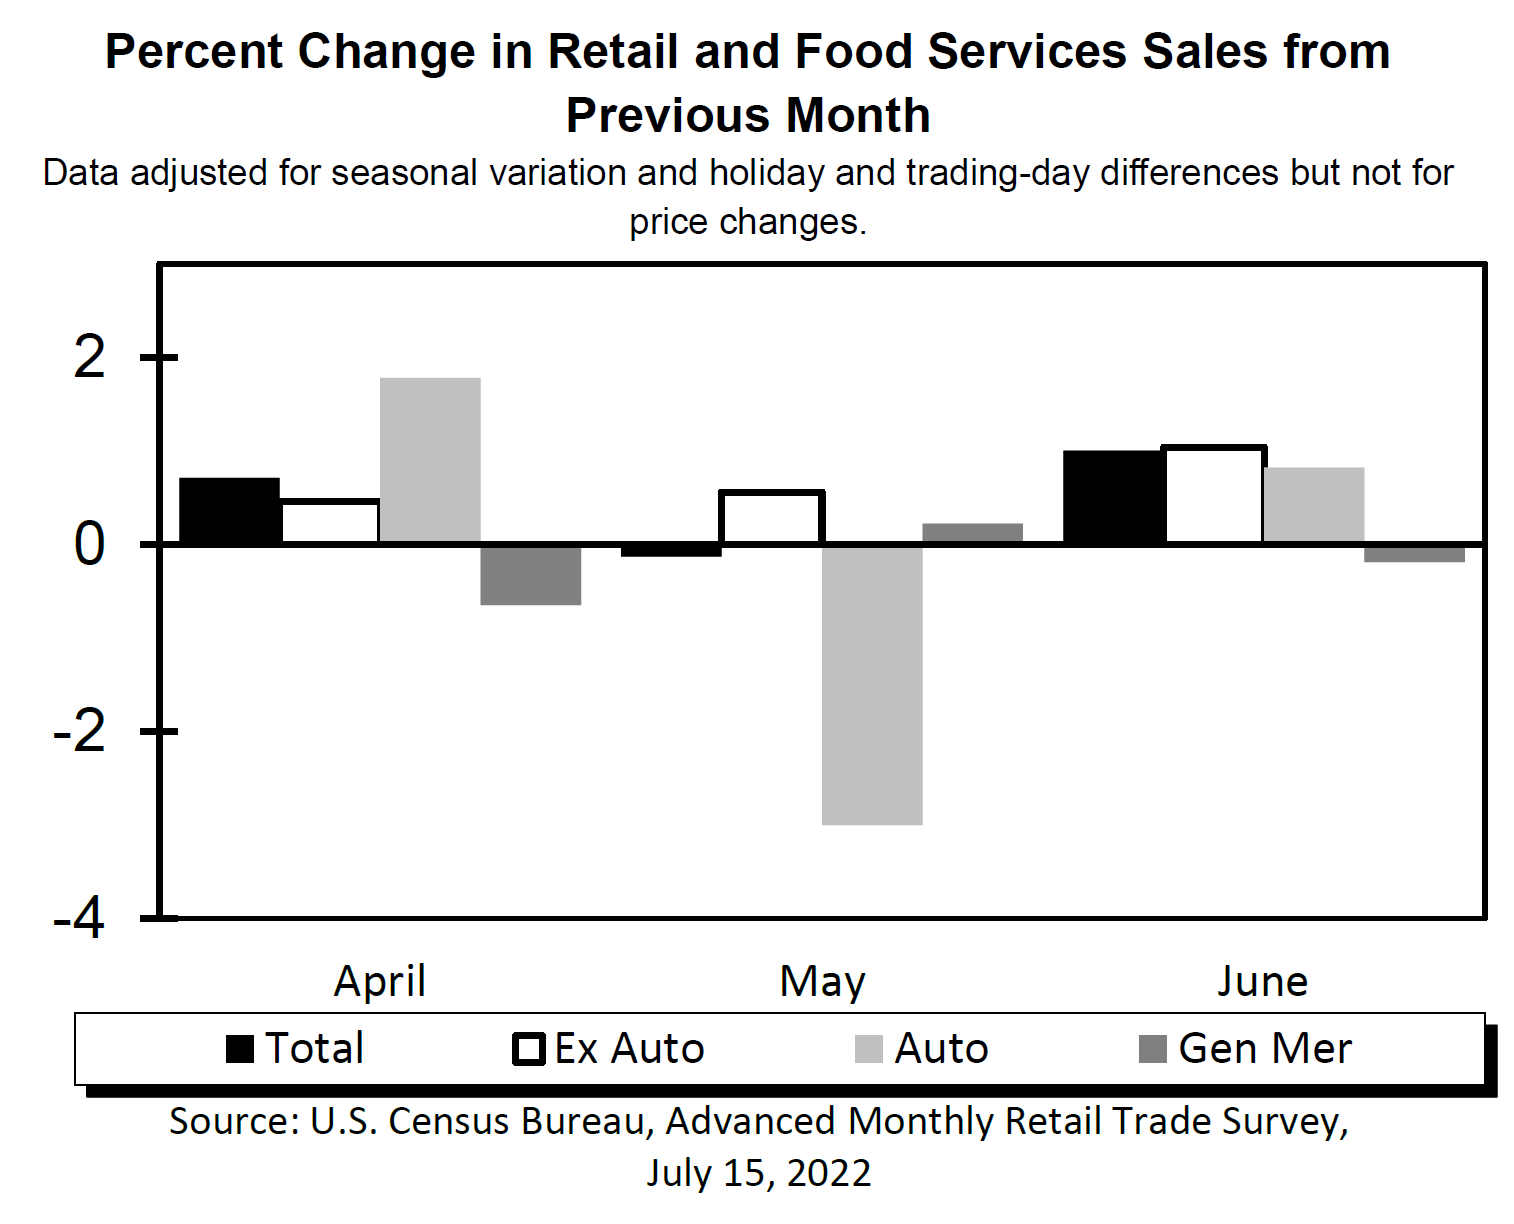
Source: U.S. Census Bureau: Advance Monthly Sales for Retail and Food Services, June 2022 (7/15/2022)
Bottom Line
We assume continued volatility across virtually all financial markets for at least as long as the Russia-Ukraine war persists. We believe that many financial markets have priced in at least partially increased probabilities of potential stagflation and/or recession. Along with last week’s data, the trends in much of the data examined this week increase the risk of recession in our opinion. The rapidity of changes in circumstances cannot be overestimated. We will remain “data dependent” in our investment approach and will try to maintain an “open mind.” We will continue to be “watching.” We will not hesitate to change our views if incoming data warrant any changes.
In the Upshot we indicated our favored sectors for selected purchases on market downturns. We are hopeful that selected purchase in these sectors will outperform on a relative basis. We suppose that equities have not found a sustainable bottom. Additionally, we are still waiting for analysts’ revisions that would lower earnings projections and that would anticipate margin compression.
Our fundamental investment approach for long-term investors remains the same as expressed in our recent commentaries. We maintain our preference for large-cap, high-quality stocks in a diversified portfolio with at least some commodity exposure.
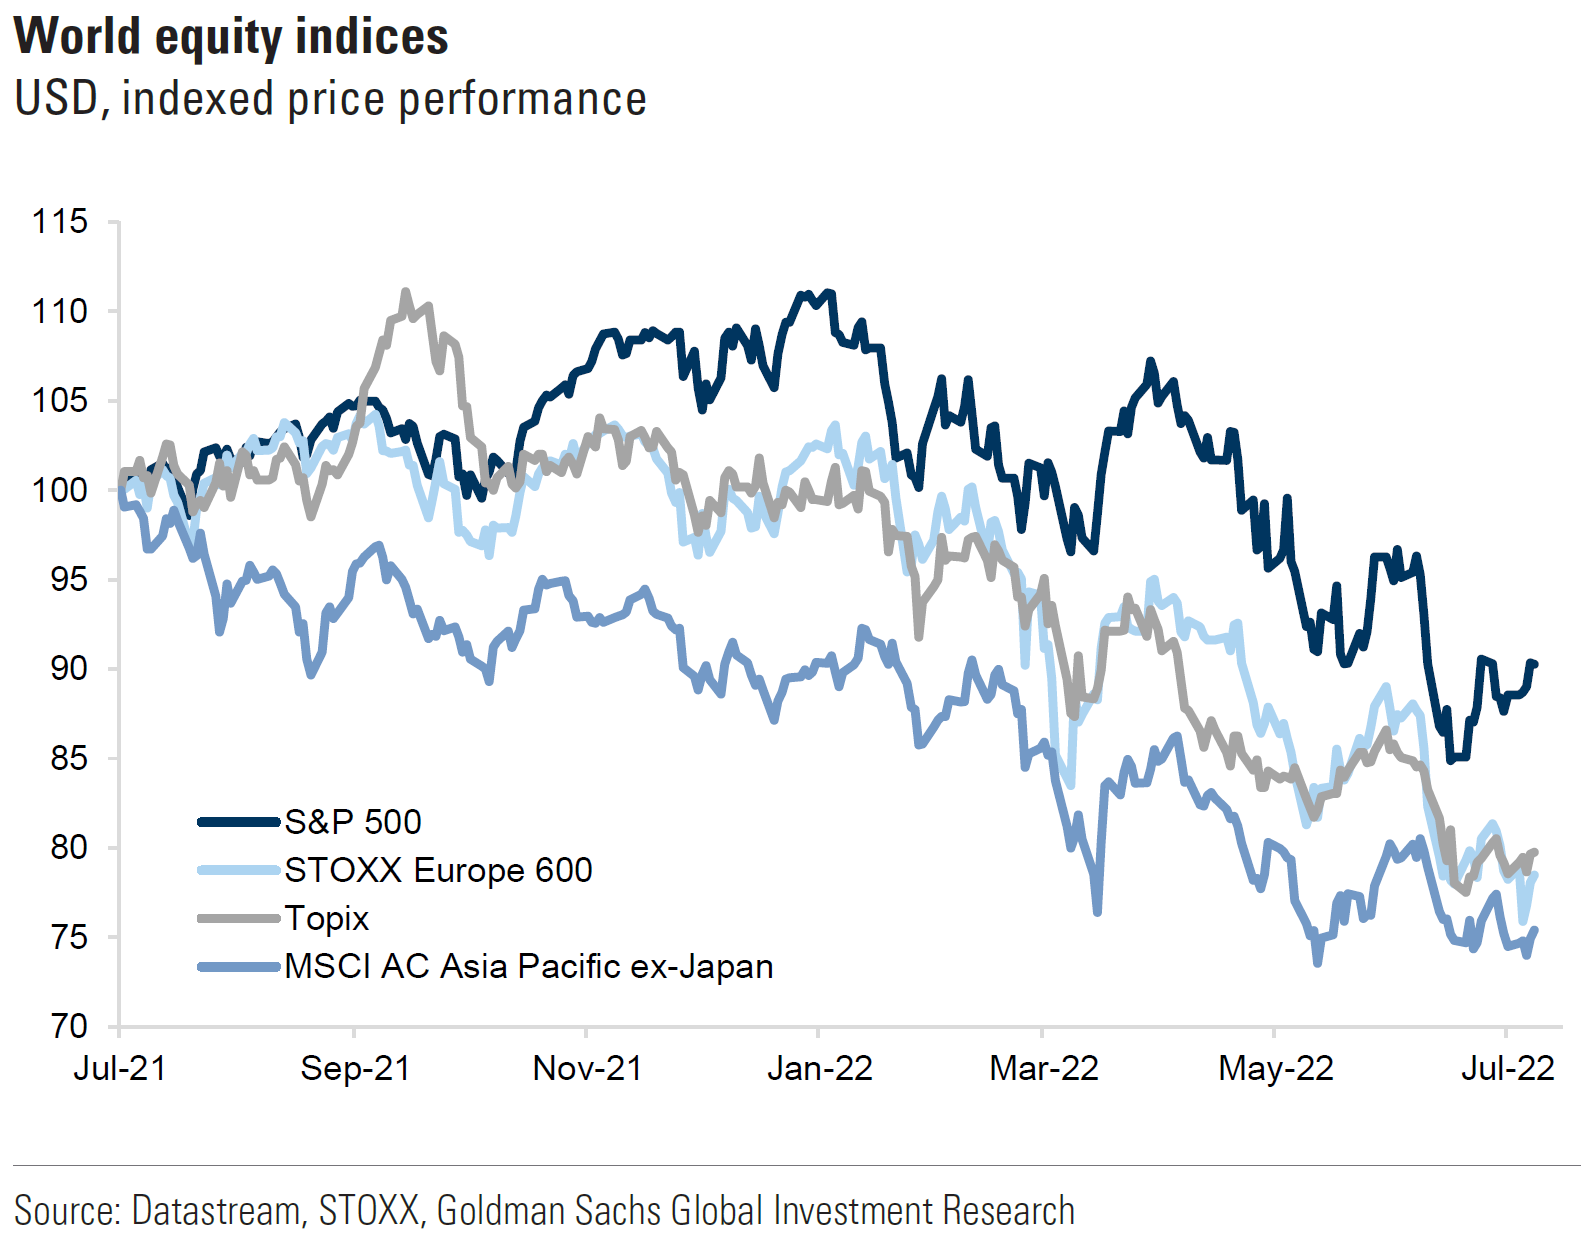
Source: Goldman Sachs Global Weekly Kickstart: Global equities rebounded 1.6%; Tech and Growth stocks outperformed (7/11/2022)
Definitions
Core Consumer Price Index (Core CPI) – Core inflation removes the CPI components that can exhibit large amounts of volatility from month to month, which can cause unwanted distortion to the headline figure. The most commonly removed factors are those relating to the costs of food and energy. Food prices can be affected by factors outside of those attributed to the economy, such as environmental shifts that cause issues in the growth of crops. Energy costs, such as oil production, can be affected by forces outside of traditional supply and demand, such as political dissent.
Headline Consumer Price Index (Headline CPI) – Headline inflation is the raw inflation figure reported through the Consumer Price Index (CPI) that is released monthly by the Bureau of Labor Statistics (BLS). The CPI calculates the cost to purchase a fixed basket of goods to determine how much inflation is occurring in the broad economy. The CPI uses a base year and indexes the current year’s prices, according to the base year’s values.
Producer Price Index (PPI) – The producer price index (PPI), published by the Bureau of Labor Statistics (BLS), is a group of indexes that calculates and represents the average movement in selling prices from domestic production over time. It is a measure of inflation based on input costs to producers.
S&P 500 – The S&P 500 is a total return index that reflects both changes in the prices of stocks in the S&P 500 Index as well as the reinvestment of the dividend income from its underlying stocks.
Basis Points (bps) – A basis point is one hundredth of one percent, used chiefly in expressing differences of interest rates.
Nasdaq – The Nasdaq Composite Index is a market capitalization-weighted index of more than 3,700 stocks listed on the Nasdaq stock exchange. As a broad index heavily weighted toward the
Dow Jones Industrial Average (DJIA) – The DJIA is a stock market index that tracks 30 large, publicly owned blue-chip companies trading on the New York Stock Exchange and Nasdaq.
IMPORTANT DISCLOSURES
The views and opinions included in these materials belong to their author and do not necessarily reflect the views and opinions of NewEdge Capital Group, LLC.
This information is general in nature and has been prepared solely for informational and educational purposes and does not constitute an offer or a recommendation to buy or sell any particular security or to adopt any specific investment strategy.
NewEdge and its affiliates do not render advice on legal, tax and/or tax accounting matters. You should consult your personal tax and/or legal advisor to learn about any potential tax or other implications that may result from acting on a particular recommendation.
The trademarks and service marks contained herein are the property of their respective owners. Unless otherwise specifically indicated, all information with respect to any third party not affiliated with NewEdge has been provided by, and is the sole responsibility of, such third party and has not been independently verified by NewEdge, its affiliates or any other independent third party. No representation is given with respect to its accuracy or completeness, and such information and opinions may change without notice.
Investing involves risk, including possible loss of principal. Past performance is no guarantee of future results.
Any forward-looking statements or forecasts are based on assumptions and actual results are expected to vary from any such statements or forecasts. No assurance can be given that investment objectives or target returns will be achieved. Future returns may be higher or lower than the estimates presented herein.
An investment cannot be made directly in an index. Indices are unmanaged and have no fees or expenses. You can obtain information about many indices online at a variety of sources including: https://www.sec.gov/fast-answers/answersindiceshtm.html or http://www.nasdaq.com/reference/index-descriptions.aspx.
All data is subject to change without notice.
© 2024 NewEdge Capital Group, LLC


