

Weekly Summary: June 13 – June 22, 2022
Key Observations:
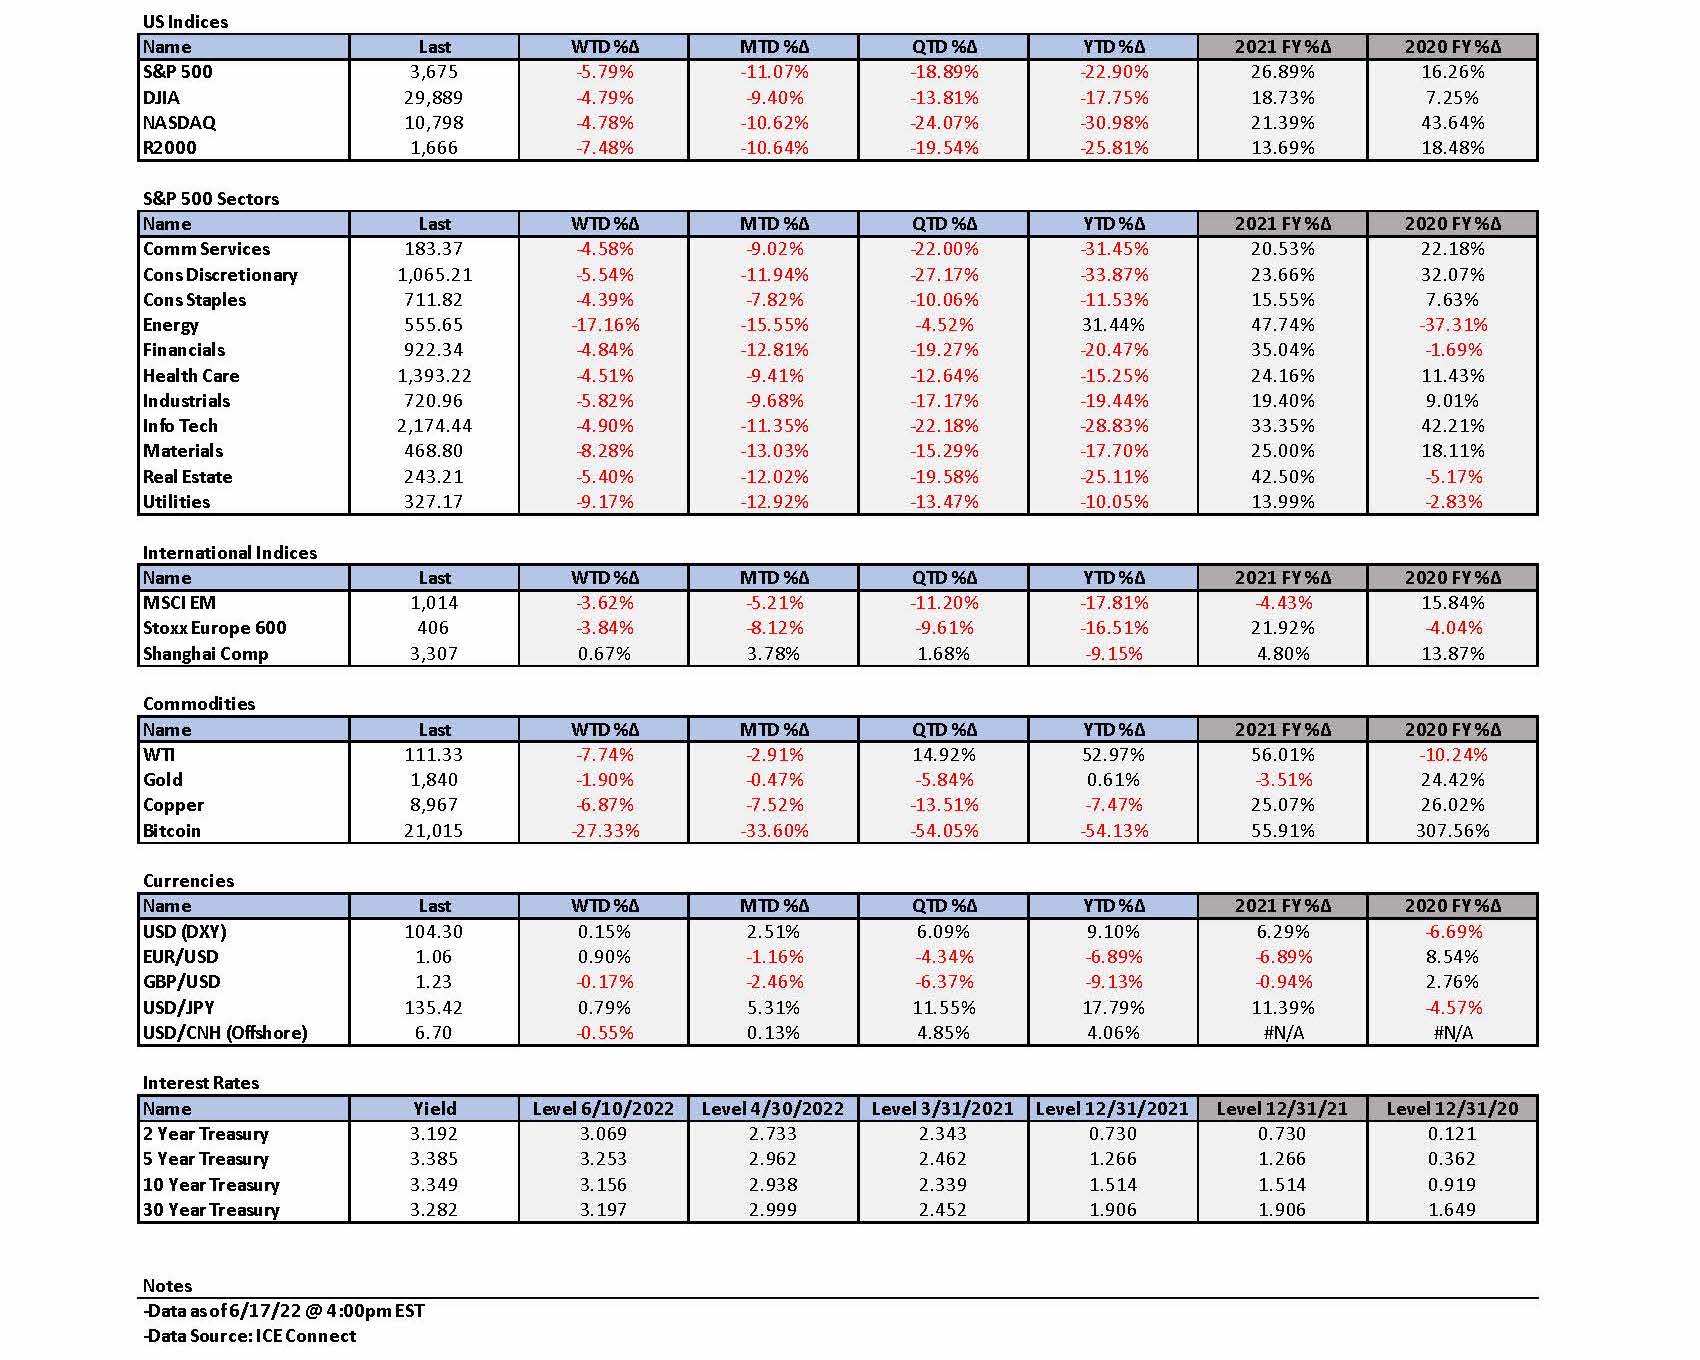
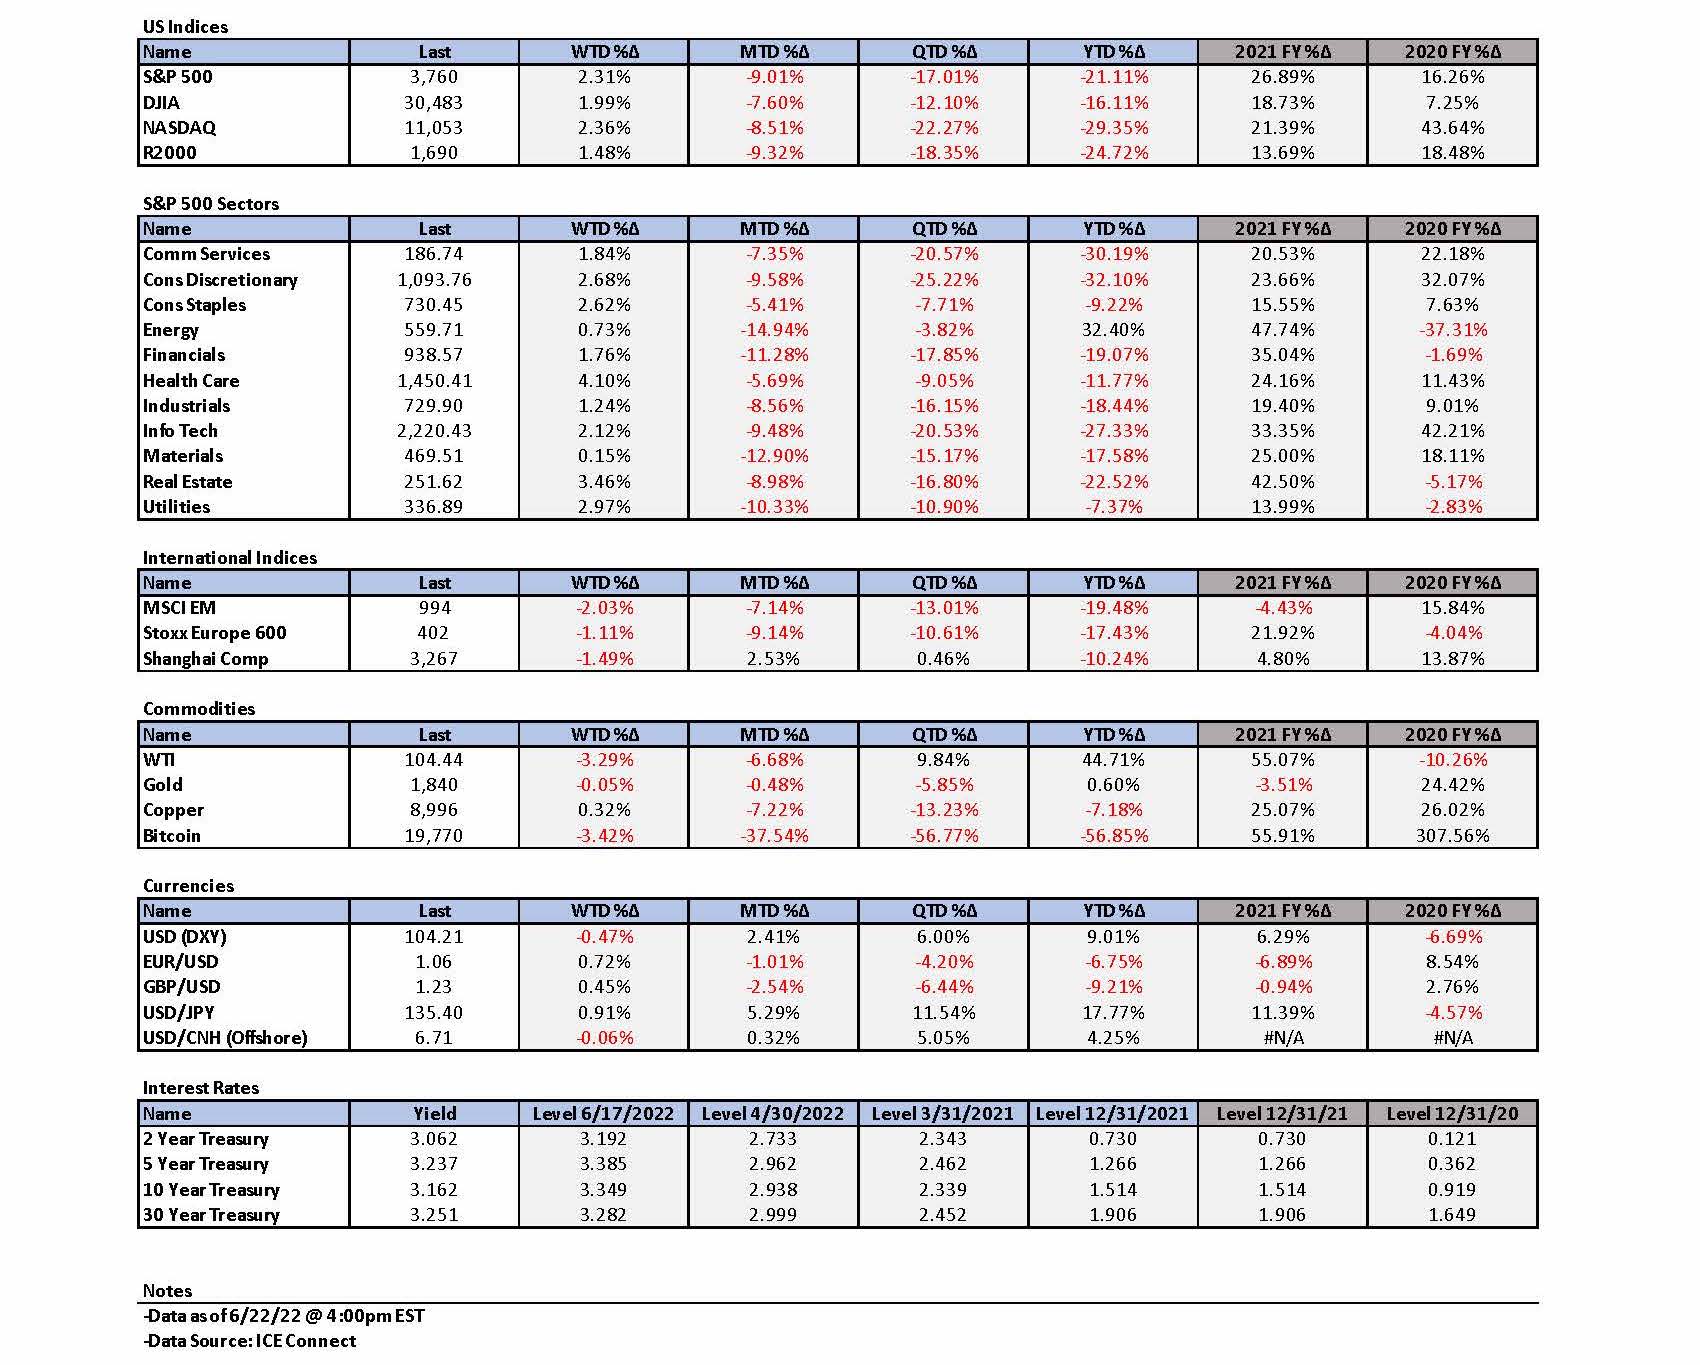
- Last week’s declines in the S&P 500 of 5.79% and its energy sector decline of 17.16% were the worst weekly declines since March 2020. We view these declines as financial markets increasingly pricing in the probability of a recession over the next year. We agree that the risks of recession have increased, but are not ready yet to make that our base case. We will remain “data dependent.”
- U.S. equities have started this week with strong gains, which evaporated quickly early the following morning before rebounding. We do not think the rally that started this week will be sustainable given the extreme uncertainties surrounding future inflation rates, economic growth rates and future major global central bank (CB) policies. But it seems that “everybody knows” that inflation will rise more and that economic growth will slow more than previously expected.
- We continue to expect the Federal Reserve (Fed) to remain aggressive in its tightening of monetary policies to rein in inflation. We expect other major CBs also to be more restrictive as well. We believe that all CBs will be focused on “headline inflation” since many believe that elevated energy and food prices greatly influence consumers’ inflation expectations.
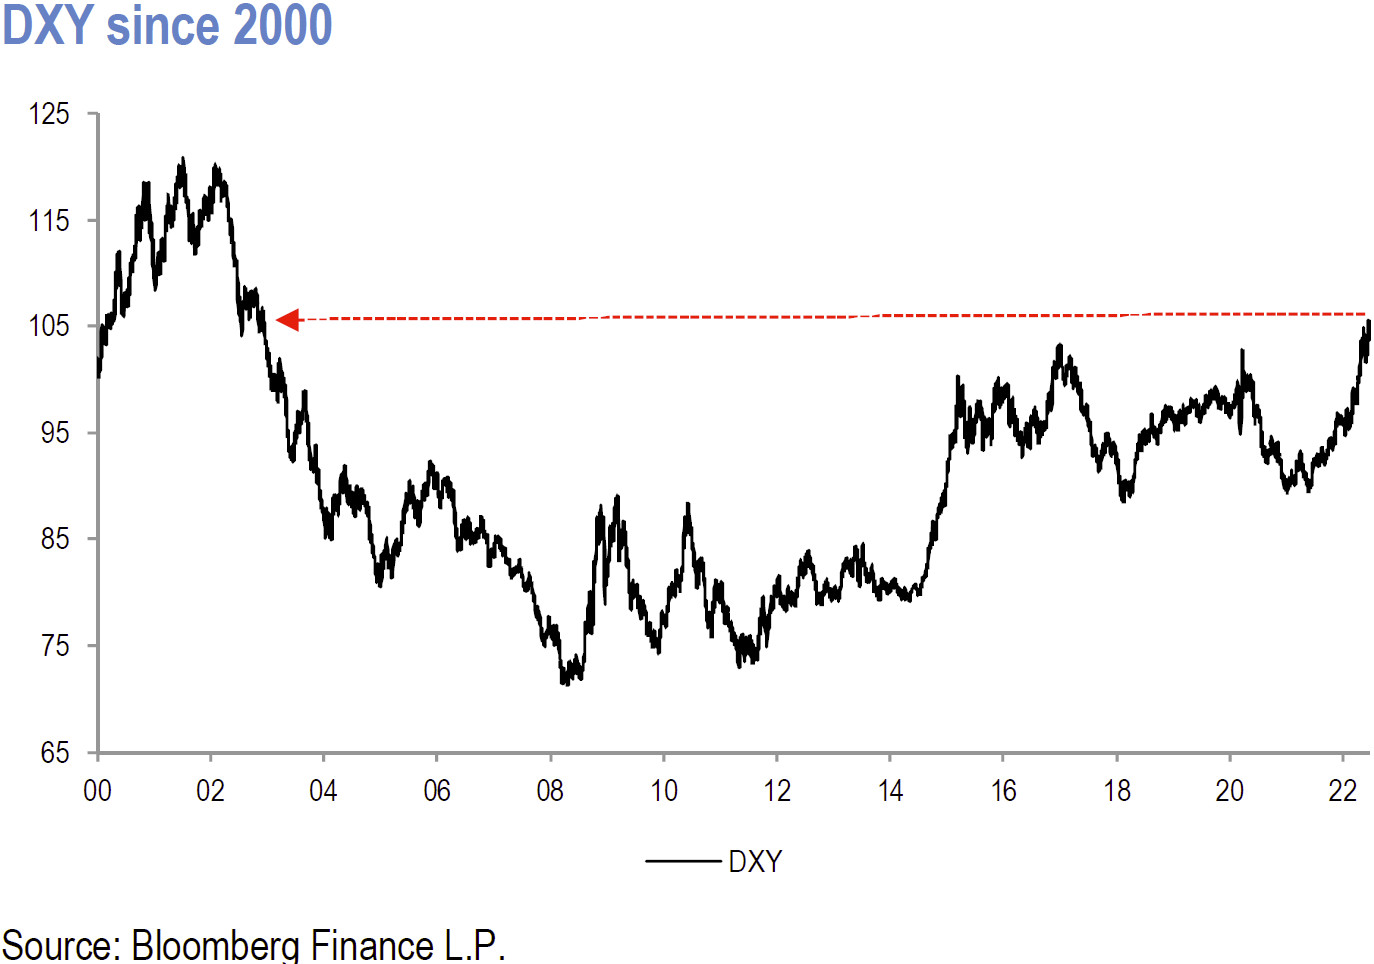
- Although in the minority, we continue to believe that we have either seen U.S. dollar (USD) highs as expressed by the DXY index, or that any USD rallies beyond recent highs will be relatively short lived. Many CBs seem to be concerned increasingly over their weak currencies relative to USD.
The Upshot: We don’t think that we can have a sustainable bottom in U.S. equities until we see some sort of a Fed pivot to a less aggressive monetary tightening stance. This might even be the Fed switching to hikes in the federal funds rate of no more than 25 basis points (bps) at some point. Our guess at a possible sustainable bottom in the S&P 500 without a recession is roughly in the 3,400-to-3,500 range. U.S. equities in mid-term election years often bottom around August or September. A U.S. recession over the next twelve months possibly might push the S&P closer towards the 3,000 level. At the close of the week ending June 17, we preferred energy and tech stocks in general. We thought that the risk-reward was compelling for long-term investors buying selected high-quality stocks in these two sectors. We expect energy prices to remain elevated for as long as the Russia-Ukraine war (war) persists. If the war were to end suddenly, energy stocks would trade most likely lower but then high-tech stocks could show very dramatic gains. Even in that scenario, we could see a substantial recovery in energy prices and energy stocks as it should take time to repair the “damage” in the energy sector due to the war. We would expect to see continued resistance to buying Russian energy even after the war’s end for as long as Putin remains in power. Additionally, we remain concerned over relatively poor liquidity conditions in financial markets. J.P. Morgan’s (JPM) head of global equity research recently observed that financial markets’ liquidity was generally about 30% less than pre-pandemic levels. The Feds’ reduction in its balance sheet – quantitative tightening (QT) – could lead to even less liquidity. Less liquidity could lead to more volatility and increase the chance for a financial market “dislocation” at some point. We remain concerned over the possibility of increasing credit risks as well. Furthermore, we understand that the current uncertain economic environment is prone to very rapid changes and surprises. Also, we believe that financial market volatility will persist for at least as long as the war endures. Alternatively, downside volatility could lessen after a Fed “pivot” from its aggressive tightening monetary policies. The first two trading days of this week were instructive in regard to volatility. In our view, there did not appear to be a specific catalyst that prompted big equity gains one day and then followed by a more volatile day. JPM observed that during the current quarter, every time that the S&P was positive by over 2%, it was followed by an average decrease of at least 2.5% the very next day. Treasury yields retreated during these first two days with the decrease in yields accelerating on the second day as recessionary fears increased. Energy and commodity prices in general were also hard hit on the second trading day this week due to recessionary fears.
Source: J.P. Morgan, Equity Strategy: On Fed repricing and ECB backstop; OW EM, including China, vs DM; Mining remains a buy (6/20/22)
Many Central Banks Become More Aggressive
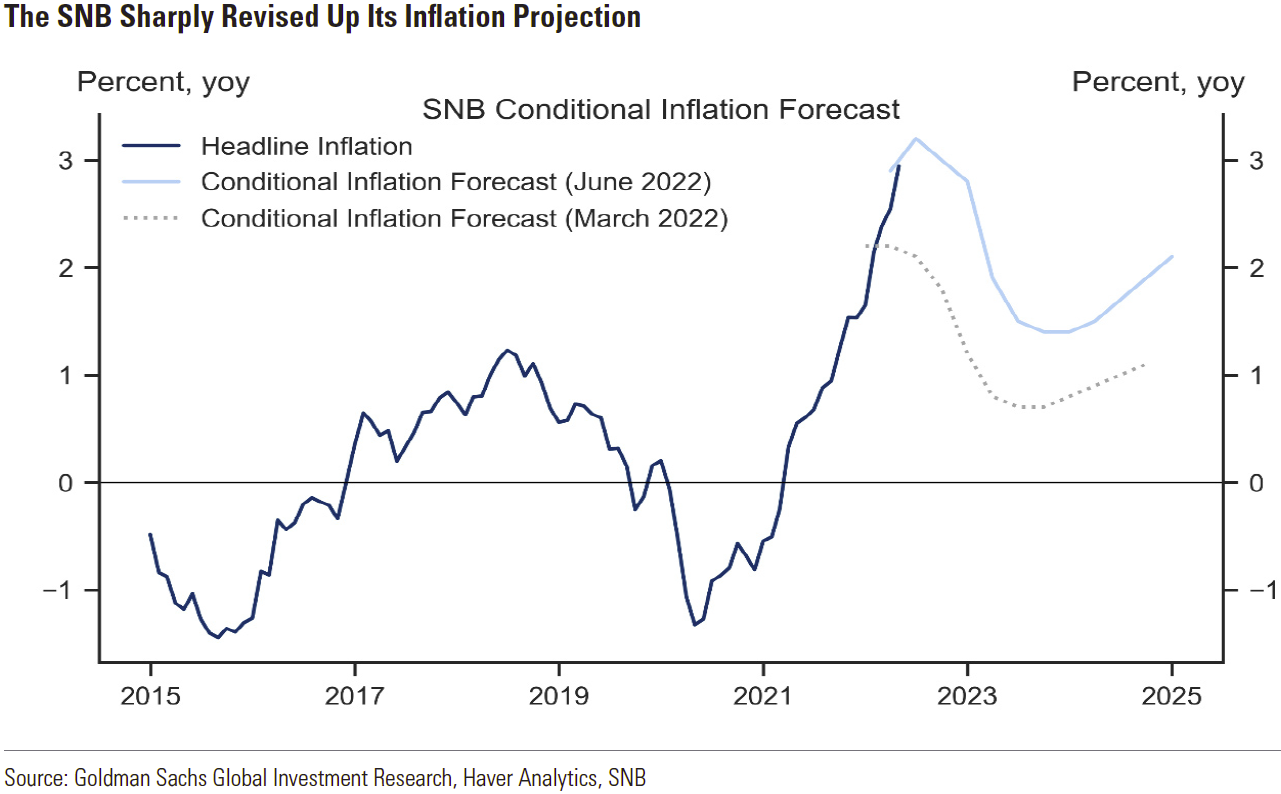
As we highlighted in last week’s commentary, many major CBs have recently adopted more aggressive tightening monetary policies. These more aggressive policies were adopted in response to an increasing realization that inflation rates were, and will be higher than previously forecast, as well as that economic growth rates will be lower. Many major financially focused global institutions, such as the World Bank, shared similar views. For the week that ended June 17, the Swiss National Bank (SNB), the Fed, and the Bank of England (BOE) joined this growing consensus. Although the Bank of Japan (BOJ) maintained its ultra-loose monetary policies, BOJ Governor Haruhiko Kuroda expressed his concern over the rapidity of the yen falling to its weakest level versus USD since 1998. On June 17, Kuroda stated: “Rapid moves in foreign-exchange rates as seen in the past few weeks are not desirable because it would bring big uncertainty to companies’ business planning. That is negative for the economy.” Kuroda’s latest observation was in sharp contrast to his previous recent stance that a weak yen could be a positive for the Japanese economy by boosting corporate profits earned overseas. This is yet another example that in the current environment, rapidity of change appears to accelerate without any appreciable notice. The SNB expressed similar concerns about maintaining the strength of its own Swiss franc.
Source: Switzerland: SNB Surprises with 50bp Hike (6/16/22)
“Everybody Knows” – Higher inflation and Slower Economic Growth than Previously Expected
It seems rather remarkable that the perception of higher inflation and slower growth has coalesced at this time. This includes the financial markets which continue to price in an increased probability of a U.S. recession, and possibly a global one as well. I thought that Leonard Cohen’s song “Everybody Knows,” originally released in February 1988, best captured the growing consensus of higher inflation and slower economic growth compared to what many had previously thought only a short time ago. “Everybody got this broken feeling; And everybody knows that it’s now or never; Everybody knows that it’s moving fast; Everybody knows it’s coming apart.” The CBs certainly have acted recently like “it’s now or never” that they take aggressive action to rein in inflation. It appears that “everybody knows” that the economic environment is “moving fast.” The financial markets seem to be leading the way for CBs. The focus of many CBs is clearly on reining in elevated inflation and many analysts continue to think that is also the focus of financial markets. We think it’s a little more subtle than that. It is our contention that financial markets are actually more focused on the increasing risks of stagflation and recession. To the extent that inflation remains elevated, markets are concerned that CB monetary tightening policies will continue to be aggressive and increase the probabilities of economic slowdowns. So the markets are ultimately focused on CB policies in reaction to high inflation rates and inflation expectations. This is particularly true in regard to the Fed.
Fed Hikes by 75 bps – Press Conference
After guiding investors to assume that it would raise the federal funds rate by 50 bps at each of its June and July meetings, the Fed raised that rate by 75 bps at its June meeting this past week, which was the biggest hike since 1994. Before it did so, the Fed “leaked” that it would do so to the Wall Street Journal (WSJ) a couple of days prior to the announcement. The Fed has “leaked” stories previously to the WSJ and so financial markets were very quick to price in a 75 bps hike. In the press conference subsequent to the Fed’s announcement, Fed chair Powell indicated that a 50 bps or 75 bps hike was “most likely” at the Fed’s next meeting in July. Powell made it very clear that the Fed will be “data dependent” and that it will be “nimble” in responding to the incoming data. Additionally, Powell said that the “appropriate” amount of a hike in the federal funds rate will be determined on a “meeting-by-meeting” basis, while acknowledging that the economy continues to evolve in “unexpected ways.” Powell also acknowledged that “headline inflation”, which includes increases in food and energy prices, plays an important role in shaping inflation expectations. The Fed must be “mindful” of headline inflation due to its effects on inflation expectations even as Fed policies have less impact on food and energy prices when compared to price changes in the “core inflation” measures. We foresaw Powell’s new found focus in our last week’s commentary. “Because of the persistence of high energy and food costs mostly due to the war, we anticipate that the focus of most CBs will be on headline inflation.” We assume that the July hike will be 75 bps as well. Powell reiterated that the Fed must move “expeditiously” so as to move inflation lower. We surmise that headline inflation will remain elevated enough to push the Fed into another 75 bps hike in July to help quell inflation expectations. In answer to a question of whether the Fed could go to a 75 or 100 bps future hike, Powell responded that the Fed will be “flexible” in future interest rate hike decisions and that it will react to incoming data in an “appropriate” way. Powell said that the Fed was not trying to “induce a recession.”
Why Fed Chose 75 bps Instead of 50 bps
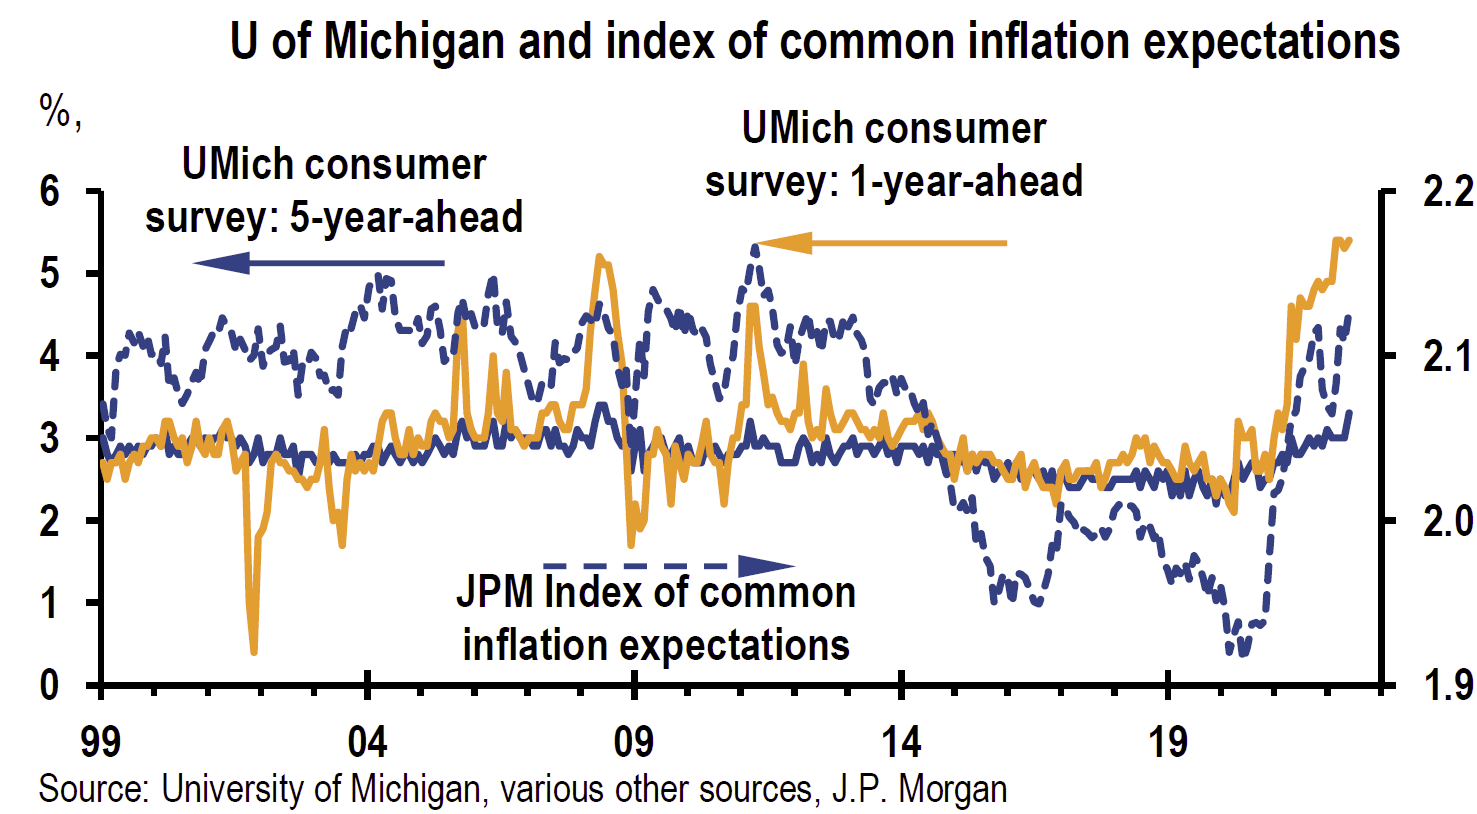
Given Powell’s focus on the importance of headline inflation’s impact on inflation expectations, it was very understandable that he chose to lead the Fed to a 75 bps at the June meeting. Kansas City Fed President Esther George was the only dissenter, who preferred a 50 bps hike. May’s Consumer Price Index (CPI) year-over-year (y/y) higher than expected headline inflation reading of 8.6% – highest since 1981 – and the surprising rise in the five-year inflation expectations reading to 3.3% from 3.0% of the preliminary University of Michigan’s (UM) June survey of consumer sentiment were the primary reasons for the Fed’s choice to be more aggressive at their latest meeting. The 3.3% reading was the highest such reading since 2008, and is at the high end of the range in recent decades. Powell referred to the increase to 3.3% as “eye-catching.” The Fed evidently took this as a sign that perhaps consumers’ long-term inflation expectations were beginning to be “unanchored” and therefore must be halted. We thought it noteworthy that the Fed only focused on higher-than expected inflation readings in deciding to hike by 75 bps and paid little attention to the precipitous drop in UM’s preliminary June consumer sentiment index to 50.2 from May’s final reading of 58.4. June’s reading was a new record low for the series, and was assumed to be due mostly to higher prices. The Fed has repeatedly informed us that the best way to extend economic growth and maintain a robust labor market for an extended period of time is to rein in inflation.
Source: J.P. Morgan, US Weekly Prospects (6/17/22)
Powell’s Observations and Preferences
Powell continued to characterize the labor market as “extremely tight” and inflation as “much too high.” He also observed that the U.S. “housing activity appears to be slowing,” that wage growth is elevated, that labor supply remains “subdued”, and that inflation had spread to both goods and services. He expressed his preference for “frontloading” interest rate hikes and for the need to see inflation pressures abate and then begin to decline. Powell indicated that he would like to see Fed monetary policy at “moderately restrictive” levels by year end. He saw a rate in the range of 3.0% to 3.5% as moderately restrictive. Powell continued to refer to the neutral federal funds rate at roughly the mid-2% range. Increasing federal funds rates work their way to the economy by way of tightening financial conditions that would help moderate demand for goods and services and for labor, which could lead to a better balance between demand and supply of labor. Powell noted that financial conditions had already tightened to some extent through the “expectations channel.” Since the Fed had little influence on supply directly, Powell was hopeful that moderating demand through the Fed’s efforts might result in prices “coming down” more quickly than “you’d expect.”
Although the Fed reduced its economic growth assumptions and increased its inflation, unemployment, and interest rate assumptions, Powell saw no sign of a spending slowdown or any sign of a “broad slowdown” as the economy continued to grow at a “healthy level”, even as fixed investment had “softened a bit.” Powell commented on the shift in consumer spending patterns in the context of overall spending remaining “strong.” Consumption accounts for roughly two-thirds of the U.S. economy. In his final analysis, Powell thought that the U.S. economy was in a “strong position” and “well positioned to deal with higher rates.” Given Powell’s view on the U.S. economy, we are somewhat concerned that Powell might think that he has more of a “cushion” with respect to the U.S. economy as the Fed raises rates and QT is implemented. We can’t stress enough that in our opinion, “rapidity of change” will continue to surprise. Powell did recognize that recession risks had increased in the last few months but that most factors were “outside” of the Fed’s control, especially the rise in commodity prices. Moreover, financial conditions have been tightening for about seven months now. Powell stressed that the current economic environment is “highly uncertain.” It remains unclear to what extent the shrinkage of the Fed’s balance sheet will have on financial market liquidity and volatility. The Fed is also unsure to what extent supply shortages, bottlenecks, people dropping out of work force, etc., will remain issues. But even with all of the uncertainties, Powell believes that the Fed’s latest projections meet the “test” of a “softish landing.” By last week’s end the latest Fed guidance and financial market expectations were more closely aligned. We will monitor this new convergence to see whether this will moderate financial markets’ volatility to any degree.
The “Dot” Plot and other Economic Projections
The Fed released its latest “Summary of Economic Projections” (SEP), as well as their so-called “dot plot” at the conclusion of their meeting last week. The dot plot is a chart that reflects each Fed official’s projection of the “appropriate” midpoint for the federal funds rate at the end of the calendar year for the following three years. There are 19 individual projections (“dots”) when the Fed is fully staffed. There is currently one vacancy on the Fed board of governors. Another dot is missing from the Fed’s longer run projects due to St. Louis Fed President James Bullard, who has been vocal about omitting his long run projections. The median dot in the June SEP shows a federal funds rate midpoint of 3.375% at year end. This compares to the March meeting projection of 1.875%. After the 75-bps hike in last week’s meeting, the target range for the current federal funds was raised to a target range of 1.5% to 1.75%. Interest rate hikes of 75 bps at the July Fed meeting, 50 bps in September and 25 bps in both November’s and December meetings would end the year at a level corresponding to the median level of dots projected for year end. At present, this is our forecast. Compared to March projections, the SEP showed increases in the unemployment rate, and downgrades to GDP growth throughout the forecast. The new projections show an unemployment rate of 3.7% at year’s end vs. 3.6% now and 3.5% previously, and rising to 4.1% in 2024 vs. 3.6% previously. The new SEP projections showed a 1.1% decrease to real GDP growth for 2022, down to +1.7%. The 2023 growth rate was reduced -0.5% from the March projection down to 1.7% and the 2024 projection was reduced -0.1% to +1.9%. The median core PCE inflation forecast was revised +0.2% higher to 4.3% for year end, +0.1% to 2.7% for end of 2023, and left unchanged for 2024 at 2.3%.
SNB Hikes by 50 bps and Shows Currency Concerns
SNB followed the Fed the day after its meeting with a surprise hike of 50 bps to its key policy rate, raising it from a negative -0.75% to a still negative -0.25% against expectations of no change. This was SNB’s first rate hike since September 2007. The SNB raised its inflation forecasts for 2022 through 2024 from its last projections given in March. It also issued a rather now familiar-sounding statement along with its rate hike: “The tighter monetary policy is aimed at preventing inflation from spreading more broadly to goods and services in Switzerland. It cannot be ruled out that further increases in the SNB policy rate will be necessary in the foreseeable future to stabilize inflation in the range consistent with price stability over the medium term.” The SNB also showed its concern that its currency not depreciate. “To ensure appropriate monetary conditions, the SNB is also willing to be active in the foreign exchange market as necessary.”
BOE Hikes by 25 bps but has Inflation and Currency Concerns
The BOE continued to raise its benchmark rate. It hiked the rate 0.25% on June 16 to 1.25% by a 6-3 vote, with all three dissenters preferring a 50-bps hike. Catherine Mann, who is a member of BOE’s monetary policy committee and who was one of the three dissenters to the latest 25-bps hike, thought that a more aggressive approach was warranted to help rein in inflation and to help bolster the weak British pound. The UK’s CPI rose 9.1% y/y in May (a forty year high) after a 9.0% increase in April and is expected to exceed 11% slightly by October.
U.S. Recession Risks and Global CPI
According to JPM on June 13, global May CPI (ex-Turkey) was tracking at +0.7% m/m, which would be the second highest on record. JPM also estimated that global CPI would rise to nearly 10% y/y this quarter, which is more than twice that expected earlier this year. One of JPM’s models projected that headline CPI in the U.S. on a y/y basis could top out at 9.2% in September. JPM also believed that the financial markets were now pricing in an 85% chance of a recession by sometime in 2023. Nevertheless, JPM maintained its belief that the U.S. would avoid a recession through 2023.
Fed-Speak+ and Increasing Recession Risk
On the Friday after the Fed’s June meeting at a Fed sponsored conference on USD, Powell stated that the Fed is “acutely focused on returning inflation to our 2% objective.” U.S. financial markets seemed to price in increased probabilities of a U.S. recession after that statement during the remainder of the day on Friday. The energy sector stocks and the price of energy were particularly hard hit this week on increasing recessionary fears. U.S. stocks in general were hit hard this week as well. Both the energy sector and the S&P 500 had their worst weeks since March 2020. Looks like there really is no place to hide in equities if we are headed for a recession in the next twelve months. On Sunday, June 19, Treasury Secretary Janet Yellen stated that “unacceptably high” prices were likely to persist through 2022, and that she expected the U.S. economy to slow down. That same day, Cleveland Fed President Loretta Mester said that the risk of recession in the U.S. economy is increasing and that it would take several years to return to the Fed’s 2% inflation goal. Mester further stated that the Fed would need to see “compelling evidence” of an inflation slowdown before being convinced that prices were under control. Although she was not predicting a recession, Mester seemed to blame partly the Fed for this increased risk: “The recession risks are going up partly because monetary policy could have pivoted a little bit earlier than it did.”
Banks See Increasing Recession Risk
On June 17, Deutsche Bank joined the growing “consensus” that recession risks are growing for the U.S. economy. It now expects “an earlier and somewhat more severe recession.” The recession could start in Q3 2023, one quarter earlier than it forecast about two months ago. An even earlier start is possible. “A more severe tightening of financial conditions could easily pull forward recession risks to around the turn of the year.” It also sees Q3 2022 headline CPI peaking at 9% y/y in the U.S. On June 20, Nomura Holdings Inc. joined the latest narrative. Nomura now saw the possibility of a U.S. recession in 2020 as a better than 50-50 possibility. Nomura believed that the U.S. economy was “likely” to fall into a mild recession by the end of 2022. On June 20, Goldman Sachs changed its view of recession risks. It now sees recession risk over the next year as a 30% probability compared to its prior assessment of 15%. It also sees recession risks as more “frontloaded” – more likely over the next year instead of further out. Goldman indicated that the main reasons for the revised expectations are its lower baseline U.S. GDP growth forecasts for this and next year, as well as that Goldman is now “increasingly concerned that the Fed will feel compelled to respond forcefully to headline inflation and consumer inflation expectations if energy prices rise further.” Looks like Goldman took notice of Powell’s reference to the importance of headline inflation and its effect on inflation expectations. On June 22, Citibank was the latest bank to increase its assessment of recession risks. It now sees a “near” 50% risk of a recession in the “near future.”
Recent Key Economic Data Released Last Week
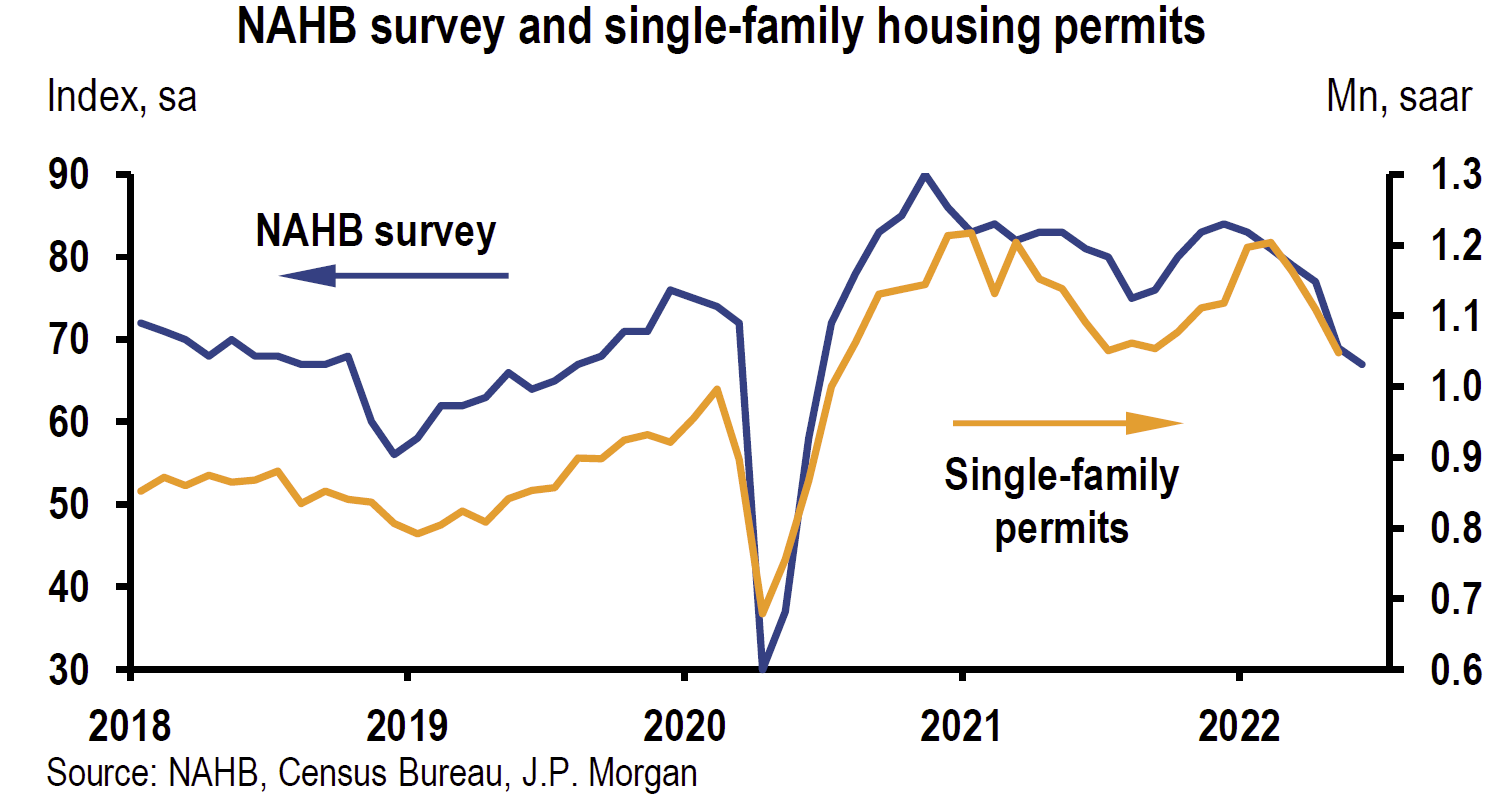
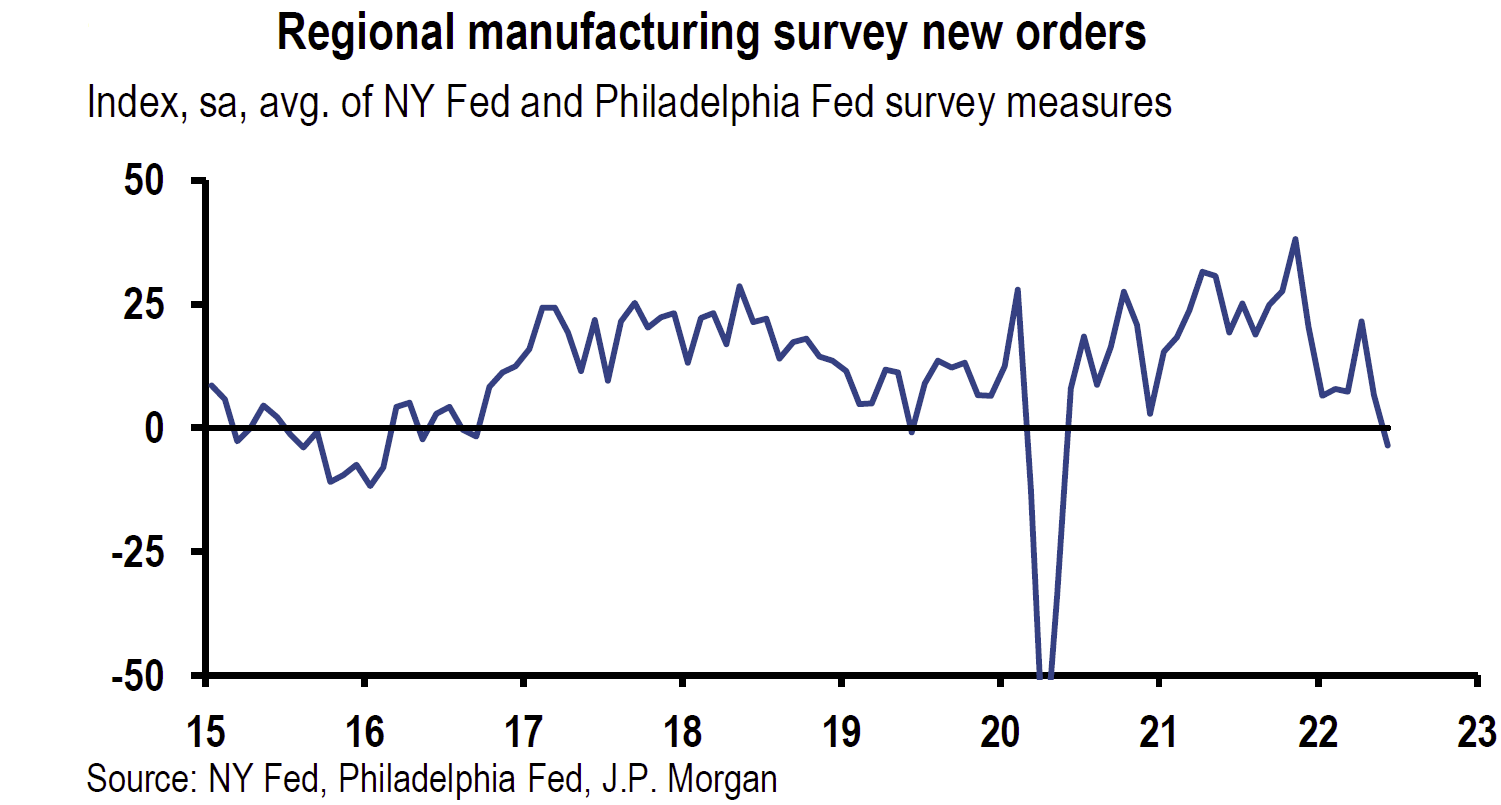
Perhaps the most anticipated economic data of the past week was the U.S. May retail sales figures prior to the Fed’s announcements midweek. May retail sales were -0.3% lower m/m in May vs. an expected increase of +0.1%. April retail sales were revised lower from 0.9% to 0.7%. The May m/m decline was the first monthly decline in five months. Sales at gasoline stations increased 4% m/m and 43.2% y/y. Many observers took the fall in monthly retail sales as a sign that surging prices on necessities, such as gasoline, were having an effect on the purchase of more discretionary-type items. On June 17, JPM noted that “past episodes of rapid shifts to restrictive monetary policy stances have generated credit market stress, a risk that so far has not yet materialized.” But Ford’s CFO remarked just this past week that “we are seeing delinquencies start to increase.” However, he remained unconcerned because the uptick was against a very low base of delinquencies. As we have highlighted in past commentaries, we are becoming increasingly concerned about upcoming credit risks as consumers have increased their borrowing in March and April, and are wary of future access to credit facilities. Housing and manufacturing are typically very sensitive to interest rate increases. As we have previously noted, housing starts and permits were lower in June and the homebuilder’s survey has weakened recently. Both the Empire State – NY Fed – and the Philadelphia Fed June manufacturing surveys released last week signaled declining activity. The latest National Federation of Independent Business (NFIB) survey of small business owners released last week showed that business owners expecting better conditions in the next six months dropped another four points to a negative -54%, the lowest reading in the forty-eight-year history of the survey. Expectations for better business conditions have deteriorated every month since January. The Producer Prices Index (PPI) for May released last week increased strongly as energy prices surged. PPI was +0.8% m/m vs. +0.4% in April and +10.8% y/y vs. +10.9% for the prior month, and expected +10.9%. PPI food inflation was flat m/m but up by +13.0% y/y. The headline PPI rose by a record 11.5% y/y rate in March.
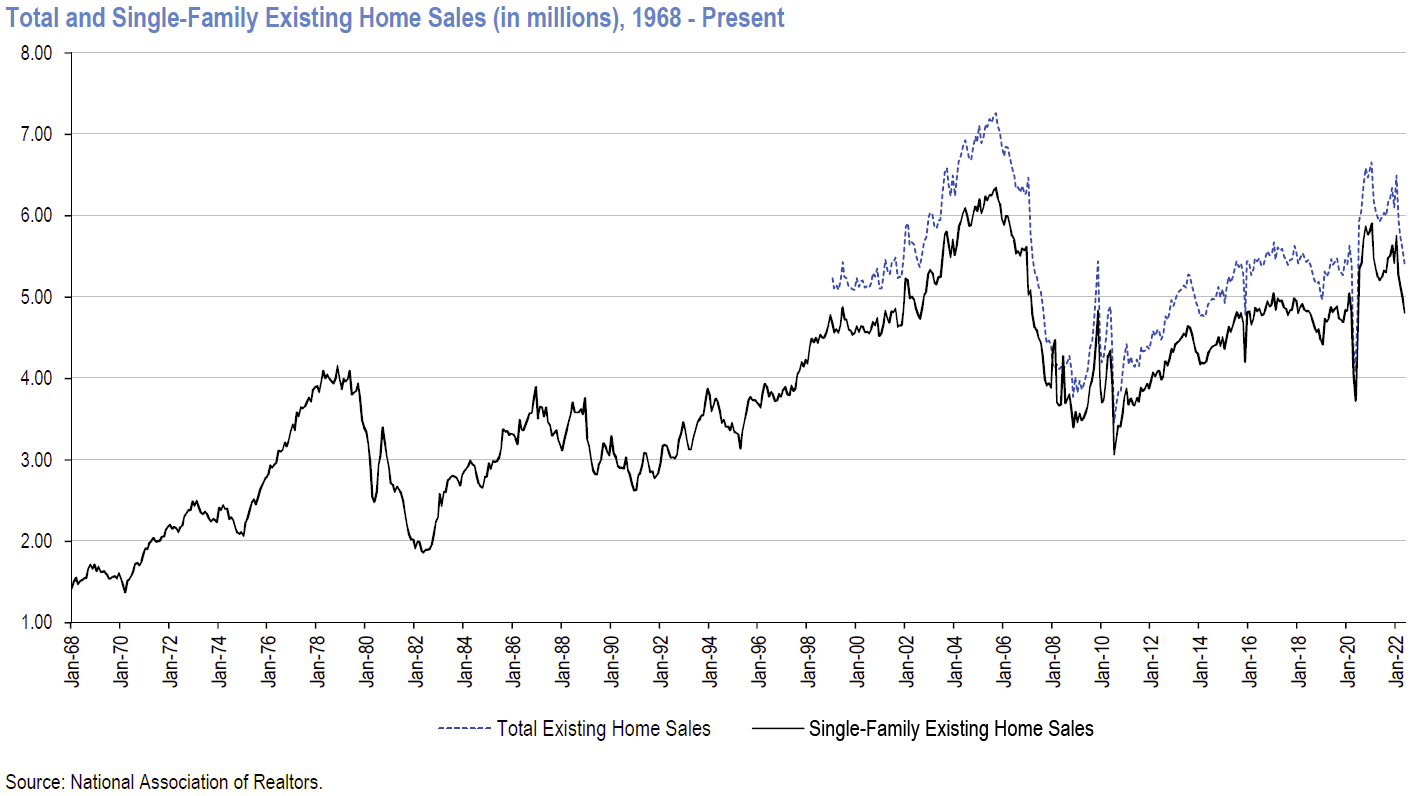
Source: J.P. Morgan, Homebuilding: May Existing Home Sales Fall 3.4% Seq., Roughly In- Line with the Street (6/21/22)
Source: J.P. Morgan, US Weekly Prospects (6/17/22)
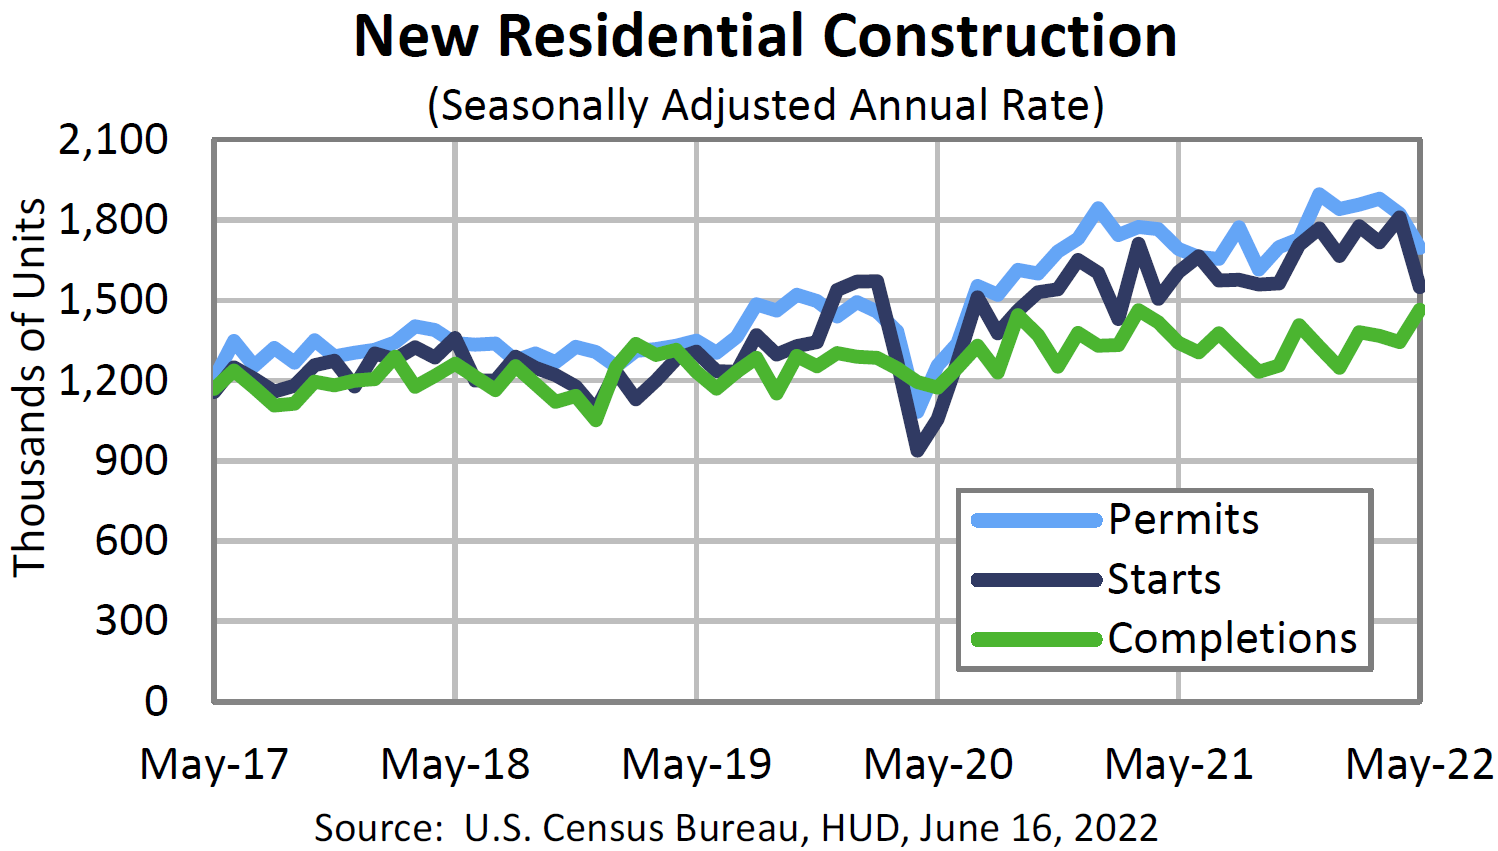
Source: U.S. Census Bureau, MONTHLY NEW RESIDENTIAL CONSTRUCTION, MAY 2022 (6/16/22)
Bottom Line
We assume continued volatility across virtually all financial markets for at least as long as the war persists. Alternatively, downside equity volatility could lessen after a Fed “pivot” from its aggressive tightening monetary policies. We believe that many financial markets have priced in at least partially increased probabilities of stagflation and/or recession possibilities. We believe that such risks have increased after May’s CPI report and the Fed’s June meeting. In the context of high volatility, we remain constructive that commodity prices will remain elevated along with elevated interest rates. In our prior commentaries we highlighted that the Fed was very concerned about liquidity in the Treasury markets and in particular in the front part of the yield curve. Likewise, the Fed expressed its concern over commodity price swings and counter-party risks. Less liquidity typically means more volatility.
We are still waiting for analysts’ revisions that would lower earnings projections and would anticipate margin compression. We also continue to uphold our conviction that predictable margins should become increasingly important in evaluating appropriate investments. Last week’s equity downturn might have begun the process of the market anticipating analysts’ downward revisions.
Our fundamental investment approach for long-term investors remains the same as expressed in our recent commentaries. We maintain our preference for large-cap high quality stocks in a diversified portfolio with at least some commodity exposure.
Data as of 6/17/2022
Data as of 6/22/2022
Definitions:
PCE Price Index (headline) – The PCE Price Index uses the personal consumption expenditures component of the Personal Income and Outlays report to derive the PCE Price Index, which is the third major component of Personal Income and Outlays showing how prices are periodically inflating or deflating.
Core PCE inflation – The “core” PCE price index is defined as personal consumption expenditures (PCE) prices excluding food and energy prices. The core PCE price index measures the prices paid by consumers for goods and services without the volatility caused by movements in food and energy prices to reveal underlying inflation trends.
Headline Consumer Price Index (Headline CPI) – Headline inflation is the raw inflation figure reported through the Consumer Price Index (CPI) that is released monthly by the Bureau of Labor Statistics (BLS). The CPI calculates the cost to purchase a fixed basket of goods to determine how much inflation is occurring in the broad economy. The CPI uses a base year and indexes the current year’s prices, according to the base year’s values.
Core Consumer Price Index (Core CPI) – Core inflation removes the CPI components that can exhibit large amounts of volatility from month to month, which can cause unwanted distortion to the headline figure. The most commonly removed factors are those relating to the costs of food and energy. Food prices can be affected by factors outside of those attributed to the economy, such as environmental shifts that cause issues in the growth of crops. Energy costs, such as oil production, can be affected by forces outside of traditional supply and demand, such as political dissent.
Headline Producer Price Index (Headline PPI) – The Producer Price Index (PPI) is a family of indexes that measures the average change over time in selling prices received by domestic producers of goods and services. PPIs measure price change from the perspective of the seller. The BLS separates PPI data into three main areas of classification: industry, commodity, and commodity-based final and intermediate demand
Core Producer Price Index (Core PPI) – Core PPI refers to the index of finished goods and is generally what economists refer to when the producer price index is referenced. Footwear, soap, tires, and furniture are among the items included in core PPI.
U.S. Dollar Index (DXY) – The U.S. dollar index (DXY) is a measurement of the dollar’s value relative to six foreign currencies as measured by their exchange rates. Over half the index’s value is represented by the dollar’s value measured against the euro. The other five currencies include the Japanese yen, the British pound, the Canadian dollar, the Swedish krona, and the Swiss franc.
Recession – A recession is a macroeconomic term that refers to a significant decline in general economic activity in a designated region. It had been typically recognized as two consecutive quarters of economic decline, as reflected by GDP in conjunction with monthly indicators such as a rise in unemployment. However, the National Bureau of Economic Research (NBER), which officially declares recessions, defines a recession as a significant decline in economic activity spread across the economy, lasting more than a few months, normally visible in real GDP, real income, employment, industrial production, and wholesale-retail sales.
Federal Funds Rate – The term federal funds rate refers to the target interest rate set by the Federal Open Market Committee (FOMC). This target is the rate at which the Fed suggests commercial banks borrow and lend their excess reserves to each other overnight.
IMPORTANT DISCLOSURES
The views and opinions included in these materials belong to their author and do not necessarily reflect the views and opinions of NewEdge Capital Group, LLC.
This information is general in nature and has been prepared solely for informational and educational purposes and does not constitute an offer or a recommendation to buy or sell any particular security or to adopt any specific investment strategy.
NewEdge and its affiliates do not render advice on legal, tax and/or tax accounting matters. You should consult your personal tax and/or legal advisor to learn about any potential tax or other implications that may result from acting on a particular recommendation.
The trademarks and service marks contained herein are the property of their respective owners. Unless otherwise specifically indicated, all information with respect to any third party not affiliated with NewEdge has been provided by, and is the sole responsibility of, such third party and has not been independently verified by NewEdge, its affiliates or any other independent third party. No representation is given with respect to its accuracy or completeness, and such information and opinions may change without notice.
Investing involves risk, including possible loss of principal. Past performance is no guarantee of future results.
Any forward-looking statements or forecasts are based on assumptions and actual results are expected to vary from any such statements or forecasts. No assurance can be given that investment objectives or target returns will be achieved. Future returns may be higher or lower than the estimates presented herein.
An investment cannot be made directly in an index. Indices are unmanaged and have no fees or expenses. You can obtain information about many indices online at a variety of sources including: https://www.sec.gov/fast-answers/answersindiceshtm.html or http://www.nasdaq.com/reference/index-descriptions.aspx.
All data is subject to change without notice.
© 2024 NewEdge Capital Group, LLC


