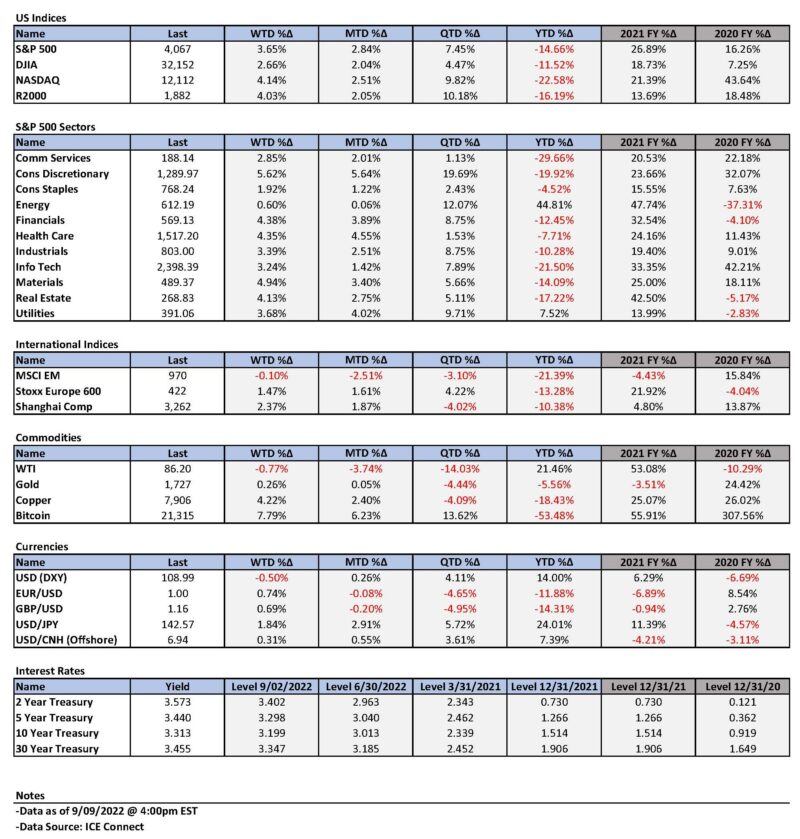
Weekly Summary: September 5 – September 9, 2022
Key Observations:
- Federal Reserve (Fed) chair Powell reiterated the Fed’s hawkish monetary stance this week. He was joined by many Fed speakers who echoed the view that the federal funds rate should be raised further and should be maintained at a restrictive level for “some time.” We understand that the Fed is in a “fight” against high rates of inflation.
- We foresee that Fed speakers will maintain a very hawkish tone in an effort to maintain tight financial conditions. To the extent financial conditions are tight, the Fed’s job of reining in high rates of inflation is made less onerous.
- Most of the economic data we examined this week continues to point to weaker global and U.S. economic growth rates and softening prices. Supply chain constraints also appear to be diminishing. Easing supply chain constraints should diminish inflation and raise economic growth.
- Many major central banks (CBs) appear to have joined the Fed’s strategy of frontloading their planned interest rate hikes in an effort to prevent inflationary expectations from becoming entrenched. It is now not uncommon to see CBs raising rates by 75 basis points (bps). We believe that many CBs have adopted the Fed’s strategy of “higher for longer” – get to a terminal rate quickly and maintain that level for “some time.” In our opinion, the now common CB approach of data dependency has become more relevant when CBs will be maintaining higher interest rates as they wait to see their tighter monetary policies filter through to the real economy. It is well known that monetary policies operate with a lag. It will be up to each CB to decipher how and when its tighter monetary policies will rein in elevated inflation rates. The incoming economic data would then be determinative of when and to what extent monetary policy needs to be adjusted further.
The Upshot: Our general investment approach remains the same as depicted in last week’s commentary. We maintain our preference for big cap high quality stocks with good balance sheets, relatively stable cash flows and stable margins. Volatility among sectors this week continues to be supportive of a well-diversified portfolio for long-term investors. Last week we highlighted the relative attractiveness of health care and financial stocks. Through Thursday, these two sectors were in the top three sectors this week. For most of Friday, it was the energy and technology sectors that we have also favored and that were included in the top performing three sectors on that day. As we have stated previously, we believe that the rise in the 10-year Treasury yield is most hurtful to the equity markets and this is particularly true for growth and other long-duration type stocks like technology stocks. In our August 12 weekly we highlighted the unattractive risk-reward characteristics of many stocks at the then more elevated stock prices. We anticipated volatility increasing from that point onwards. We anticipate a continuation of volatility across virtually all financial markets. Even though there have been some downward revisions of earnings and margins of many stocks over the past couple of months, we envision more downward revisions that could put more downward pressure on stock prices.
We maintain our conviction that equities should only be purchased on market downturns. We surmise that selective stock picking will continue to play a critical role in outperformance. We accept that low liquidity and one-sided positioning will continue to play a significant role in financial markets as these factors probably will exacerbate market volatility. We would not be surprised if volatility were to increase as the Fed reduces its balance sheet more aggressively and drains more liquidity out of the financial system. Seasonal factors may also play a role in market volatility. Historically, September is the worst performing month of the year in this century. September and October typically also have high levels of volatility. But the good news is that U.S.mid-term election years have a strong finish and that typically Q4’s are the strongest quarters of the year.
“Eye of the Tiger” – Fed Fights to Rein in Inflation
Fed chair Powell reiterated on Thursday the Fed’s resolve to rein in inflation and his commitment that the Fed will “keep at it until the job is done.” We viewed Powell’s statements as consistent with his Jackson Hole speech as discussed in our August 26 weekly. The Fed-speak summarized in last week’s commentary and continued this week confirmed Powell’s resolve. We view the Fed’s aggressive tightening stance as “fighting” words that made us think of Survivor’s song “Eye of the Tiger.” We believe that the Fed will be “rising up to the challenge” and will be “hanging tough.” The Fed will continue to examine every economic data point that comes to their attention very carefully. In other words, the Fed will be “watching us all with the eye of the tiger.” The noted Fed “whisperer”, Wall Street Journal (WSJ) reporter Nick Timiraos, wrote on Wednesday morning that the Federal Open Market Committee (FOMC) “appears to be on a path to raise interest rates [federal funds rate] by another 0.75 percentage points this month.” Although our conviction of a 50-basis points (bps) hike in the federal funds rate by the Fed at its September 20-21 meeting in lieu of a 75-bps hike was lessened somewhat after Powell’s August 26 Jackson Hole speech, we still maintained that view until Wednesday. Our current view is now for a 75-bps hike in September, a 50-bps hike in November, and a 25-bps hike in December. This would get the federal funds rate to the rather restrictive range of 3.75-4.0 by the year end. If our assumptions about slowing economic growth and slowing inflation rates are correct, we surmise that this range might even be in the terminal rate range. As many Fed representatives have stated, we then expect the Fed to maintain this level for quite “some time.” We do not expect the Fed to cut rates in 2023. Our views, much like the Fed, remain data dependent.
Fed Wants Tight Financial Conditions
We postulate that a principal reason for the Fed stepping up its fight against high rates of inflation was that financial conditions had become increasingly “easy” from mid-June through mid-August as interest rates decreased and U.S. equities rose. Powell’s Jackson Hole speech was meant to dispel hopes for the Fed to turn more dovish in the near future. He wanted to quash any hopes for a cut in interest rate for some time. From all appearances, that speech succeeded in achieving Powell’s purpose. Since then, Fed-speak was very directed at strengthening that message. It is our suspicion that the Fed did not want to risk the easing of financial conditions if it raised the federal funds rate by “only” 50 bps at its September meeting. As we have stated in a previous commentary, tight financial conditions help the Fed do its job of reining in inflation. We understood that signals of weakening global and U.S. economic growth, along with signs of slowing inflation and moderating wage pressures as depicted in our prior commentaries, might be sufficient so that the Fed would only have to raise the federal funds rate 50 bps in September. The doubling of the runoff of the Fed’s bloated balance sheet starting in September to a monthly decrease of $95 billion (quantitative tightening – QT) was another reason that we held our expectation of a 50-bps hike. The Fed’s heightened concerns over maintaining tight financial conditions appear to have taken precedence.
ECB Hikes 75 BPS
As expected, the European Central Bank (ECB) also raised its benchmark deposit rate by 75 bps on Thursday. This was the largest increase in ECB’s history. The ECB had raised rates 50 bps at its prior meeting, which was its first hike in over a decade. Even though the ECB was one of the last major central banks to begin raising rates, it now seems to embrace the view that whatever terminal rate they wanted to achieve, it was better to attain that level more quickly. The ECB stated: “This major step frontloads the transition from the prevailing highly accommodative level of policy rates towards levels that will ensure the timely return of inflation to the ECB’s 2% medium-term target.” The ECB then added that it will need to “raise interest rates further, because inflation remains far too high and is likely to stay above target for an extended period.” The ECB also revised up its inflation forecasts for 2022, 2023 and 2024. Additionally, the ECB revised lower its economic growth projections for 2023 and 2024. But if there was a complete shut off of Russian energy supply to the rest of Europe and rationing, the new projected growth rate of 0.9% for 2023 would then be projected to be a contraction of 0.9%. President of ECB, Christine Lagarde, said that the ECB remained data dependent meeting by meeting. Lagarde continued to characterize Eurozone (EU) inflation as “still predominantly a supply driven phenomenon” that was affected by factors outside of the ECB’s control.
BOC Hikes 75 BPS
The Bank of Canada (BOC) also raised its key overnight rate 75 bps this week as expected. This was BOC’s fifth consecutive hike raising Canada’s borrowing costs to their highest levels since 2008. BOC indicated that it will need to continue raising rates given its inflation outlook and that surveys suggested short-term inflation expectations remain elevated.
RBA Hikes 50 BPS
The Reserve Bank of Australia (RBA) raised rates this week for the fifth consecutive month 50 bps to a seven-year high. Australia’s inflation rate is at a 21-year high. The RBA also expects further hikes this year.
Are Central Banks Really Data Dependent?
We suppose that the confluence of so many major central banks (CBs) aggressively raising their key interest rates might possibly have an outsized effect on global economic growth, especially given the lags of monetary policies taking full effect. Most continue to say they are data dependent, including the Fed. However, it seems to us that many CBs are frontloading their interest rate hikes to get to a sufficiently restrictive terminal rate as quickly as possible and then pause for some time to properly assess the impact of their tightening monetary policies. Perhaps it is during this waiting period when rates are deemed to be sufficiently high to rein in inflation that CBs will be really data dependent. Could this be when CBs are truly data dependent?
Decreasing Energy Prices as a Reflection of Slowing Economic Growth Concerns
Perhaps the best indication of concerns over slowing global economic growth was the continued decline in energy prices this week. Worries about China’s demand for energy weighed on energy prices as COVID-19 related lockdowns and/or mass testing continued in China due to its dynamic zero-COVID-19 policies. More than sixty million Chinese people were in some sort of lockdown this week. On September 5, CNN observed that since late August more than seventy cities had been placed under at least a partial lockdown that affected more than 300 million people. Apparently, some cities even rushed to a lockdowns in a show of loyalty to President Xi Jinping’s zero-COVID policies. There is growing speculation that once Xi is re-elected for his third term during the upcoming 20th Party Congress which starts October 16, that COVID policies might be relaxed to the benefit of China’s economy. This would also help release supply constraints and disruptions, which could lessen inflationary pressures.
China’s Slowing Exports and Imports – Trade Report
China’s slowing trade growth in August was mostly due to its export growth unexpectedly slowing. Lessening exports demand exacerbated concerns over China’s demand for commodities. Overseas surging inflation probably hampered demand. Moreover, China lockdowns and oppressive heat waves also probably limited China’s ability to meet whatever export demand there was. China’s August exports rose 7.1% year-over-year (y/y) compared to an 18.0% y/y increase in July and an expected increase of 12.8%. Lower-than-expected August imports were another sign of slowing economic Chinese demand. The worst heatwaves in decades and China’s property crisis were often cited as explanations for diminished economic activity. China’s weakened import growth was a particularly bad sign for commodity producers. We remain optimistic that many of the most negative economic growth trends in China will reverse following Xi’s re-election. The need to replenish the U.S. Strategic Petroleum Reserves (SPR) in the upcoming months, as well as the possibility of OPEC+ cutting its oil production targets further at its upcoming October meeting, are other possible catalysts for oil price increases. To the extent that energy prices rebound, inflationary pressures could reassert themselves. The revival of an Iranian nuclear deal would unleash more available oil supplies and would therefore have a disinflationary impact.
Russian Energy Supplies
The future availability and prices of Russian energy supplies remains an open question. After first claiming maintenance-type issues were responsible for the continued shut down of natural gas flows into Germany through the Nord Stream 1 (NS1) pipeline, Russia decided to halt indefinitely natural gas supplies into Europe from this main pipeline. Russia claimed punitive economic sanctions from the “West” were responsible for this decision. Gazprom has halted all exports via the NS1 pipeline from August 31. On September 2, the G-7 finance ministers decided to back a proposal to put a price-capping mechanism on Russian oil by December 5. According to Reuters on September 7, Russia’s President Vladimir Putin threatened to cut off energy supplies if price caps are imposed on Russia’s oil and gas exports. According to J.P. Morgan (JPM) on September 6, Russia’s oil minister Novak said that Russia would not sell oil or oil products to countries participating in this price cap initiative. The G-7 discussions are continuing.
Europe Suffers More
EU countries have suffered more than the U.S. in terms of energy prices – mostly due to their reliance on natural gas supplies from Russia. According to the New York Times on September 5, some EU countries are becoming concerned increasingly about social unrest as colder weather approaches. Over the past weekend, at least three EU countries announced relief measures to deal with soaring energy prices. The biggest package was Germany’s $65 billion in relief measures meant to cushion the blow from high inflation and energy costs. The Swedish government pledged $23 billion to help energy companies purchase needed inputs. Without such support, some Swedish electricity providers could be in technical default as early as Monday. The Czech Republic also planned support measures for its population. Later this week, UK’s new Prime Minister Liz Truss pledged to cap British households’ energy costs at 2,500 pounds per year for the next two years beginning October 1. It was estimated that this would save each household about 1,000 pounds of energy costs per year. It was estimated that this plan would cost the British government 150 billion pounds. Global economic growth concerns are clearly increasing.
U.S. Housing Market Continues to Weaken
The U.S. housing market continues to show signs of weakening further. Housing, along with the auto sector, are two of the sectors most sensitive to increasing interest rates. According to the Mortgage Bank Association, the average fixed 30-year mortgage rate with conforming loan balances increased to 5.94% last week from 5.80% the prior week. These mortgages require a 20% down payment. By Wednesday, the mortgage rate was as high as 6.25%. Mortgage applications to purchase a home last week dropped 1% from the prior week and were 23% lower than the same week one year ago.
Fed’s August Beige Book
The Fed’s August Beige Book was released this week. It is published eight times per year and is meant to reflect current economic conditions across the Fed’s twelve Districts and illustrate how such conditions have changed from the latest report. This report is based mostly on qualitative information that is collected from a wide range of contacts. The overall economic activity was characterized unchanged from the last report as five districts reported slight to modest growth in activity and five others slight to modest softening. Although consumer spending levels were steady, households continued to trade “down” and to shift spending away from discretionary goods and more towards essentials like food. Auto sales remained “muted” across most Districts due to limited inventories and high prices. Residential real estate conditions “weakened noticeably” as home sales fell in all 12 Districts. Higher interest rate were having an impact. Commercial real estate also softened, especially for office space. Loan demand was mixed—generally strong credit card demand and demand for commercial and industrial loans but weak for residential loan demand. The outlook for future economic growth remained weak. Most contacts noted a further “softening“ of demand for the next six to 12 months. Although labor market conditions remained “tight,” nearly all Districts reported some improvement in labor availability and employers’ ability to retain workers. Wages grew generally at a slower pace and moderating wage expectations were widespread. Some moderation of price increases were also noted. We would characterize this report as showing a tendency for lessening economic growth and to show the beginnings of a better supply-demand balance for workers and the beginning of a slowing of price increases. However, the fewer initial unemployment claims announced this week pointed to a labor market that remained quite tight. We thought that the weakness of the outlook for economic growth was particularly noteworthy.
Eurozone August Composite and Services PMIs
In general, the August Services and Composite Purchasing Managers Index (PMIs) for many countries reflected weakening economies. Germany was the primary driver for the composite August PMI contracting. The S&P Global Eurozone composite PMI business activity index contracted for the second consecutive month and reached an 18-month low. The Eurozone services sector contracted to a 17-month low after an expansionary month in July. This was the first month of contraction for services since March 2021. Manufacturing declined for the third consecutive month. Weakness in general activity was reflected by falling demand with new orders decreasing at a faster pace. Both input and output prices continued to soften to the slowest increases in six months. The slowdown in prices became broader as well. Optimism dropped again in August and was the weakest since October 2020. Job growth also declined to its weakest pace since May 2021. Consumer facing services like travel began to falter as households began cutting back on nonessentials.
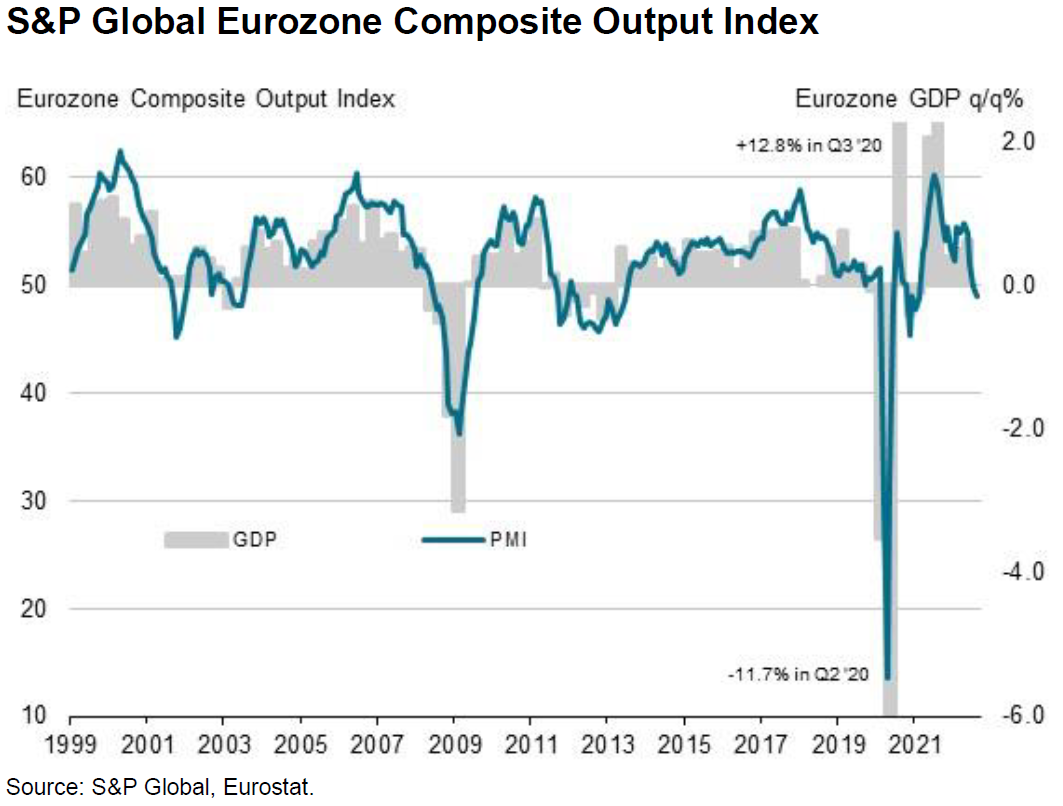
Source: S&P Global, S&P Global Eurozone Composite PMI (9-5-2022)
Comparing S&P Global and ISM U.S. Services PMIs
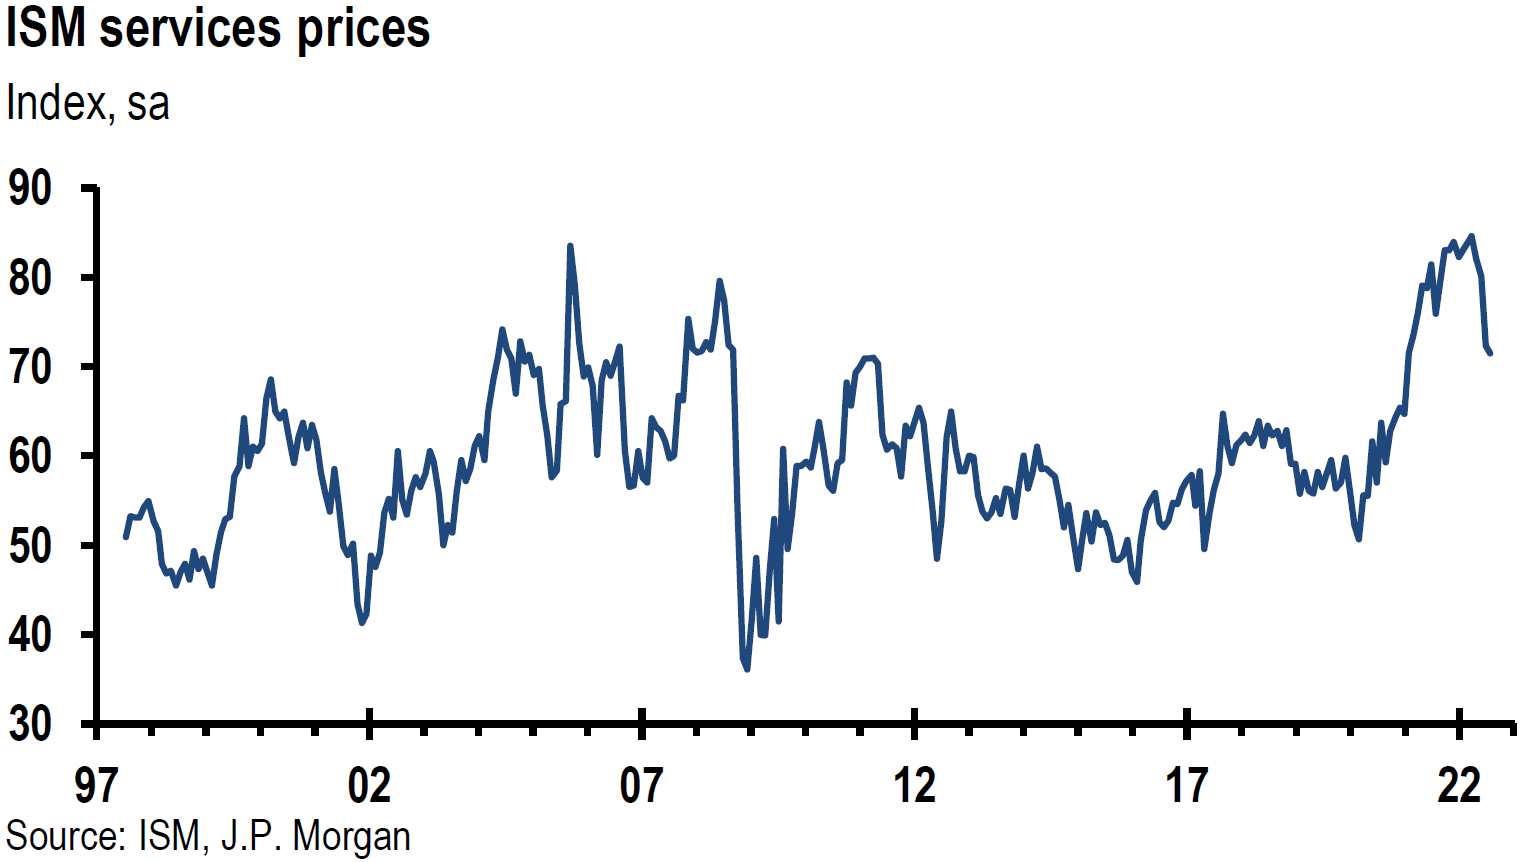
Much like the July divergence between the S&P Global U.S. Services PMI and the ISM Services PMI depicted in our August 5 weekly, the August PMIs also illustrated a markedly different showing of the U.S. economy. The ISM August Services PMI rose more than expected to 56.9%. The composition of this report was strong as business activity, new orders, and employment increased. However, price pressures softened to the slowest pace since January 2021. Even though services continued to expand in August, the ISM services surveys showed signs of cooling in recent months relative to late last year. This survey also indicated an easing of supply chain issues as supplier delivery times improved. The August ISM services showed the strongest growth in services activity in four months. The August S&P Global Services PMI contracted more than expected and had a reading of 43.7, making this the sharpest contraction for U.S. services since May 2021. New orders fell at the slowest pace in over two years and employment grew at the slowest pace since January. Both input and output prices eased to the slowest increases in sixteen months. Low demand continued to weigh on expectations even though business confidence was at a three month high. The ISM survey is a more inclusive report. As we noted in our August 5 weekly: “The ISM survey focuses on large multinational companies, whereas the S&P survey polls a more mixed set of companies by size. Unlike, the S&P survey ISM includes the public sector, construction and mining sectors. The ISM gives an equal weight to its five underlying components, whereas S&P ascribes a higher weight to the more forward looking components of its survey.” Once again, the ISM is the outlier. We have highlighted repeatedly that larger companies have had an advantage over smaller competitors during most of the pandemic. The public sector most likely has had advantages because of its size. Optimism has been higher among larger companies in general. When all of these differences are factored in, we conclude that the smaller private U.S. companies are most likely seeing their services activity contract. Since much of the U.S. job creation occurs at the smaller private companies, we believe that at some point we might see a quicker resolution to the demand-supply imbalance in the labor force as the prospects for smaller private companies diminish relative to their larger competitors.
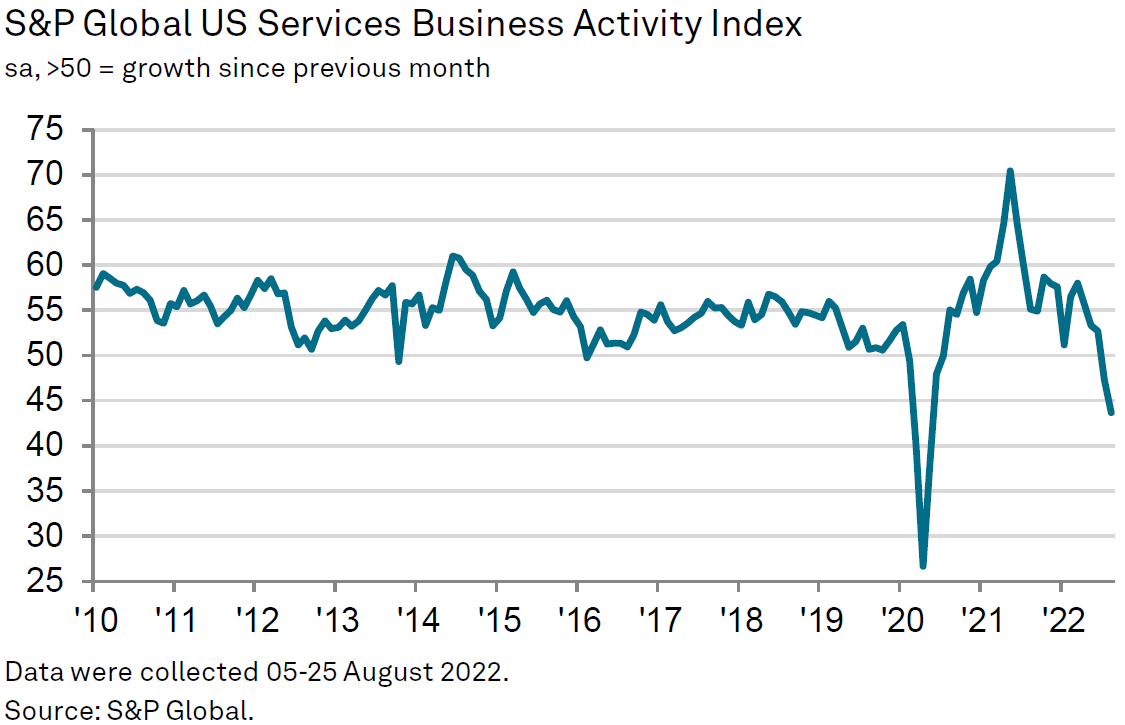
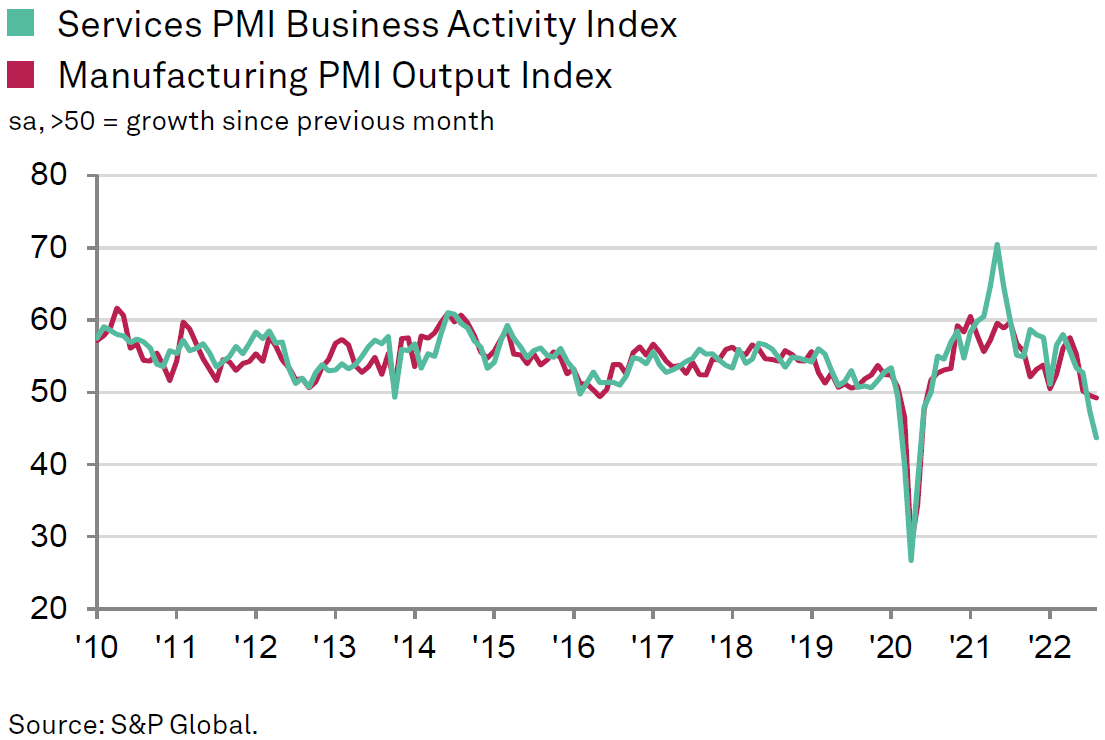
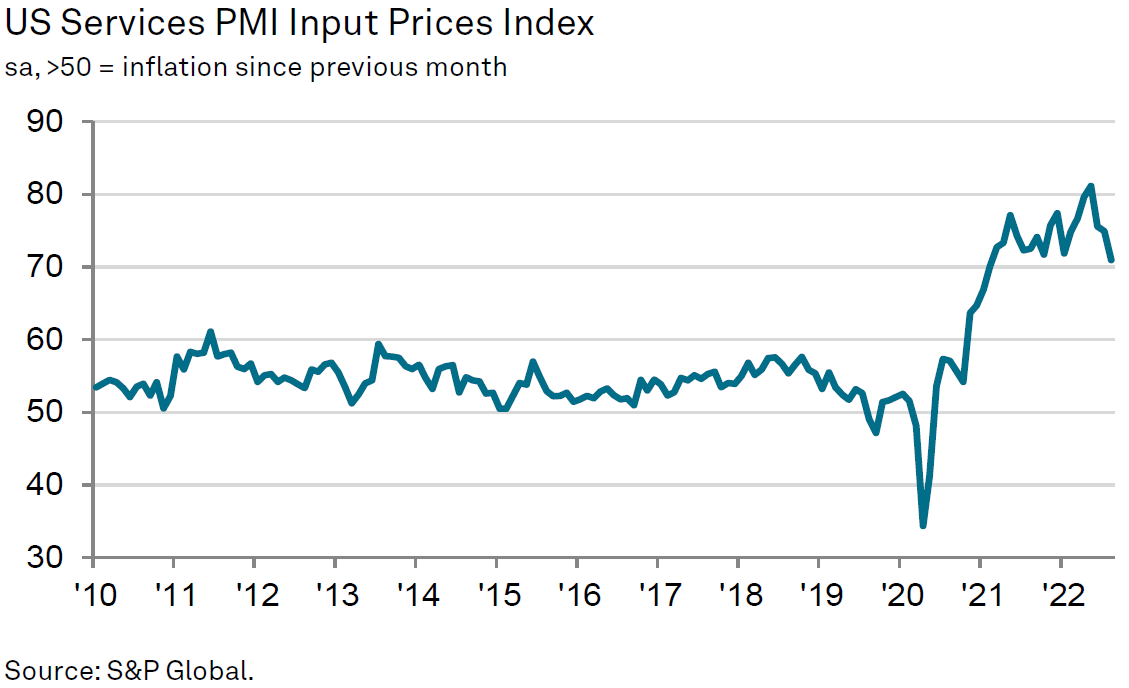
Source: S&P Global, S&P Global US Services PMI (9-6-2022)
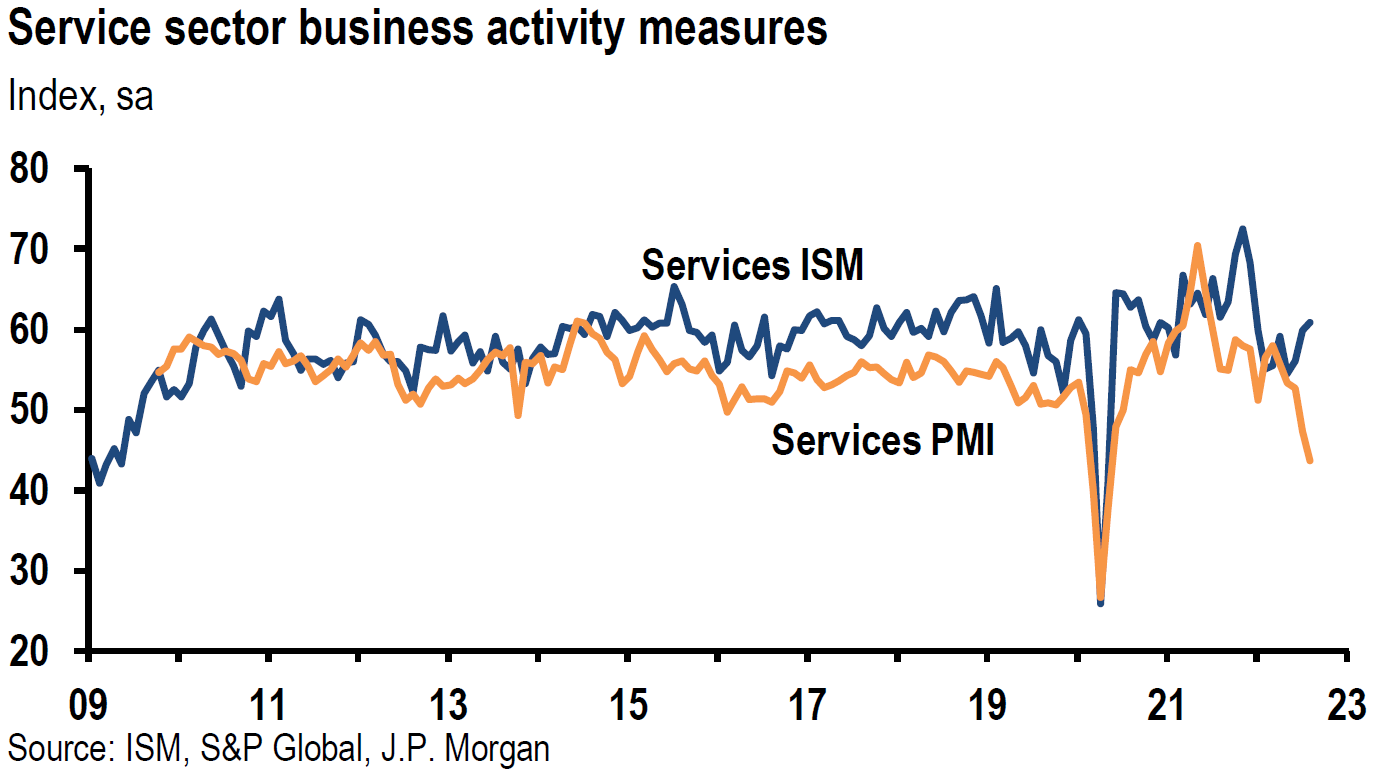
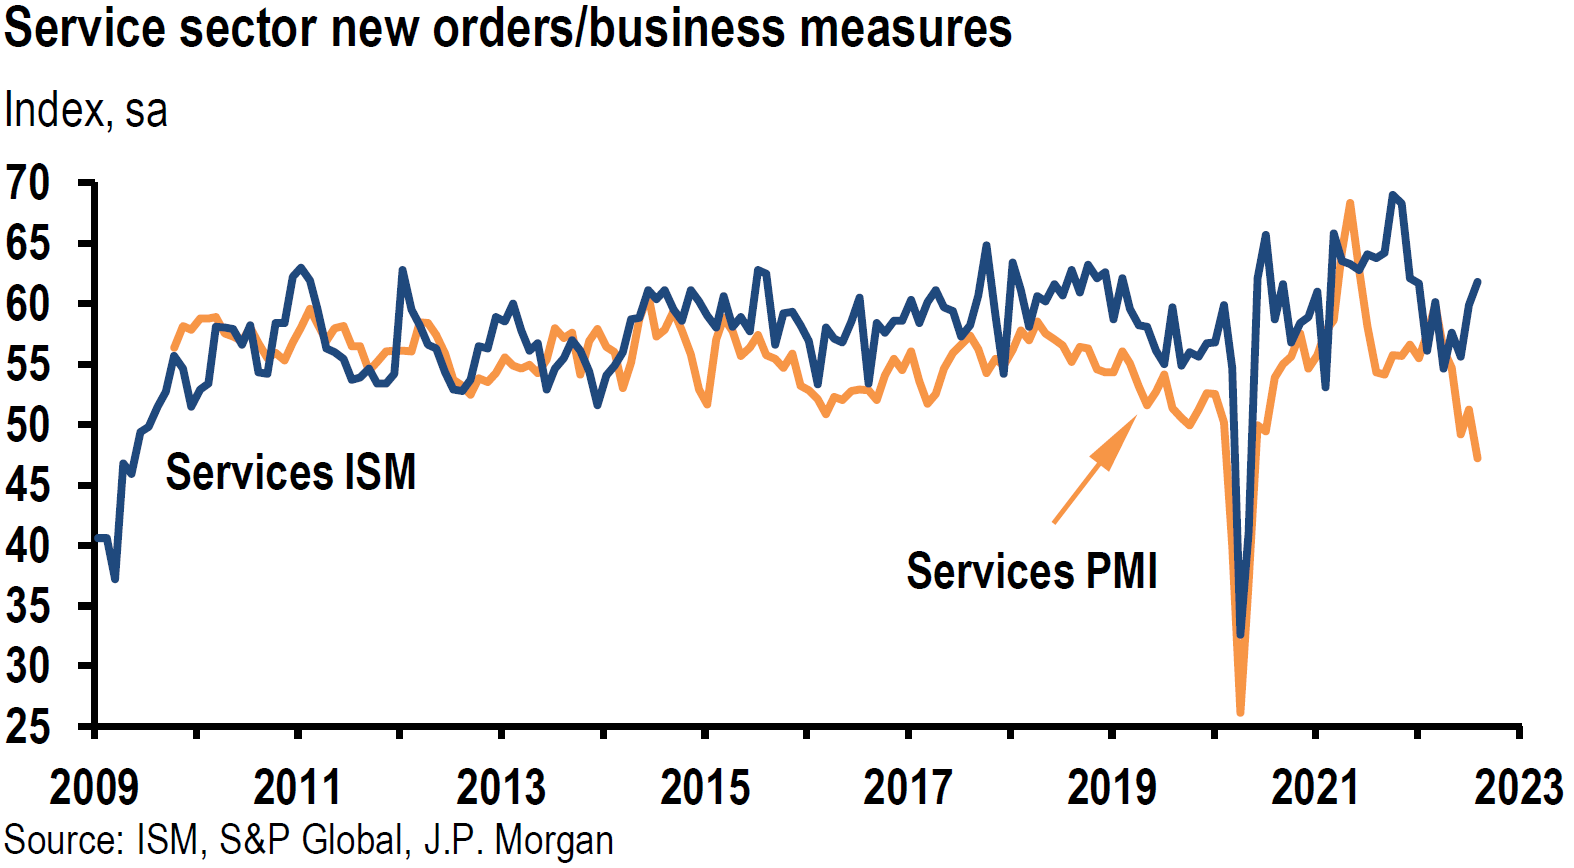
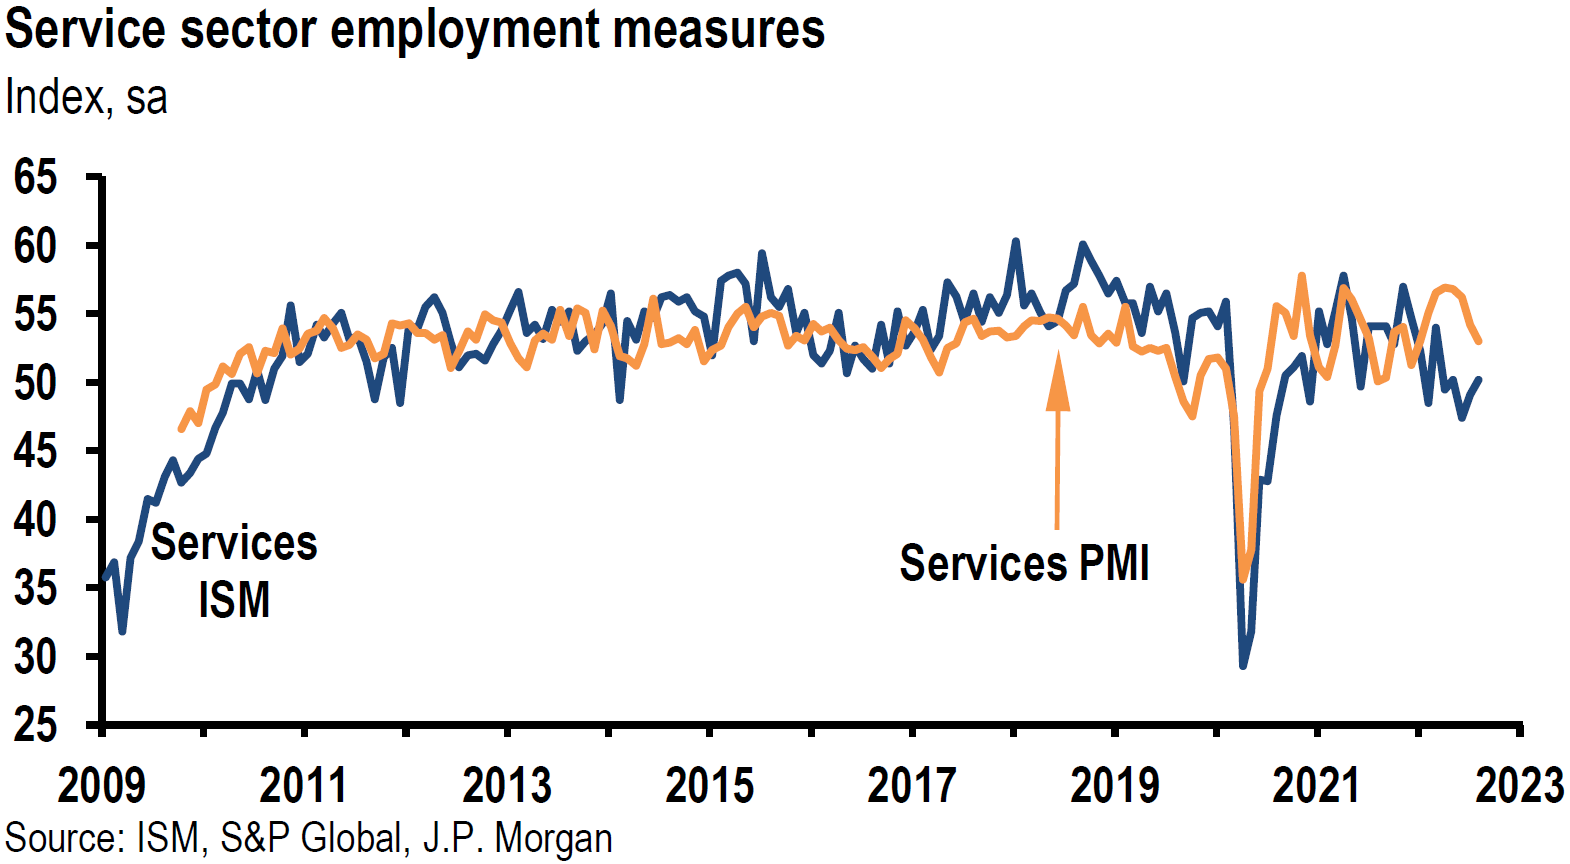
Source: JP Morgan, US: Services ISM firms in August (9-6-2022)
Selected Fed-Speak
Fed vice-chair Lael Brainard stated this week that “we are in this for as long as it takes to get inflation down.” She reiterated the now rather common language of Fed officials that interest rates need to remain elevated “for some time.” She thought it “especially important” to guard against expectations of households and businesses that inflation would remain above the Fred’s 2% target. She noted anecdotal evidence of diminishing price pressures in the retail sector. She also thought that there “could be scope for reduction” in auto industry profit margins, which she characterized as “unusually large” as reflected by the gap between wholesale and retail prices. Cleveland Fed president Loretta Mester continued her hawkish rhetoric of last week. She warned against declaring an early victory in reining in inflation and thought that it was necessary to see declining rates of inflation over several months.
Bottom Line
For the time being, we are maintaining our basic investment approach as expressed in last week’s commentary. We will continue to favor high quality big cap stocks that offer good balance sheets, as well as relatively stable cash flows and profit margins. For long-term investors who are prepared to tolerate volatility, we still maintain a preference for selected high quality big-cap growth stocks along with energy stocks in a well-diversified portfolio. Financial and health care stocks are also favored. Many uncertainties remain. We continue to forecast rapid changes in economic trends, many of which could be “surprising.”
We foresee that the continuing weakening trends in the U.S. and global economies should reduce demand sufficiently so that inflation would be lowered. Tightening financial conditions are already having deleterious effects on economic growth. This is particularly true for interest rate sensitive sectors, such as the housing sector. The lag effects of tighter monetary policies can be unpredictable in terms of timing and magnitude. We believe that the Fed should show “patience” and review incoming data before assessing the effects of its policies. This is where we see biggest impact of a data dependent approach in implementing tighter monetary policies. We have been waiting patiently for downward revisions in earnings and profit margin estimates. Although we have seen some downward revisions, we assume that more are coming.
We continue to view the Fed’s “higher for longer” interest rate approach along with our assumptions regarding slower economic growth rates and slowing inflation rates as our version of a “soft” Fed pivot. We have never assumed any interest rate cuts during 2023 in this characterization. We continue to see a terminal federal funds rate of close to 4%. If our interpretation is correct, we believe that the downside of equities could be more limited than many people expect. But we do expect volatility that might even be extreme at times. Treasury yields have been somewhat steady recently, but with an upward bias. We will continue to monitor the 2-year/10-year Treasury inverted yield curve very closely. This inversion is still much less than the mid-August levels. We are encouraged to the extent this part of the yield curve steepens. In our opinion, a less inverted yield curve means that the bond market does not believe that the Fed will raise rates to such an extent that would cause more economic damage. If there is a U.S. recession, we believe that it most likely will be a mild one.
Definitions
Basis Points (bps) – A basis point is one hundredth of one percent, used chiefly in expressing differences of interest rates.
Steeper Yield Curve – If the yield curve steepens, this means that the spread between long- and short-term interest rates widens. It typically indicates stronger economic activity and rising inflation expectations, and thus, higher interest rates. When the yield curve is steep, banks are able to borrow money at lower interest rates and lend at higher interest rates.
Flattening Yield Curve – The flat yield curve is a yield curve in which there is little difference between short-term and long-term rates for bonds of the same credit quality. This type of yield curve flattening is often seen during transitions between normal and inverted curves.
Growth Stock – A growth stock is any share in a company that is anticipated to grow at a rate significantly above the average growth for the market. These companies generally do not pay dividends, instead growth stocks tend to reinvest any earnings they accrue in order to accelerate growth in the short term.
Federal Funds Rate – The term federal funds rate refers to the target interest rate set by the Federal Open Market Committee. This target is the rate at which commercial banks borrow and lend their excess reserves to each other overnight.
Fed Funds Terminal Rate – The terminal rate is defined as the peak spot where the benchmark interest rate, the federal funds rate, will come to rest before the central bank begins trimming it back.
Producer Price Index (PPI) – The producer price index (PPI), published by the Bureau of Labor Statistics (BLS), is a group of indexes that calculates and represents the average movement in selling prices from domestic production over time. It is a measure of inflation based on input costs to producers.
ISM services PMI – The Institute of Supply Management (ISM) services PMI (formerly known as Non-Manufacturing Index) is an economic index based on surveys of more than 400 non-manufacturing (or services) firms’ purchasing and supply executives.
S&P Global Services PMI – The S&P Global US Services PMI is compiled by S&P Global from responses to questionnaires sent to a panel of around 400 service sector companies.
S&P Global Manufacturing PMI – The S&P Global US Manufacturing PMI is compiled by S&P Global from responses to questionnaires sent to purchasing managers in a panel of around 800 manufacturers.
S&P Global Composite PMI – The S&P Global Composite PMNI is the weighted average of manufacturing and service sector PMIs for a given geography or economy.
Federal Open Market Committee (FOMC) – The Federal Open Market Committee (FOMC) is the branch of the Federal Reserve System that determines the direction of monetary policy specifically by directing open market operations. The committee is made up of 12 members: the seven members of the Board of Governors; the president of the Federal Reserve Bank of New York; and four of the remaining 11 Reserve Bank presidents on a rotating basis.
Quantitative Tightening (QT) – Quantitative tightening refers to monetary policies that contract, or reduce, the Federal Reserve System’s balance sheet.
Fed’s Beige Book – The Beige Book is a qualitative review of economic conditions drawing on reports from 12 district banks. It is published eight times annually before meetings of the Federal Open Market Committee, which uses the results in its planning and decision-making processes.
The Group of Seven (G-7) – G-7 is an intergovernmental organization made up of the world’s largest developed economies: France, Germany, Italy, Japan, the United States, the United Kingdom, and Canada. Government leaders of these countries meet periodically to address international economic and monetary issues.
Eurozone – The eurozone, officially known as the euro area, is a geographic and economic region that consists of all the European Union countries that have fully incorporated the euro as their national currency.
Nord Stream Pipeline 1 – The Nord Stream 1 pipeline stretches 745 miles under the Baltic Sea to transport natural gas from the Russian coast to north-eastern Germany.
IMPORTANT DISCLOSURES
The views and opinions included in these materials belong to their author and do not necessarily reflect the views and opinions of NewEdge Capital Group, LLC.
This information is general in nature and has been prepared solely for informational and educational purposes and does not constitute an offer or a recommendation to buy or sell any particular security or to adopt any specific investment strategy.
NewEdge and its affiliates do not render advice on legal, tax and/or tax accounting matters. You should consult your personal tax and/or legal advisor to learn about any potential tax or other implications that may result from acting on a particular recommendation.
The trademarks and service marks contained herein are the property of their respective owners. Unless otherwise specifically indicated, all information with respect to any third party not affiliated with NewEdge has been provided by, and is the sole responsibility of, such third party and has not been independently verified by NewEdge, its affiliates or any other independent third party. No representation is given with respect to its accuracy or completeness, and such information and opinions may change without notice.
Investing involves risk, including possible loss of principal. Past performance is no guarantee of future results.
Any forward-looking statements or forecasts are based on assumptions and actual results are expected to vary from any such statements or forecasts. No assurance can be given that investment objectives or target returns will be achieved. Future returns may be higher or lower than the estimates presented herein.
An investment cannot be made directly in an index. Indices are unmanaged and have no fees or expenses. You can obtain information about many indices online at a variety of sources including: https://www.sec.gov/fast-answers/answersindiceshtm.html or http://www.nasdaq.com/reference/index-descriptions.aspx.
All data is subject to change without notice.
© 2024 NewEdge Capital Group, LLC


