

Weekly Summary: December 26 – 30
Key Observations:
- We have characterized the Institute for Supply Management (ISM) services PMI as an outlier compared to many other Purchasing Managers’ Indexes (PMI), given its relative strength. The ISM services PMI for December, which was released on Friday, was much weaker than anticipated. We no longer characterize it as an outlier. We have also chosen to highlight “rapidity of change” as a principal characteristic of economies and financial markets since the onset of the pandemic. The sudden weakness in the ISM services PMI is an example of this characteristic.
- Rapid and unexpected changes can lead to dramatic changes in financial markets. The dramatic financial markets’ reaction to the much weaker than expected ISM services PMI for December was a clear example of this as interest rates and the U.S. dollar (USD) traded lower and equity prices traded generally higher.
- The unexpected lowering of average earnings in the December U.S. payroll data and the downwardly revised average earnings in both November and October was a welcome surprise to financial markets. The Fed is focused on the need for wage growth to be lowered to a level that is more compatible with a 2% rate of inflation. We will continue to monitor wage growth trends very closely.
- The minutes of the FOMC December 13-14 meeting tried to convey the Federal Reserve’s (Fed) unwavering resolve to reach its targeted 2% rate of inflation goal. The minutes showed that no participants anticipated cutting the federal funds rate in 2023. Many participants showed their frustration that “unwarranted” easing of financial conditions could make it more difficult to achieve a 2% rate of inflation.
The Upshot: Our general investment approach remains the same as depicted in last week’s commentary. We maintain our preference for big cap quality stocks with good balance sheets, relatively stable cash flows and stable margins. Volatility across sectors continues to be supportive of a well-diversified global portfolio for long term investors. As the Fed’s “quantitative tightening” (QT – contraction of the Fed’s balance sheet) progresses, we expect liquidity to contract in financial markets.
Since our November 18 commentary, we have been postulating that the two-to-10-year Treasury yield curve inversion will be more volatile than the 10-year Treasury yield as the Fed’s terminal rate gets closer. It appears that has occurred and continues through this week. We maintain our view that financial markets’ concerns will continue to switch between economic slowdown concerns and inflation and Fed “overtightening” and interest rate concerns.
We are encouraged by China’s focus on economic growth and anticipate a rather robust “reopening.” This could be beneficial for commodities in general, and for base metals such as copper in particular. To the extent that China is successful in stimulating its economic growth, we anticipate many beneficial spillover effects for many countries. We expect possible further USD weakening to the extent that the global economy grows relative to the U.S. economy. We will continue to closely monitor China’s reopening.
FOMC Minutes – No Rate Cuts Anticipated in 2023
The minutes of the Federal Open Market Committee’s (FOMC or Committee) December 13-14 meeting released this week confirmed many of our observations and expectations. The minutes stated that “no participants anticipated that it would be appropriate to begin reducing the federal funds rate target in 2023.” This confirmed our expectation that the Fed would not cut the federal funds rate in 2023. These minutes echoed our emphasis from recent commentaries of the need for a flexible mindset to successfully navigate these volatile financial markets. In light of heightened uncertainty, “most participants emphasized the need to retain flexibility and optionality when moving to a more restrictive stance.” In other words, the Fed’s decisions on monetary policies would be data dependent and will be determined on a meeting-by-meeting basis. “Participants generally observed that a restrictive policy stance would need to be maintained until the incoming data provided confidence that inflation was on a sustained downward path to 2%, which was likely to take some time.”
“Unwarranted” Easing of Financial Conditions can “Complicate” Fed’s Efforts to Reach 2% rate of Inflation
Participants reaffirmed their “strong commitment” to return the rate of inflation to the Committee’s 2% target. Furthermore, participants indicated their frustration when an “unwarranted easing in financial conditions” occurred due to the public’s “misperception” of the Committee’s actions. Additionally, participants viewed such easing of financial conditions as “complicating” their efforts “to restore price stability.” Our often-expressed view of the need for continuing hawkish rhetoric from Fed officials also was highlighted in the minutes. “A number of participants emphasized that it would be important to clearly communicate that a slowing in the pace of rate increases was not an indication of any weakening of the Committee’s resolve to achieve its price stability goal or a judgment that inflation was already on a persistent downward path.” We are convinced that it was because of concerns such as these that Fed chair Powell has emphasized recently that once the Fed was in “restrictive” territory, the pace of rate hikes was less important than the terminal level of the federal funds rate. Once in “sufficiently restrictive” territory, the assumption was that such levels of the federal funds rates would be maintained for “some time” so that the cumulative lagged effects of tightening financial conditions and tightening monetary policies could be observed.
Fed’s Risk Management Approach
We first observed Powell’s new “risk management” approach in delineating the Fed’s monetary policies in our December 2 commentary. The minutes confirmed our basic understanding of this new approach as “participants discussed a number of risk-management considerations related to the conduct of monetary policy. Many participants highlighted that the Committee needed to continue to balance two risks.” One risk was that insufficiently restrictive monetary policies could lead to higher inflation for longer than anticipated, which could lead to inflation expectations no longer being “anchored.” The other risk was that the Fed would tighten more than was necessary to achieve the targeted 2% rate of inflation. This would be due likely to the “lagged cumulative effect of policy tightening.” Participants generally appeared to be most concerned with upside risks to inflation for now. But “a couple of participants noted that risks to the inflation outlook were becoming more balanced.” Finally, participants generally observed that maintaining a restrictive policy stance for a sustained period until inflation is clearly on a path toward 2% is appropriate from a risk-management perspective.
Treasury Yield Curve and Changes in Concerns of Financial Markets
Our November 18 commentary highlighted our forecast that the two-year-to 10-year Treasury yield curve would be more volatile than the 10-year Treasury yield as we approached the Fed’s terminal federal funds rate. For the most part, this has occurred generally as the inversion in this part of the yield curve continues to be volatile. Through Thursday of this week, this part of the yield curve has become more inverted by roughly 20 basis points (bps). Our November 18 commentary also highlighted that financial markets could remain very volatile as the focus of concerns could become more unpredictable. “During 2022, our principal concern revolved around inflation trends and the extent of the Fed’s monetary tightening. We now anticipate entering a period in the not-too-distant future of concerns over inflation and the Fed’s monetary tightening policies on the one hand, and escalating concerns over the extent of economic slowdowns and the effect that a slowdown will have on margins and earnings.” We postulate that such shifting of concerns has contributed to the volatility of yield curve inversion.
It is our contention that the hawkish Fed minutes, the many indications of a still very tight U.S. labor market and selected strength in economic numbers, such as U.S. construction data released this week, have contributed to financial markets’ becoming increasingly concerned that the Fed will “overtighten,” and therefore increase the probability of a recession. It is likely that the more inverted yield curve this week reflects the increased risks of a U.S. recession. The much weaker than expected ISM services PMI for December and slowing wage growth numbers shown in the December nonfarm payrolls data may have alleviated these concerns marginally.
“Good Riddance” to 2022 for Long-Term Investors
We surmise that many long-term investors would like to bid “good riddance” to the financial market turmoil and uncertainties of 2022. Green Day’s song “Good Riddance” expresses some of these sentiments. We view the beginning of this year as “another turning point.” It’s as if “time grabs you by the wrist, directs you where to go [if one “listens” to financial data and markets]; So [we hope to] make the best of this test, and not ask why; It’s not a question, but a lesson learned in time … It’s something unpredictable; But in the end it’s right.” Through Thursday, it appears that saying “good riddance” to the issues of 2022, could be easier said than done.
U.S. 2022 Holiday Retail Spending
According to Mastercard Spending Pulse (MSP), U.S. retail sales, excluding automotive, increased 7.6% year-over-year (y/y) during the holiday season – November 1 through December 24. MSP measures in-store and online retail sales across all forms of payment and is not adjusted for inflation. Online sales grew 10.6% and in-person restaurant spending increased 15.1%. Additionally, MSP data indicated that there was a shift to more services-type spending when compared to 2021 spending. Seeking personal experiences was evident in the latest spending patterns.
Weak U.S. Housing Trends Continue
Pending home sales data for the U.S. in November was released last week. The 4% month-over-month (m/m) drop was worse than the expected 1.8% decline, and has caused the pending home sales to drop to the second lowest level on record. The November drop was the sixth consecutive monthly drop. The y/y decrease was 37.8%. According to CNBC on January 3, U.S. home prices posted their smallest annual gain in two years and appreciated less than 10% y/y for the first time in 21 months. In November, home prices were about 2.5% less than their spring 2022 peak. On January 4, CNBC disclosed that mortgage applications to purchase a home were 12.2% lower last week when compared to two weeks earlier and were 42% lower y/y – ending 2022 at their lowest level since 1996. During this period, average 30-year fixed rate mortgage rates increased from 6.34% two weeks before to 6.58%. At the end of 2021, the average rate was 3.3%.
U.S. Construction Spending and Smaller November Trade Deficit Estimates Increase U.S. Q4 GDP Tracking Estimates
After a drop of 2% in October, U.S. construction spending unexpectedly rebounded in November and gained 2.0% m/m . A Reuters’ survey of economists had predicted a 0.4% drop in November. This increase was in spite of single-family construction dropping 0.5% in November. The November U.S. trade deficit fell sharply as disclosed on December 27. Based on this information, Goldman Sachs raised its Q4 tracking estimate from 1.7% to 2.0% and increased this estimate to 2.1% after accounting for the increase in construction spending. J.P. Morgan (JPM) increased its tracing estimate from 1.5% to 2.5%, taking into account both of these data points. After the U.S. November trade deficit was revised lower again on January 5, Goldman boosted its GDP Q4 tracking estimate from 2.1% to 2.5%. JPM stated that it then saw some upside risk to its 2.5% estimate.
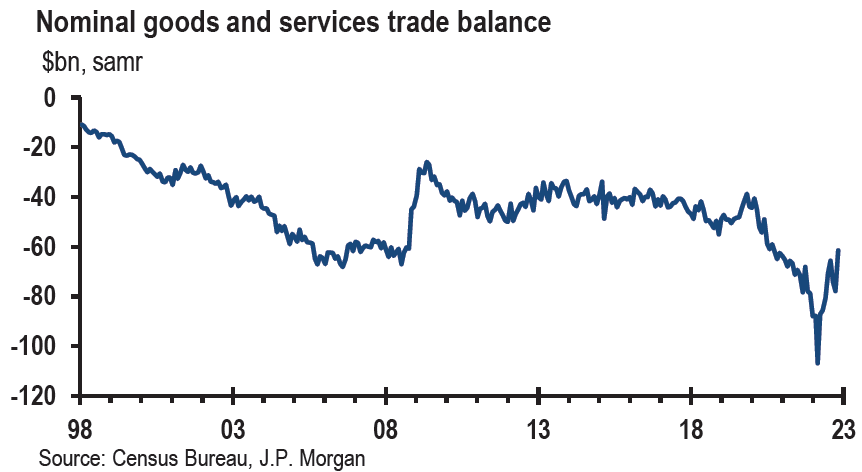
Source: JP Morgan, US: Trade deficit narrows significantly in November (1-5-2023)
Indications that a Tight U.S. Labor Market Continues
The Job Openings and Labor Turnover Survey (JOLTS) for November showed U.S. available job openings of 10.458 million versus a median forecast of 10.050 million and a prior revised 10.512 million October job openings. Open posts outnumbered available workers by about 1.7 to 1. The Quits rate increased 126,000, which indicated workers’ confidence that upon quitting their jobs, they could find other employment. These figures were broadly consistent with labor market strength.
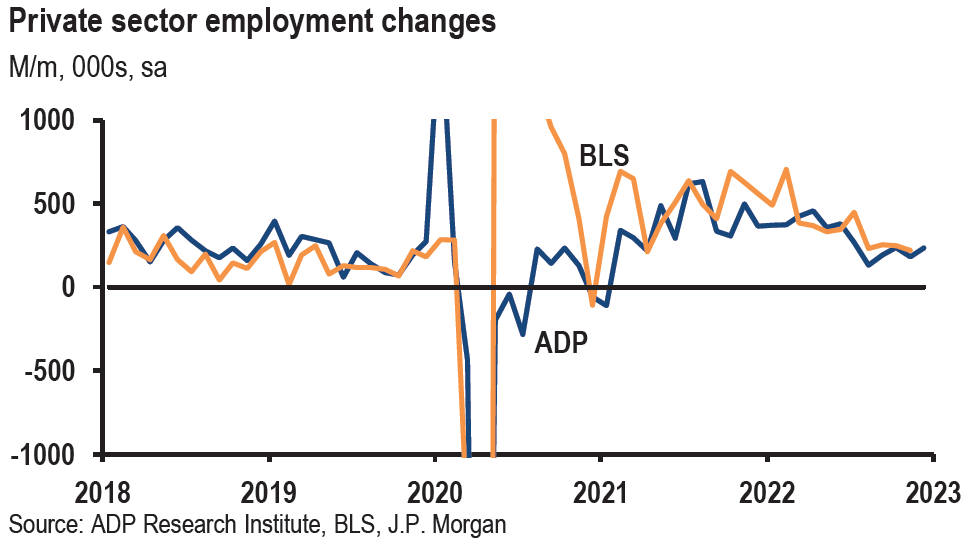
The December ADP report showed that the U.S. added 235,000 private-sector jobs versus an expected increase of 150,000, and November job growth was revised higher by 55,000 to 182,000. Service sector employment increased 213,000, including a 123,000 increase in the leisure and hospitality industry. Goods-producing jobs were 22,000 higher. All the job gains were in small-to-medium size companies, as companies with 500 or more employees shed 151,000 jobs. We speculate that since it was generally more difficult for smaller companies to find and retain a qualified workforce, they are perhaps more fearful of laying off people.
Initial claims for unemployment insurance dropped to 204,000 in the week that ended December 31 from the previous week’s revised 223,000 – revised lower by 2,000 versus expectations of 225,000. This was the lowest number since late September. Ona non-seasonally adjusted basis, initial claims rose 6,000 to 276,000. For the week that ended December 24, continuing claims fell 24,000 to a lower-than-expected 1.694 million. The median forecast for continuing claims was 1.728 million versus the prior revised figure of 1.718 million.
U.S. ISM PMIs for December
The U.S. ISM manufacturing Purchasing Managers Index (PMI) for December was 48.4 – down from 49.0 in November – and just under the expected level of 48.5. The employment component increased 3.0 points to 51.4, production fell 3.0 points to 48.5 and new orders dropped 2.0 points to 45.2. The not seasonally adjusted prices paid measure fell 3.6 points to 39.4 – the lowest level since April 2020.
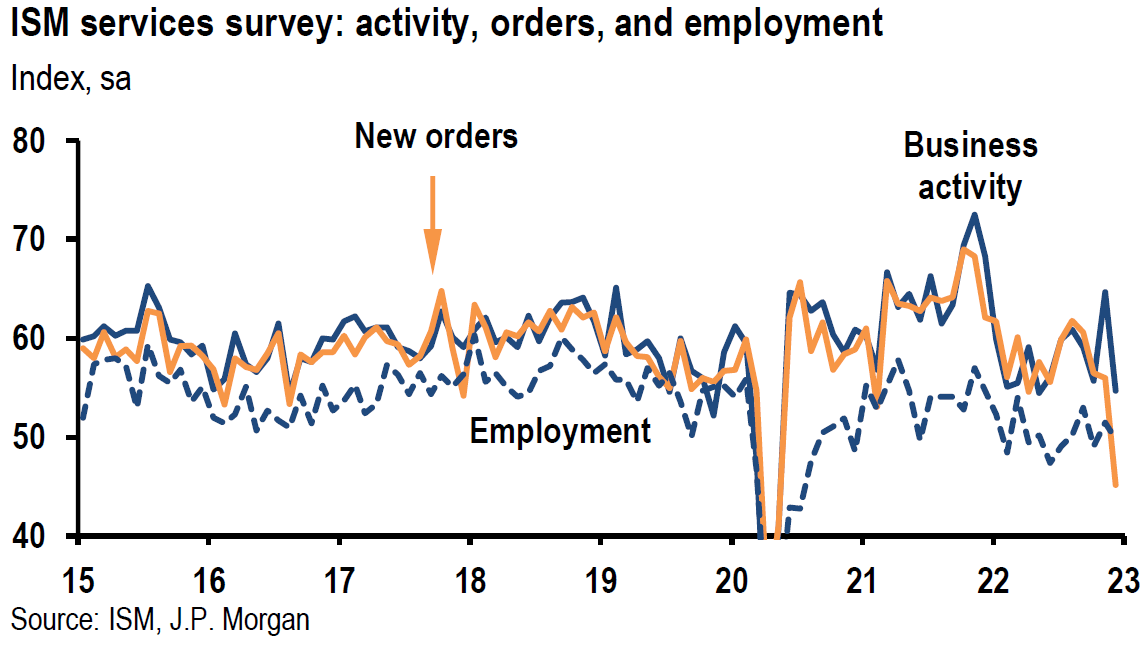
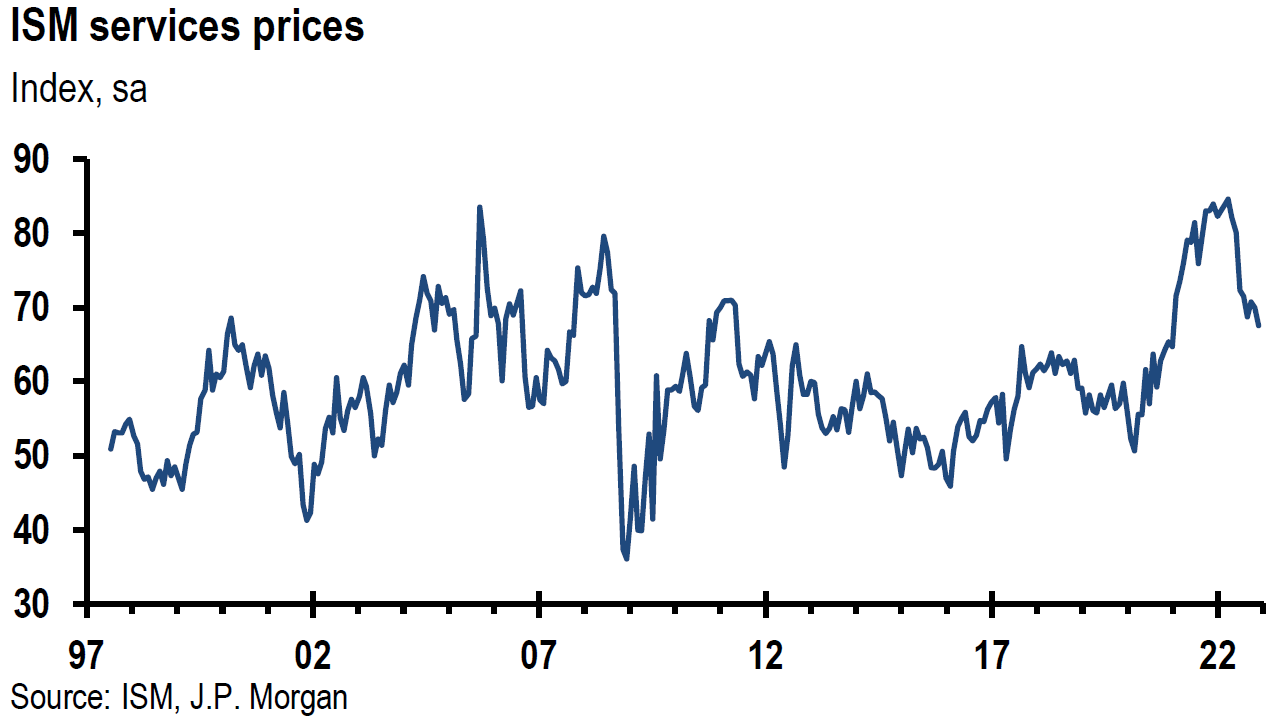
The much lower than expected ISM Services PMI was announced on Friday subsequent to the U.S. nonfarm payroll data and had a more dramatic effect on financial markets as interest rates fell, equity prices increased generally and USD traded lower. ISM services PMI fell to 49.6 in December from 56.5% in November and versus consensus estimates of 55. This was the first contraction in this series since May of 2020 and was finally more in line with the services PMI of S&P Global. We have previously characterized recent ISM services readings as outliers. It appears that is no longer the case. New orders contracted sharply to 45.2 from 56 in November and employment declined to 49.8 from 51.5. The business activity index fell to 54.7% from 64.7% in November. The prices index was 2.4% lower to 67.6%. The chair of the ISM Services Business Survey Committee commented that “employment contracted due to a combination of decreased hiring due to economic uncertainty and an inability to backfill open positions.” We have been highlighting the rapidity of change since the pandemic began. This is another example of how quickly and unexpectedly economic trends can change.
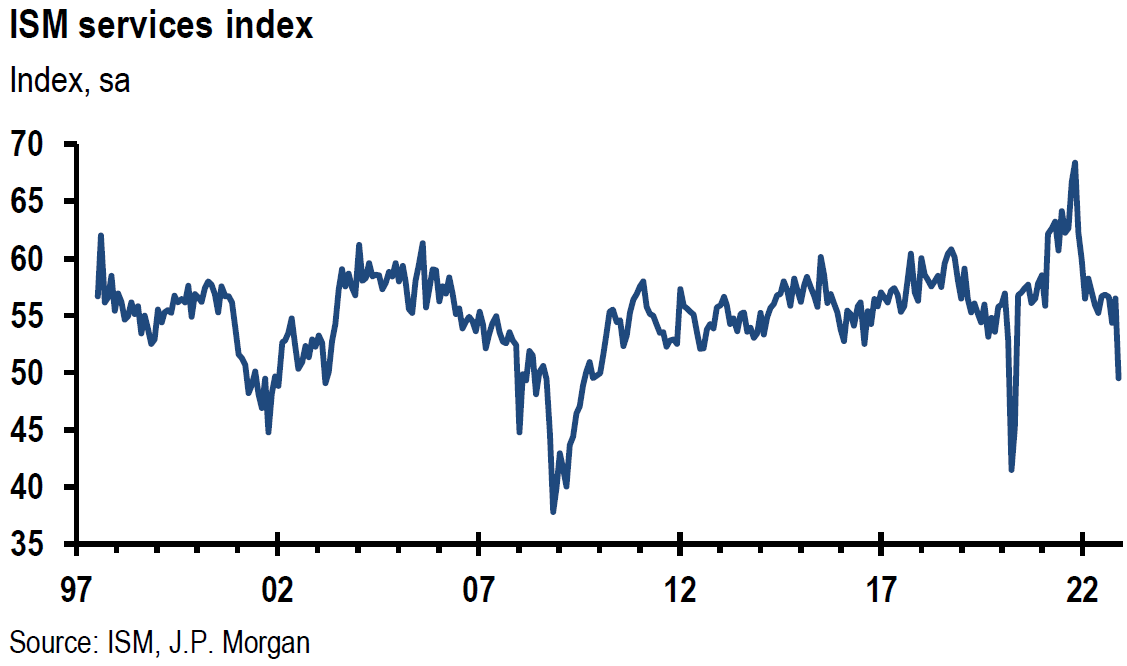
Source: JP Morgan, US: Services ISM falls sharply in December (1-6-2023)
Source: JP Morgan, US: ISM manufacturing survey keeps trending down (1-4-2023)
S&P Global US PMIs for December
The seasonally adjusted manufacturing PMI was 46.2 versus 47.7 in November, matching the earlier “flash” estimate. “The latest data signaled the fastest decline in operating conditions since May 2020 and was among the sharpest since 2009.” Lower prices for some inputs such as metals and fuel resulted in input costs rising at the slowest pace since July 2020. Softer input prices allowed firms to hike their selling prices at the slowest rate in just over two years. Output fell at the quickest pace in slightly more than two-and-half years reflecting weaker client demand and new orders. The decrease in new orders was among the fastest on record – since May 2007. Concerns over future demand led to only modest increases in hiring, which were concentrated mostly on skilled workers. Backlogs of work contracted at a “steep pace,” reflecting lower new orders.
The seasonally adjusted final services PMI was 44.7, higher than the “flash” estimate of 44.4 but lower than November’s 46.2 reading. “The rate of decline in output accelerated for the third month running and was the second fastest since May 2020.” The senior economist at S&P Global Market intelligence observed that a “notable development through the month was a stark easing in inflationary pressures across the private sector.” Input costs rose at the slowest pace in over two years. Hiring increased at a slower pace as well, but wages continued to rise “sharply.” Job creation was the second slowest since September 2021. Backlogs of work declined for the third consecutive month, reflecting lower new orders.
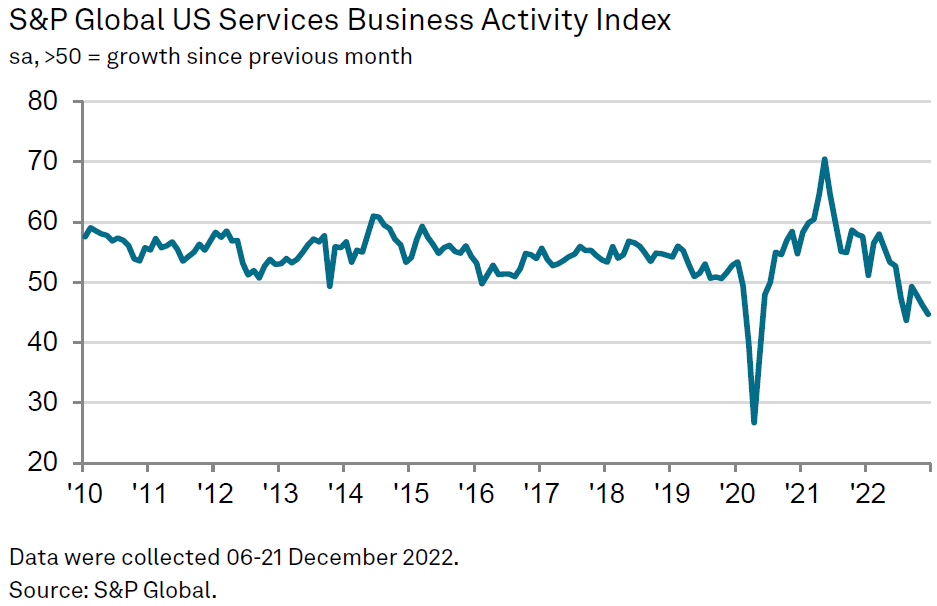
Source: S&P Global, S&P Global US Services PMI (1-5-2023)
BLS U.S. Nonfarm Payrolls for December
The Bureau of Labor Statistics (BLS) nonfarm payroll rose 223,000 versus an expected increase of 200,000. The December payroll increase was the least since December 2020. The average monthly employment gain was 375,000 in 2022 versus 562,000 in 2021 and 168,000 in the pre-pandemic year of 2019 The payroll data for November and October were revised lower by a total of 32,000. The unemployment rate was 3.5% compared to 3.7% for November. But that rate was revised down to 3.6%. The labor force participation rate edged higher to 62.3% from 62.2% in November. The average hourly earnings increased 0.3% m/m and 4.6% y/y. The 4.6% y/y increase was the slowest since August of 2021. Comparable November numbers originally reported were 0.6% and 5.1%. November’s m/m average hourly earnings number was revised down to 0.4% m/m and October was revised lower by 0.2% to 0.3%. The three-month annualized rate was 0.6% lower to 4.1%. The household survey showed an increase of 717,000 jobs, reversing some of the previous underperformance relative to the BLS payroll data. Financial markets were especially encouraged by the slowing of wage growth since this is a principal focus of the Fed.
Source: JP Morgan, US: Labor market reports beat expectations (1-5-2023)
China “Reopening” – Quicker than Many Anticipated after Abrupt Zero-COVID-19 Exit in December
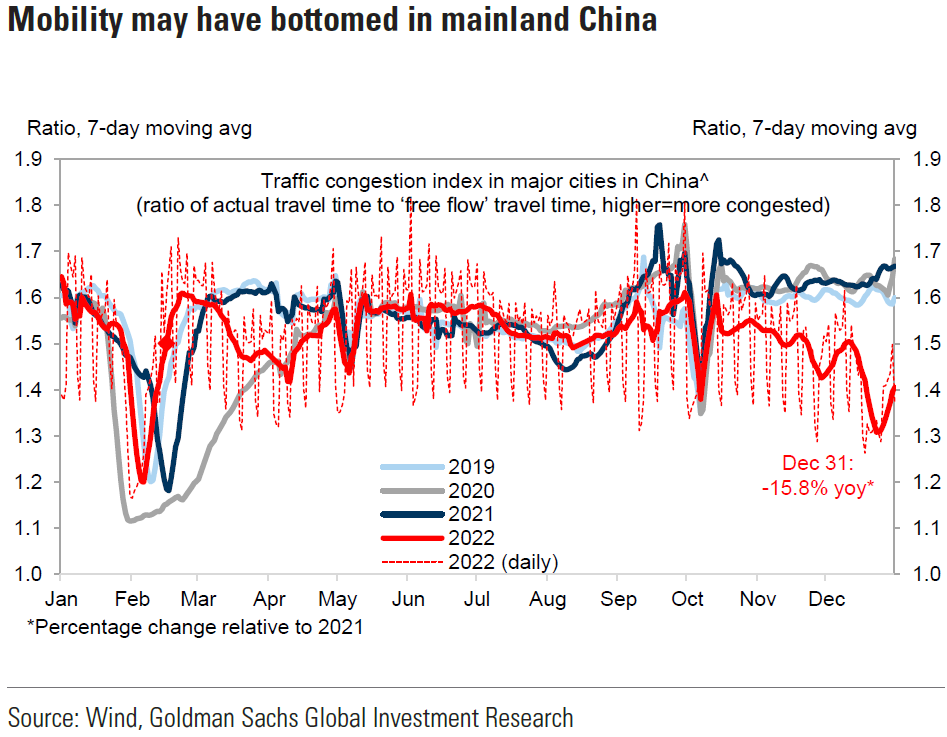
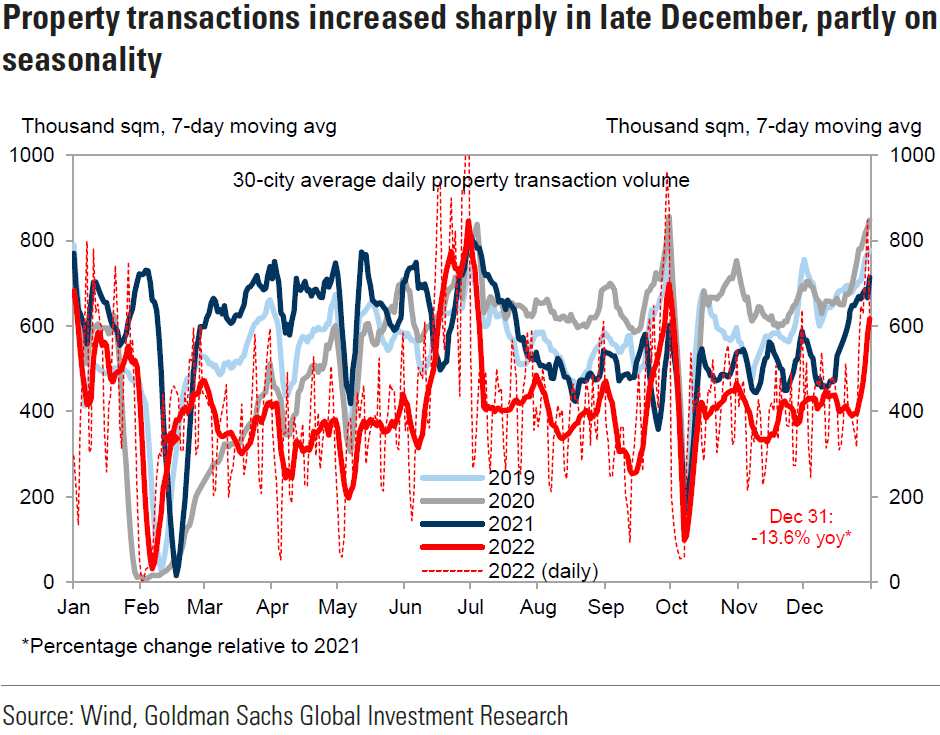
According to CNN on January 3, a recent study published in the Frontiers of Medicine journal, published on December 29, projected major cities in China would be past peak waves of COVID infections by the end of 2022 and that infections in more rural areas would see peak infection rates in mid to late January. These projections were based on mathematical modeling. On January 5, Goldman Sachs agreed that daily new cases of coronavirus infections “may have peaked and mobility may have bottomed out following the rapid spread of Covid in December.” We expect a strong recovery of China’s economy after a rather dismal month of Chinese economic data in December. According to the South China Morning Post on January 4, China’s finance minister Liu Kun pledged a fiscal spending boost for China’s hard-hit by COVID-19 economy. It was now expected that Chinese policymakers will lend further financial support to “systemically important” developers in an effort to bolster China’s property sector. Liu Kun indicated that authorities would use local government special bonds to fund investments while preventing systemic risks. Goldman Sachs also pointed out that regulatory guidance has become more encouraging in China, that could help China achieve a 2023 GDP growth rate of 5.2%. An encouraging sign in this respect, was the recent regulatory approval of a $1.5 billion capital raise by the consumer lending unit of Ant, which is 33% owned by Alibaba. This approval boosted optimism that China’s regulatory clampdown on the internet sector was finally easing. According to Bloomberg News on January 4, Chinese officials were now placing economic growth as their top priority. We agree with this assessment and anticipate a strong economic rebound in China this year. To the extent that China’s increased rate of economic growth spills over to other economies and increases global economic growth relative to that of the U.S., we postulate that this could lead to further U.S. dollar (USD) weakness at some point.
Source: Goldman Sachs, China: Three things in China (1-3-2023)
Bottom Line
For the time being, we are maintaining our basic investment approach as expressed in last week’s commentary. We continue to prefer high quality big cap stocks that offer good balance sheets, as well as relatively stable cash flows and profit margins. We prefer a very diversified global portfolio. We continue to expect more volatility in the two-to-10-year Treasury yield curve than in the 10-year Treasury yield.
We anticipate a robust China reopening in the relatively near future. We believe that a strong Chinese economy could enhance global growth relative to U.S. economic growth. This could lead to further USD weakening at some point.
Definitions
ISM Services PMI – The Institute of Supply Management (ISM) services PMI (formerly known as Non-Manufacturing Index) is an economic index based on surveys of more than 400 non-manufacturing (or services) firms’ purchasing and supply executives.
ISM Manufacturing PMI – The ISM manufacturing index, also known as the purchasing managers’ index (PMI), is a monthly indicator of U.S. economic activity based on a survey of purchasing managers at more than 300 manufacturing firms. It is considered to be a key indicator of the state of the U.S. economy.
S&P Global Services PMI – The S&P Global US Services PMI is compiled by S&P Global from responses to questionnaires sent to a panel of around 400 service sector companies.
S&P Global Manufacturing PMI – The S&P Global US Manufacturing PMI is compiled by S&P Global from responses to questionnaires sent to purchasing managers in a panel of around 800 manufacturers.
S&P Global Composite PMI – The S&P Global Composite PMNI is the weighted average of manufacturing and service sector PMIs for a given geography or economy.
Federal Open Market Committee (FOMC) – The Federal Open Market Committee (FOMC) is the branch of the Federal Reserve System that determines the direction of monetary policy specifically by directing open market operations. The committee is made up of 12 members: the seven members of the Board of Governors; the president of the Federal Reserve Bank of New York; and four of the remaining 11 Reserve Bank presidents on a rotating basis.
Inverted Yield Curve – An inverted yield curve describes the unusual drop of yields on longer-term debt below yields on short-term debt of the same credit quality. Sometimes referred to as a negative yield curve, the inverted curve has proven in the past to be a relatively reliable lead indicator of a recession.
Financial Conditions – Financial conditions can be defined as the current state of financial variables that influence economic behavior and (thereby) the future state of the economy. In theory, such financial variables may include anything that characterizes the supply or demand of financial instruments relevant for economic activity.
Mastercard Spending Pulse (MSP) – Mastercard Spending Pulse is a macro-economic indicator that reports on national, and in some cases regional, retail sales and is based on aggregate sales activity in the Mastercard payments network, coupled with estimates for all other payment forms, including all other forms of credit plus cash and check, along with certain other data obtained via public or other non-Mastercard sources.
Trade Deficit – A trade deficit occurs when a country’s imports exceed its exports during a given time period.
Job Openings – JOLTS defines Job Openings as all positions that are open (not filled) on the last business day of the month.
ADP National Employment Report – The ADP National Employment Report is a monthly report of economic data that tracks the level of nonfarm private employment in the U.S. It is published by Automatic Data Processing, a company that handles payroll for about a fifth of all privately-employed individuals in the U.S. The ADP National Employment Report is also known as the ADP Jobs Report or the ADP Employment Report.
Nonfarm Payrolls – Nonfarm payrolls is the measure of the number of workers in the U.S. excluding farm workers and workers in a handful of other job classifications. The nonfarm payrolls classification excludes farm workers as well as some government workers, private households, proprietors, and non-profit employees.
Household Employment Survey – The household survey (CPS) is designed to measure the labor force status of the civilian noninstitutional population with demographic detail. The national unemployment rate is the best-known statistic produced from the household survey.
Initial Unemployment Insurance Claims – Initial claims are new jobless claims filed by U.S. workers seeking unemployment compensation, included in the unemployment insurance weekly claims report.
Continuing Claims – Continuing claims track the number of U.S. residents filing for ongoing unemployment benefits in a given week. Continuing claims measure ongoing unemployment benefits, which is in contrast to initial claims, which track new filings for benefits.
China Reopening – A “reopening” in China means an easing of their zero-covid policy which includes a relaxation of travel rules and domestic travel.
IMPORTANT DISCLOSURES
The views and opinions included in these materials belong to their author and do not necessarily reflect the views and opinions of NewEdge Capital Group, LLC.
This information is general in nature and has been prepared solely for informational and educational purposes and does not constitute an offer or a recommendation to buy or sell any particular security or to adopt any specific investment strategy.
NewEdge and its affiliates do not render advice on legal, tax and/or tax accounting matters. You should consult your personal tax and/or legal advisor to learn about any potential tax or other implications that may result from acting on a particular recommendation.
The trademarks and service marks contained herein are the property of their respective owners. Unless otherwise specifically indicated, all information with respect to any third party not affiliated with NewEdge has been provided by, and is the sole responsibility of, such third party and has not been independently verified by NewEdge, its affiliates or any other independent third party. No representation is given with respect to its accuracy or completeness, and such information and opinions may change without notice.
Investing involves risk, including possible loss of principal. Past performance is no guarantee of future results.
Any forward-looking statements or forecasts are based on assumptions and actual results are expected to vary from any such statements or forecasts. No assurance can be given that investment objectives or target returns will be achieved. Future returns may be higher or lower than the estimates presented herein.
An investment cannot be made directly in an index. Indices are unmanaged and have no fees or expenses. You can obtain information about many indices online at a variety of sources including: https://www.sec.gov/fast-answers/answersindiceshtm.html or http://www.nasdaq.com/reference/index-descriptions.aspx.
All data is subject to change without notice.
© 2024 NewEdge Capital Group, LLC


