

Weekly Summary: September 26 – September 30, 2022
Key Observations:
- This week’s inflation data and labor market data are consistent with the Federal Reserve’s (Fed) aggressive monetary tightening policies.
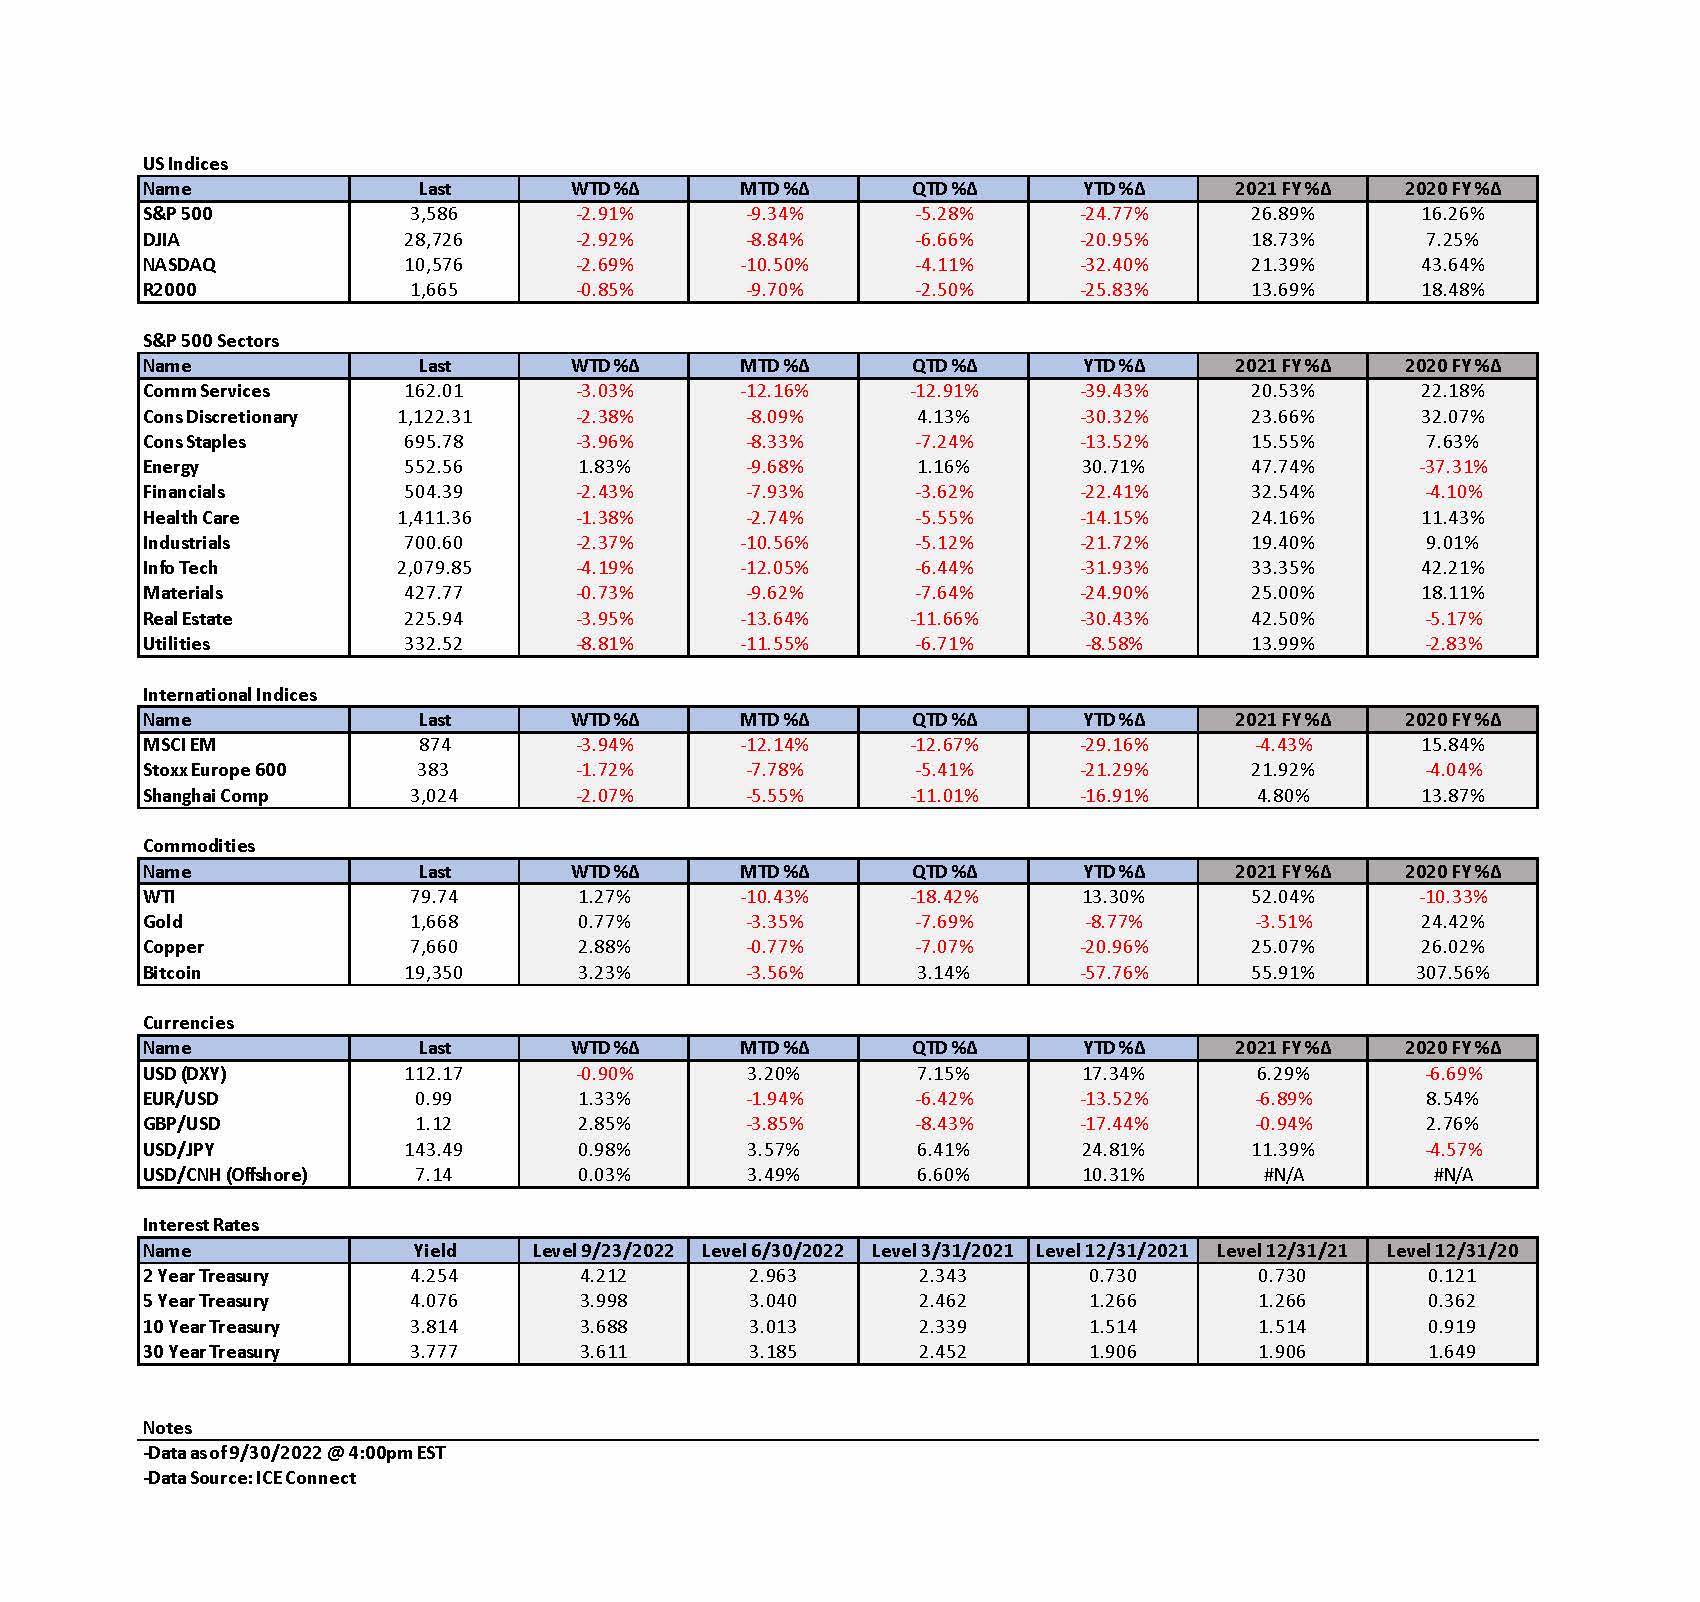
- Interest rates appear to have been the main driver of equity markets as well as other financial markets for quite some time. In our opinion, the 2-year Treasury yield and the 10-year Treasury yield have shown signs, at least in the short term, of topping at just over 4.3% and 4.0%, respectively. We surmise that the 10-year Treasury security with a yield close to 4% could be an effective hedge in a diversified portfolio in the event of a U.S. slowdown in economic growth and/or recession.
- We have become increasingly concerned with the relative illiquidity of many financial markets that has tended to exacerbate volatility. This could lead to a “loop” of lower liquidity leading to more volatility, leading to more illiquidity. The Fed’s planned increased shrinking of its balance sheet – quantitative tightening (QT) should drain even more liquidity out of the financial system. The tightening monetary policies of many central banks (CBs) should decrease liquidity as well. To quote from last week’s commentary: “The extreme moves in currency, fixed income and commodity markets that have become even more evident this week have raised our concern of a potential market ‘dislocation’ of some kind at some point.” We are focused in particular on the continued strength of the U.S. dollar (USD).
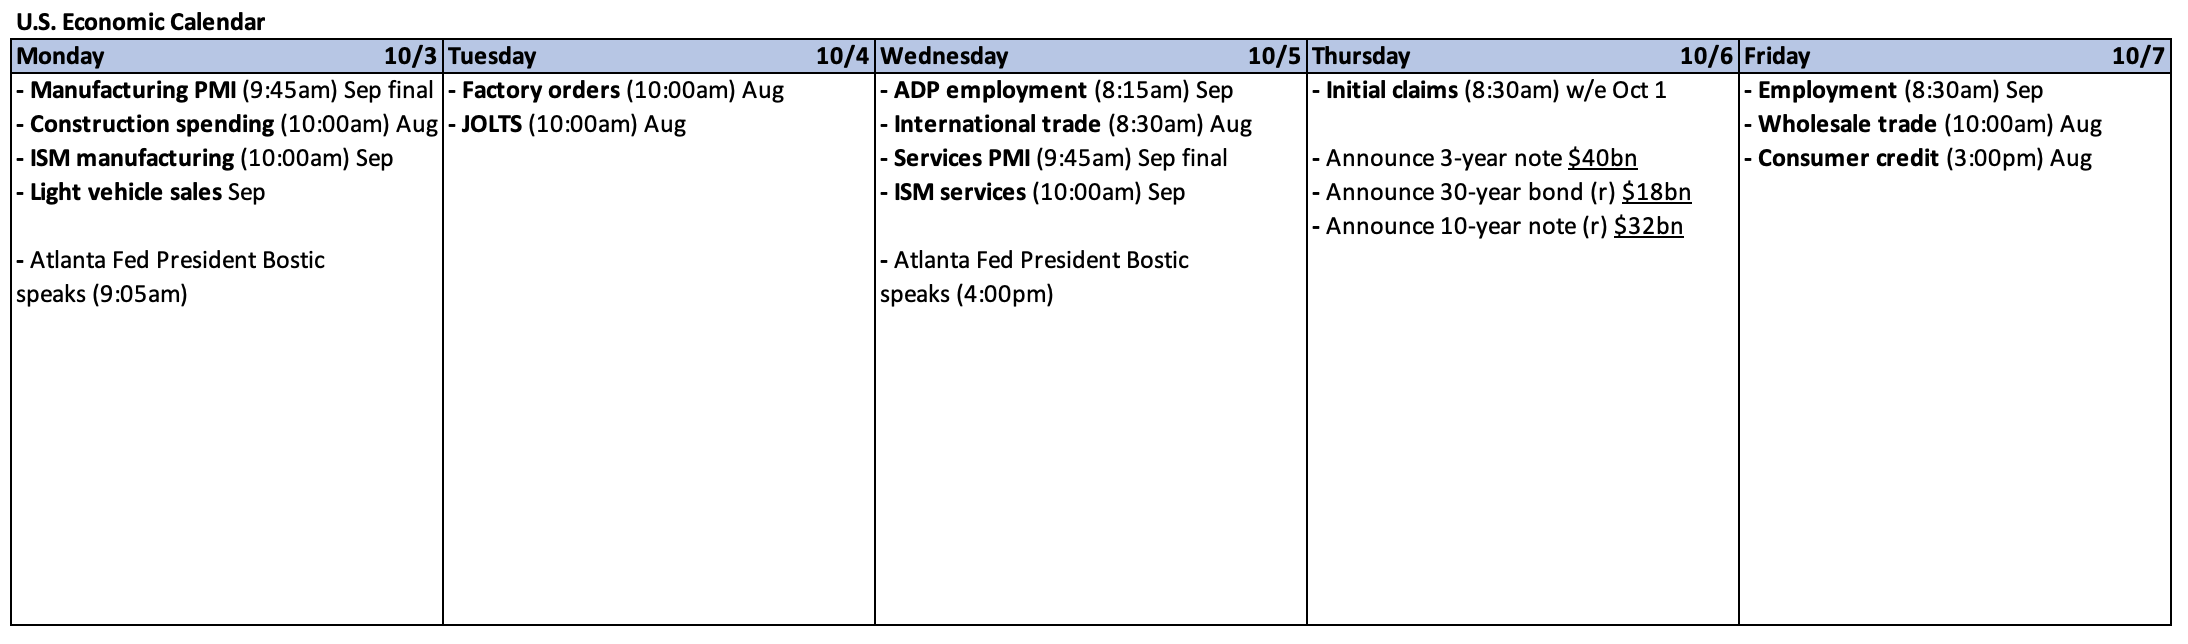
- We anticipate continued volatility during Q3 “earnings season” that begins in mid-October. We foresee more downward revisions of earnings, revenues and profit margins. The seasonal patterns of U.S. equity markets outlined in our September 9 weekly should also play a role. Although September has been the worst month for U.S. equities on average this century, October has been the most volatile. In contrast, mid-term elections and Q4s have typically been more “friendly” to stock returns.
The Upshot: Our general investment approach remains the same as depicted in last week’s commentary. We maintain our preference for big cap high quality stocks with good balance sheets, relatively stable cash flows and stable margins. Volatility across sectors continues to be supportive of a well-diversified portfolio for long term investors. On a selective basis, we remain favorably disposed towards energy, health care, financials and growth stocks – including selected high quality tech stocks. For those so inclined, the 10-year Treasury bond could be an attractive hedge for the possibility of a U.S. recession. We assume continued volatility across virtually all financial markets. We understand that the Fed’s latest planned trajectory of hikes in the federal funds rate has increased the probability of a U.S. recession by sometime next year. It has also lowered the risk/reward calculus for the purchase of equities. As we have advocated this entire year, we would only buy selected securities on market downturns. We maintain our belief that selective stock picking will continue to play a critical role in outperformance. Seasonal factors could also affect financial markets’ behaviors. The volatility of the past few weeks seems to be following the seasonal script.
“Hot N Cold” – Fed and Financial Markets
We have been struck for quite some time with the poor economic forecasts of the Fed and many other major CBs. When we combine that view with the extreme volatility of many financial markets recently, we have been drawn to Katy Perry’s song “Hot N Cold.” We find the following lyrics especially apropos: “Cause you’re hot then you’re cold; You’re yes then you’re no; You’re in then you’re out; You’re up then you’re down; you’re wrong when it’s right; It’s black and it’s white.” When inflation was “hot” the Fed was “cold” – still easy monetary policy when it chose to characterize inflation as “transitory.” Now when some inflation rates are beginning to decline, or “cool,” the Fed is “hot” – tight monetary policy. When the Fed thought inflation was “transitory,” they admitted they were not “data dependent”, and they were looking past the current economic data to a time when inflation would be rising at a slower rate. The Fed appeared convinced that was the appropriate strategy. We believe the Fed to be now somewhat disingenuous when it claims to be data dependent while espousing a projected rate of very aggressive hikes in the federal funds rate. Many financial markets fluctuate between hot and cold almost on a daily basis and the lyrics of “Hot N Cold” seem to fit as well.
Interest Rates Have Been Main Driver of Equities and Other Financial Markets
We surmise that the main driving force of financial market volatility for quite some time has seemed to originate from fixed income markets – U.S. interest rates higher, equities lower, the USD higher, commodities lower. These have been general correlations with exceptions along the way. Many other factors have been influencing markets as well. Commodity markets, and especially energy markets, have been impacted greatly by the Russia-Ukraine war, China lockdowns, recession fears, supply chain constraints and sanctions against Russia. Treasury yields have appeared to hit at least a short-term peak – the two-year-Treasury yield at slightly higher than 4.3% and the 10-year yield at roughly 4%. The two-to-10-year Treasury inversion spread and the 10-to-30-year inversions have been fluctuating recently as well. Our focus, however, remains on the two-to-10-year inversion. As recession fears increase, we expect the two-to-10-year spread to invert further. In this context, we believe that in a well-diversified portfolio, the 10-year Treasury could act as a hedge against the increasing likelihood of a recession.
USD Strength
If our assessment of U.S. interest rates is correct, perhaps the USD will reach a peak soon as well. We chose to focus on the U.S. Dollar Index (DXY) as a measure of USD strength. DXY represents a basket of six currencies of some of America’s most significant trading partners. Some foreign governments have become concerned recently of their currency’s weakness relative to the U.S. dollar. Japan’s finance ministry has recently intervened in an attempt to stabilize the yen. The Bank of England (BOE) announced this week a program to buy long-dated Gilts – UK government bonds – in an effort to stabilize its financial markets. At least in the short term, the BOE brought down the 10-year yield on Gilts as it stabilized its government bond markets that in turn stabilized the British pound as well. The pound lost over 3.5% against USD last Friday on the UK government’s surprise unfunded tax cuts. The pound has about a 12% weighting in DXY. The People’s Bank of China (PBOC) also expressed this week a desire to see a more stable yuan and warned against traders taking one-sided bets against China’s currency.
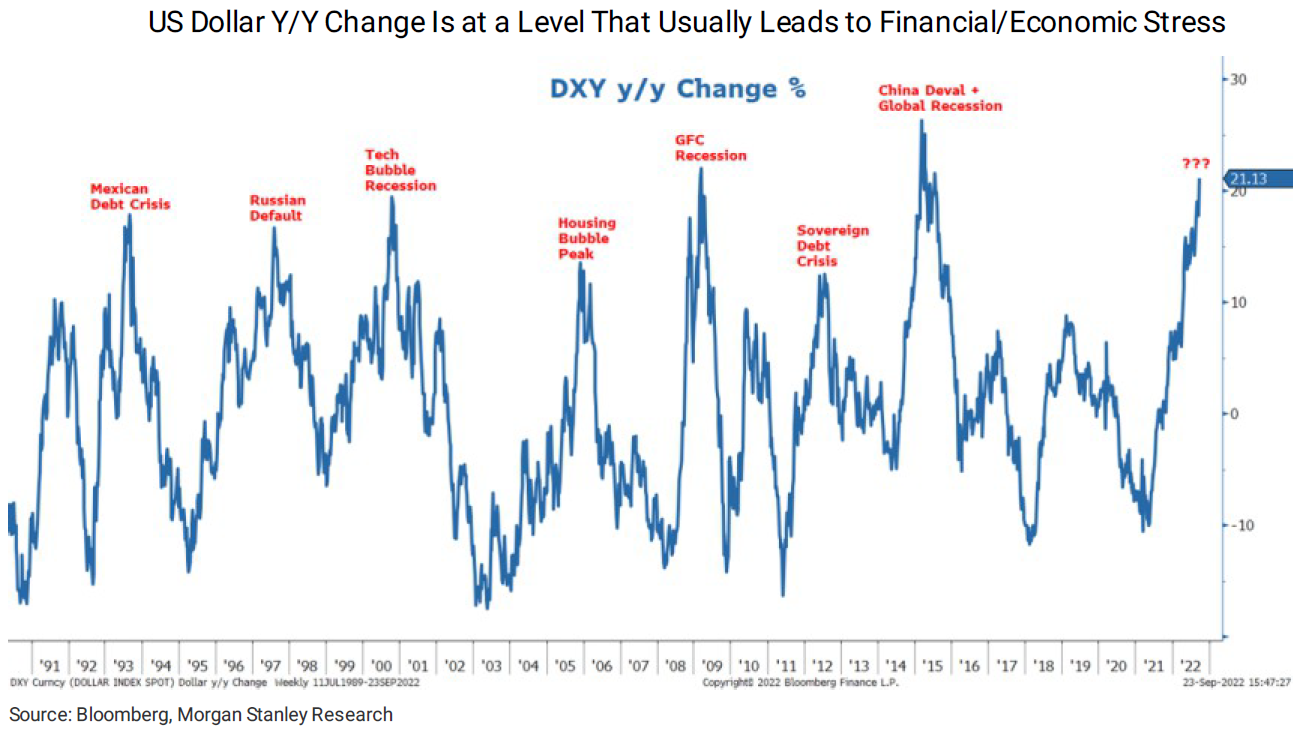
Source: Morgan Stanley, Weekly Warm-up: Can You Hear Me Now? The Fed Leaves No Doubt; Focus on Growth Now (9-26-2022)
Emerging Markets
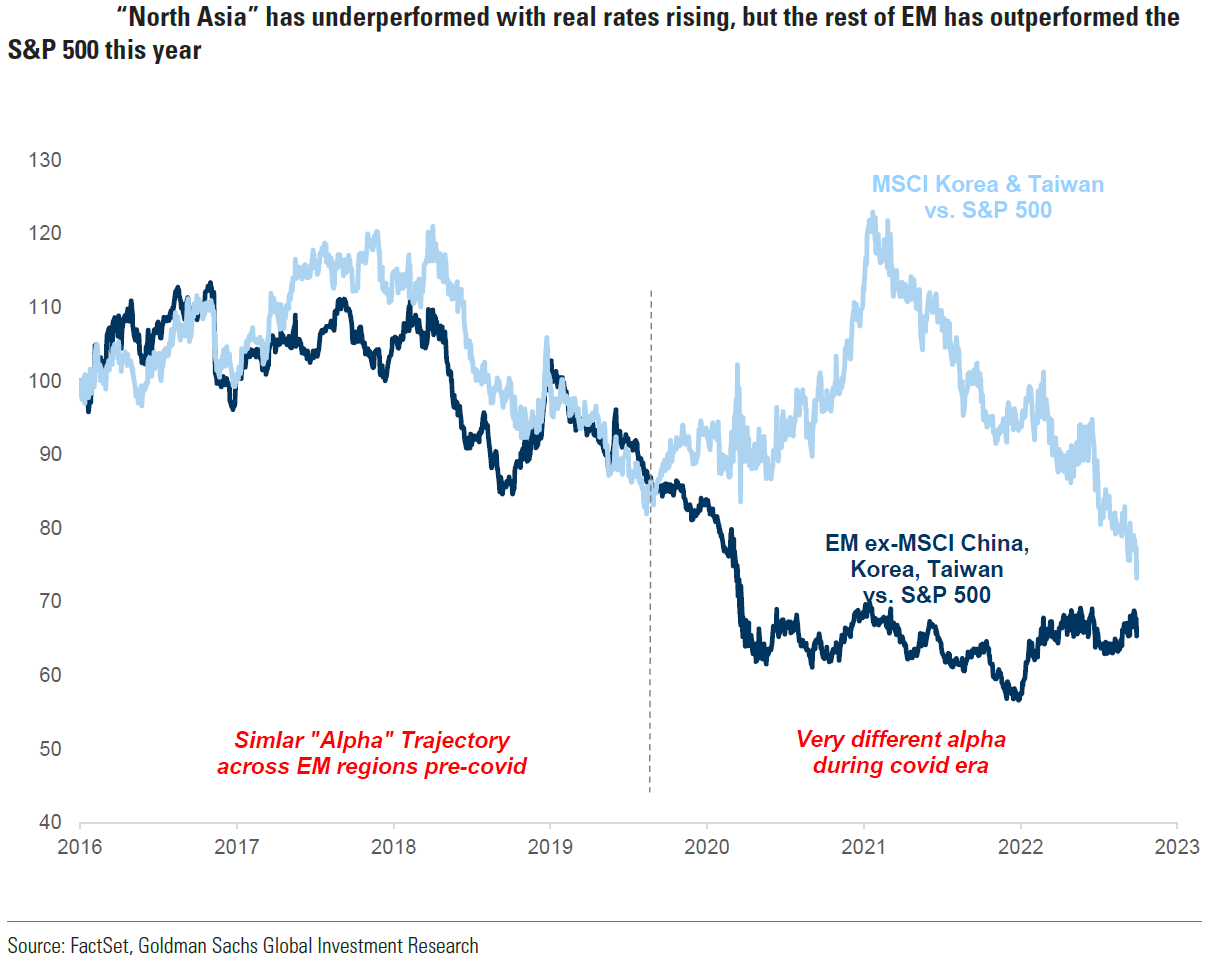
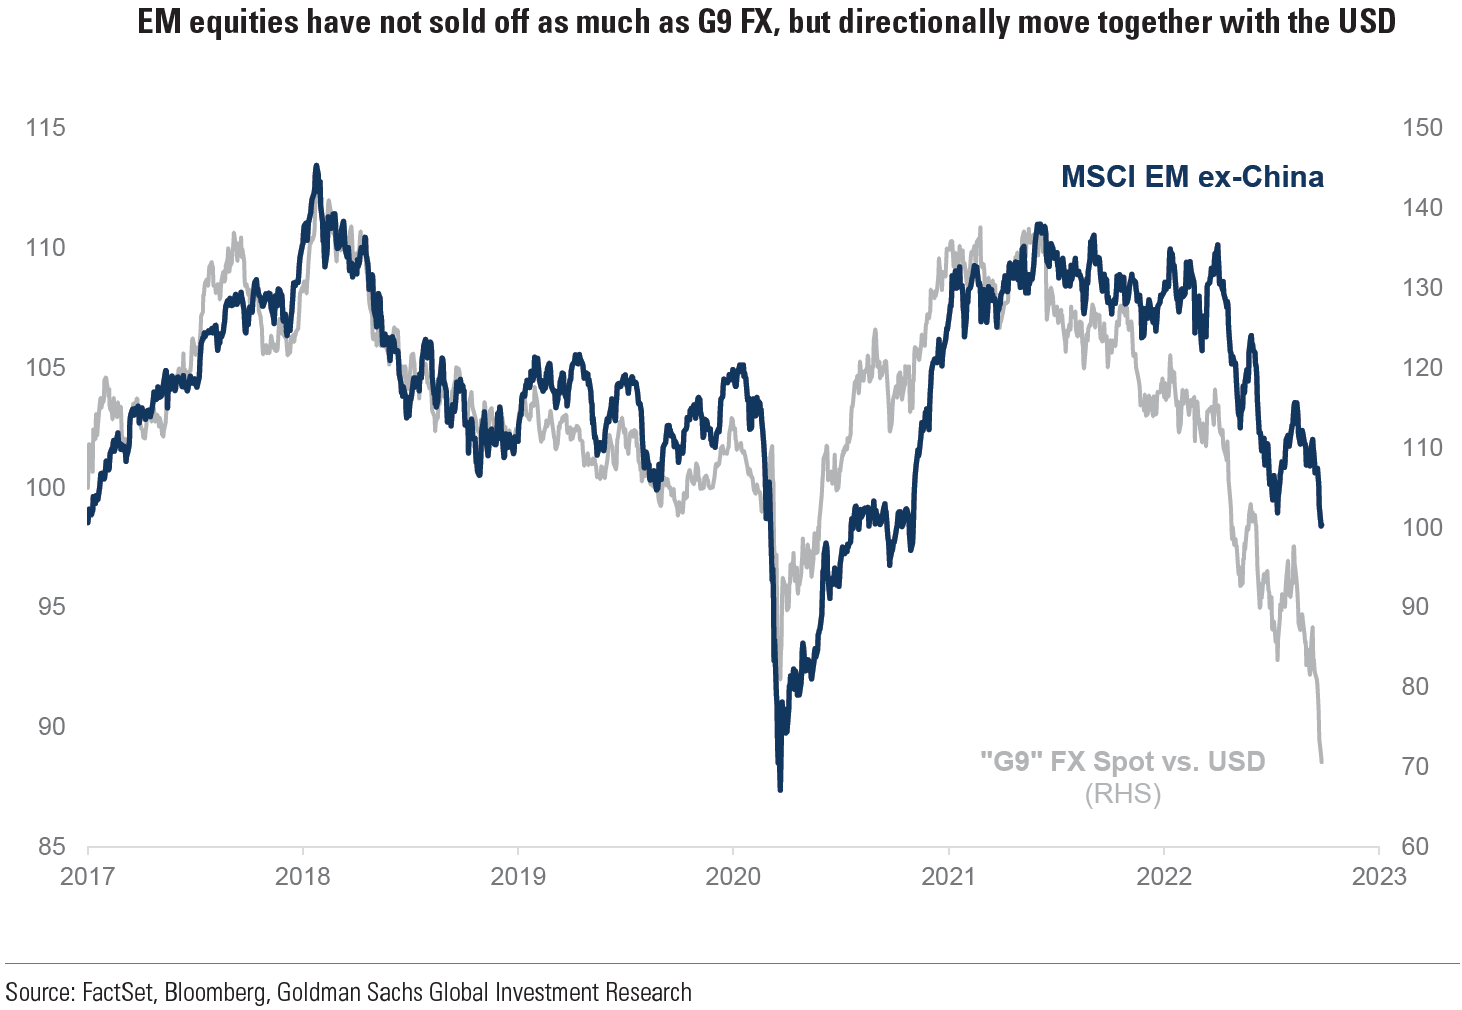
We believe that many emerging markets (EMs) will provide attractive rates of return for many years. USD strength has continued to hurt EM equity returns. A USD reversal could provide an attractive entry point into such markets. At that juncture, we believe that picking the appropriate EM market will be just as important as selective stock picking will continue to be in picking equities in developed markets (DM). Resource rich EMs with relatively low deficits and adequate currency reserves are among the many possible investment attributes that we suggest might be appropriate for future EM investments. Given China’s slowing population growth, we would try to identify those EMs where China might invest to find cheap labor costs. We also would search for those EMs that could benefit from a reacceleration of China’s economic growth. We don’t mean this to be an exhaustive list of what to look for in EM investing at the appropriate time. Our only point is that investors will need to be selective as to what to include in their well-diversified portfolios.
Source: Goldman Sachs, EM vs. DM – A Mixed Bag but More Downside (9-29-2022)
European Stocks with USD Exposure vs. U.S. Companies with Foreign Exposure
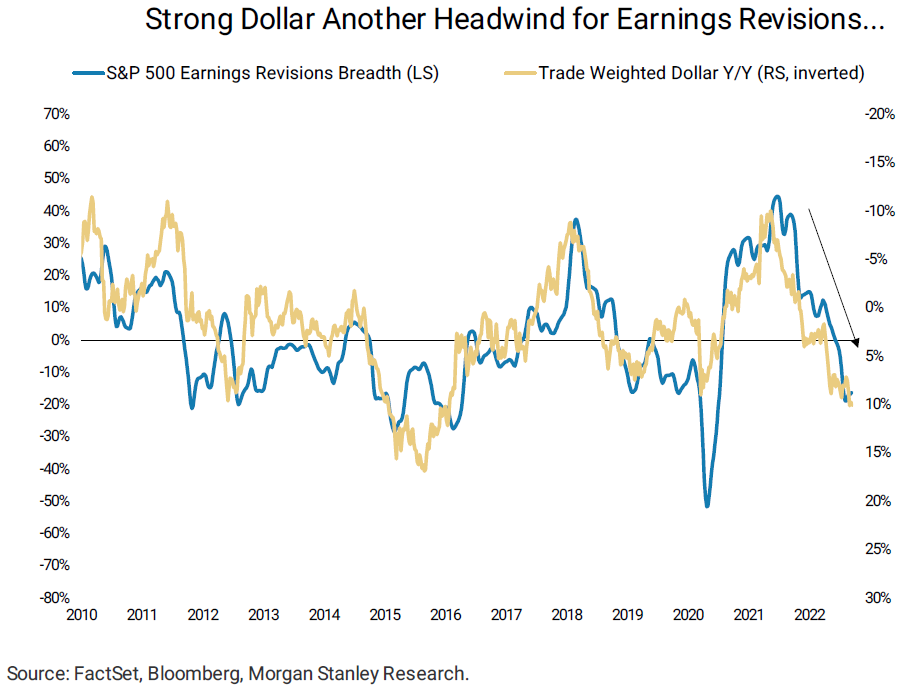
A very selective approach in European stocks also might be appropriate in a well-diversified portfolio. According to a September 26 Goldman Sachs publication, about 55% of the revenues in the STOXX Europe 600 index are derived from outside of Europe, with a substantial share of the foreign revenues denominated in USD. As long as USD remains strong, European companies with such exposure should benefit. Translating strong USD revenues back into weaker local currencies would increase earnings in local currency terms. We would focus on such companies as possible investments. In contrast, as we have highlighted previously, a strong USD depresses U.S. company revenues and earnings that have a strong international presence. On September 26, Morgan Stanley estimated that a 1% change in DXY has about a 0.5% impact on S&P 500 earnings. Third-quarter U.S. earnings reports will begin to be announced in mid-October. We anticipate that investors’ and analysts’ principal focus will be on currency impacts and stability of margins in the upcoming reports. One’s own forecasts of the USD future trajectory will be important in determining whether or not, and to what extent, to discount currency translation impacts.
Illiquid Financial Markets and Volatility
We have highlighted often in our previous commentaries that many financial markets are relatively illiquid this year when compared to prior years. We have noted the Fed’s concern over illiquidity in the Treasury markets, their concern about volatility in commodities’ markets and how such volatilities might have spillover effects to other financial markets. We add our concern over currency market volatility as well. After the pound’s rapid depreciation last Friday, we stated in last week’s commentary that the “extreme moves in currency, fixed income and commodity markets that have become even more evident this week have raised our concern of a potential market ‘dislocation’ of some kind at some point.” Extreme positioning in equity markets also might be a factor. But of all the financial markets’ extreme moves, the currency markets concern us the most. In particular, we believe that if the USD (DXY) continued to appreciate rapidly, financial markets would be most at risk from spillovers of such a move. During this month, the Fed has increased the reduction of its balance sheet – quantitative tightening (QT) – further draining liquidity from the financial system. Many other major CBs continued to tighten their monetary policies as well. We suppose that this coordinated global tightening will exacerbate liquidity issues that most likely will lead to more volatility. An unexpected rapid rise in USD due to a dislocation in currency markets could provide very attractive entry points to purchase foreign securities – including EM investments. We are not forecasting such an unexpected rapid appreciation, we just are open to such a possibility.
Q3 –Anticipated Downward Revisions
We continue to believe that interest rates will greatly determine the path of equities and other financial markets. But since U.S. interest rates might be in a “topping” process, we suspect that the upcoming third-quarter earnings season could be the catalyst for another round of volatility. Although many companies have already brought down their estimates of future revenues (top line), earnings (bottom line) and margin estimates, we continue to anticipate additional downward revisions that could pressure equity valuations further.
Bear Market Rallies
We thought that the elements of a short-term rally were in place before Wednesday’s steep gains in U.S. equity prices. Unfortunately, the Wednesday equity rally exhibited many characteristics of a classic bear-market rally. Some markets had the largest one-day gains in over a year, and the 10-year Treasury yield had its largest one-day drop since 2009. Bear market moves to the upside are often very steep short-term moves. The next day’s lower equity trajectory was exacerbated after the U.S. Labor Department’s announcement of lower-than-expected initial and continuing unemployment insurance claims. For the week ending September 24, initial claims dropped 16,000 to 193,000 compared to an expected level of 215,000. The prior week’s level was revised 4,000 lower. This was the lowest number of such claims since April of this year and was the first reading below 200,000 since early May. Continuing claims for the week ending September 17 were 29,000 lower from the prior week’s level, which was revised 3,000 lower to 1.347 million.
Tight Labor Markets and Wage Growth
In last week’s commentary, we highlighted the Fed’s focus on the need to see a softening of the “extremely tight” U.S. labor market. A “softening” of the labor market was one of the three key elements that Jay Powell noted the Fed had to see before it could pause its rate hikes. But unfortunately, the lower-than-expected unemployment claims were interpreted as further evidence of a still tight labor market. As long as the labor market remains tight, it will be difficult to lower wage growth rates from the current 5.5% rate of increases down to a level that would be more consistent with the Fed’s 2% inflation rate. On September 27, Goldman Sachs calculated that such a pace of wage growth would be required to be around a 3.5% rate.
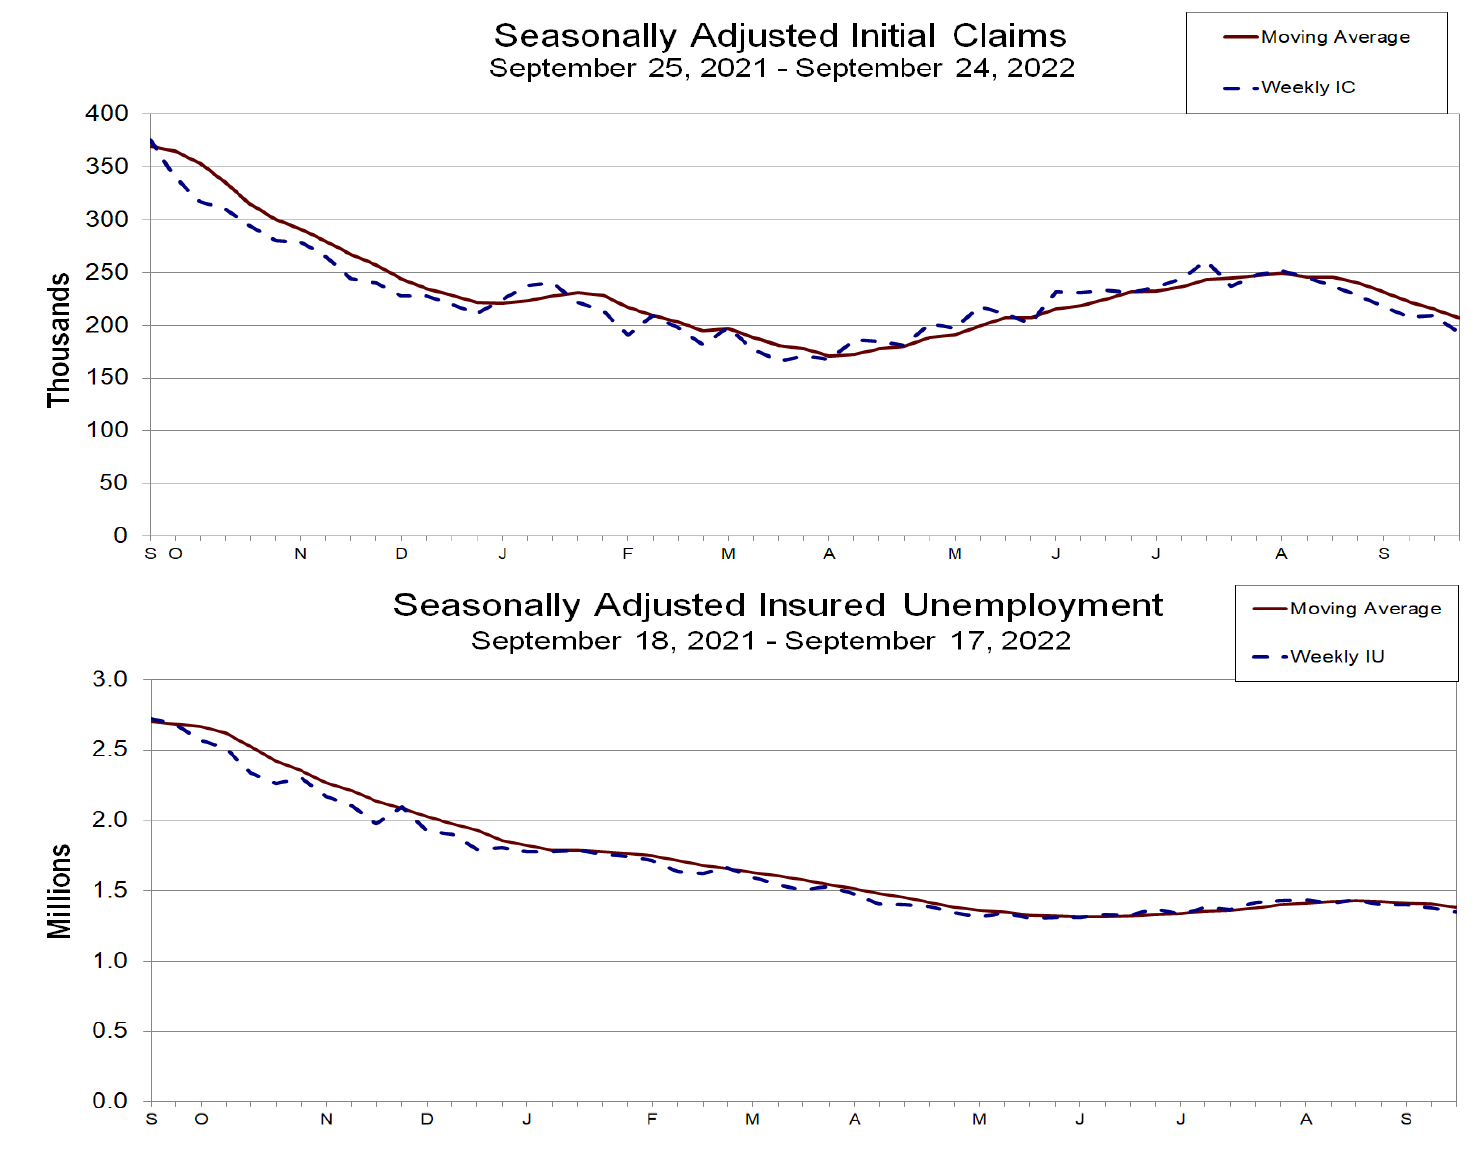
Source: US Department of Labor, Unemployment Insurance Claims (9-29-2022)
Economic “Good” News Might “Adversely” Affect Financial Markets
Even though the Fed remains on a pre-determined path to hike the federal funds rate to around 4.6% by sometime next year, U.S. equities seemed to react adversely to “good” economic news this week as interest rates rose on such news. The “good news is bad news” scenario was prominently on display on Tuesday as well. U.S. equities appeared to be heading higher and bond yields lower until some positive economic news was released that morning. It is our understanding that one such significant data release was the Conference Board’s Consumer Confidence Index for September, which increased for the second straight month as it exceeded expectations and was at its highest reading since January. Both the Present Situations Index and the Expectations Index recorded noteworthy gains. Concerns about inflation dissipated in September, along with lower gasoline prices. Purchase intentions for autos and “big-ticket” appliances increased while home purchase intentions declined.
The other very positive economic news released was the very large and unexpected increase in U.S. new home sales in August. New homes sales increased 28.8% month-over-month (m/m) and 0.1% below last year’s pace (y/y). This was the second largest monthly increase in new home sales on record after a sequential monthly decrease of 8.6% in July. We assume that the surge in August sales was due to a temporary decrease in mortgage rates during the time when home purchase contracts were signed. The 30-year fixed-rate mortgage hit a high of 7.08% this week, before a slight retreat. The median price for a new home dropped 6.3% m/m to $436,800 from a revised $466,300 in July. The average sales price also declined 6.3% to $521,800 from a revised price of $556,700 in July. We view the positive new home sales for August as an aberration to the weaker housing market data that we have been highlighting, as well as additional data analyzed this week.
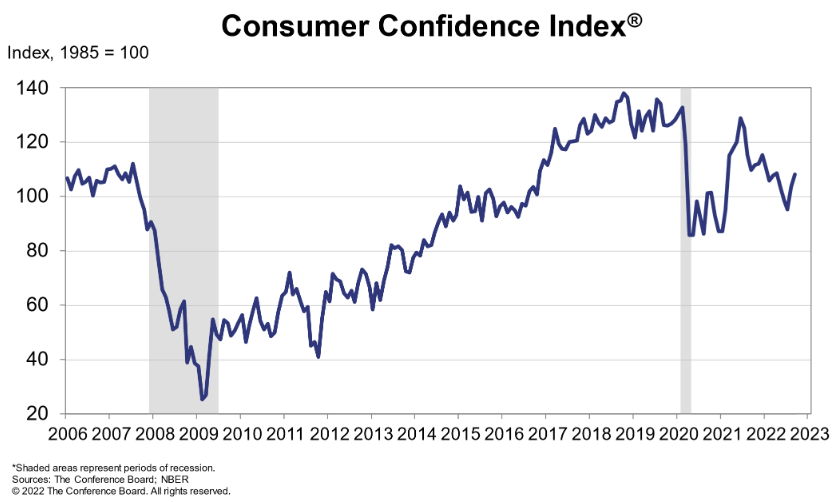
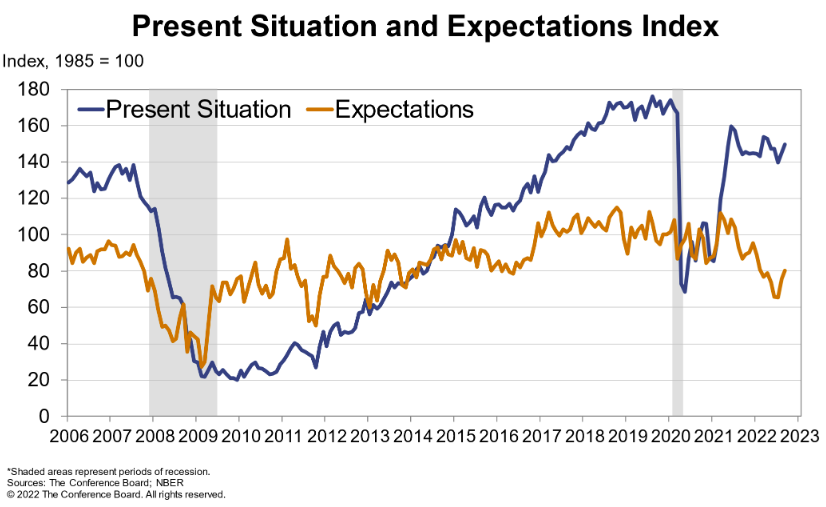
Source: Conference Board, US Consumer Confidence (9-27-2022)
Richmond Fed Manufacturing Survey
We do not think that the better-than-expected Richmond Fed manufacturing survey, which was announced at the same time as the above two more obviously positive economic data points, was very relevant for the markets’ Tuesday reversals. We viewed this report as “mixed.” Although the employment index fell from 11 to zero, the wage index increased “dramatically,” surpassing both July and August levels. The average growth rate of prices paid and received both decreased “markedly” in September. This data indicated a possible looming margin squeeze. Firms’ expectations of conditions over the next six months increased but remained negative.
Dallas Fed Surveys
The later announcement of the Dallas Fed’s services outlook survey for September weakened further, and seemed to have little impact on financial markets. Selling prices and wage pressures continued to moderate in September, while input price growth picked up slightly. Retail sales measures dropped further into negative territory as retailers’ inventories increased. The Dallas Fed’s manufacturing index disclosed the prior day, was rather lackluster as the general business activity measure for manufacturing fell further into negative territory. However, the production index rose more into positive territory, even as the new orders index ticked further down into negative territory and remained in the negative realm for the fourth straight month.
Durable Goods
Durable goods orders showed resiliency and fell by a less-than-expected 0.2% m/m in August. Core durable goods, nondefense durable goods excluding aircraft, were 1.3% higher m/m versus an expected 0.2% increase, and July was revised higher to 0.7% from an originally reported 0.3% increase.
Decreasing Home Prices
Both the Case-Shiller and Federal Housing Finance Agency (FHFA) house price indexes showed sequential monthly declines in July. The Case-Shiller national price index declined 0.24% m/m, which was the first monthly home price decrease since February 2012. The 2.3% decline in the annual rate of increase from 18.1% in June to the 15.8% y/y increase in July was the largest such decrease in the survey’s history. The FHFA house price index declined 0.6% m/m in July versus a 0.1% m/m increase in June. The July sequential decline was the first decline since May 2020. However, the FHFA house price index showed a gain of 13.9% y/y.
Pending Home Sales Decline
The National Association of realtors disclosed this week that pending home sales decreased for the third consecutive month in August. This is a measure of contract signings to purchase a pre-existing home. The pending home sales index dropped 2% to 88.4 in August. This was the lowest reading since April 2020. Pending home sales have decreased in nine out of the last 10 months and are 24.2% lower y/y. The 30-year fixed rate mortgage to purchase a home was 6.29% last week, which was the highest since October 2008. The rate was 6.02% the prior week and this week it was as high as 7.08% – the highest rate in just under twenty years. Mortgage applications to purchase a house dropped 0.4% last week from the prior week and were 29% lower than the same week one year ago. The points associated with such mortgage applications increased from 0.71% to 1.15%, assuming a 20% down payment, and were the highest points since mid-2008.
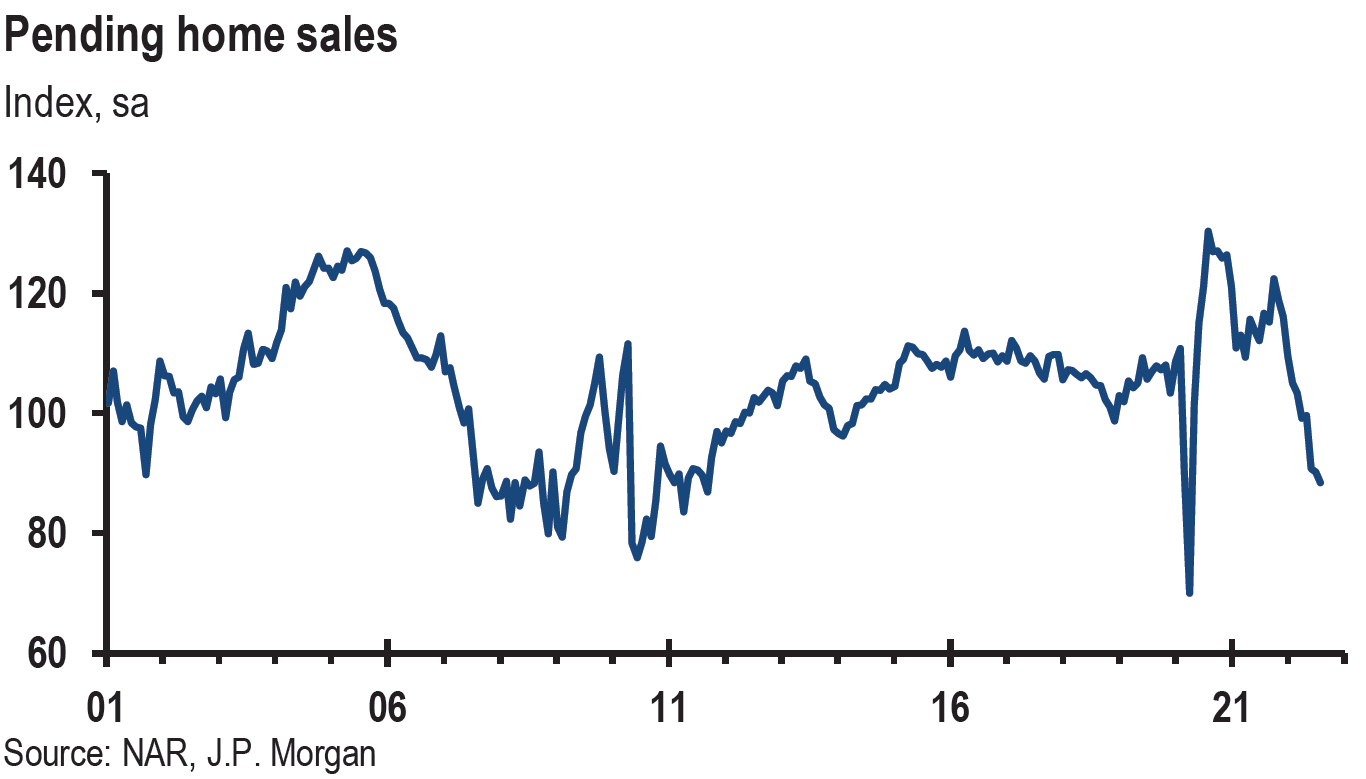
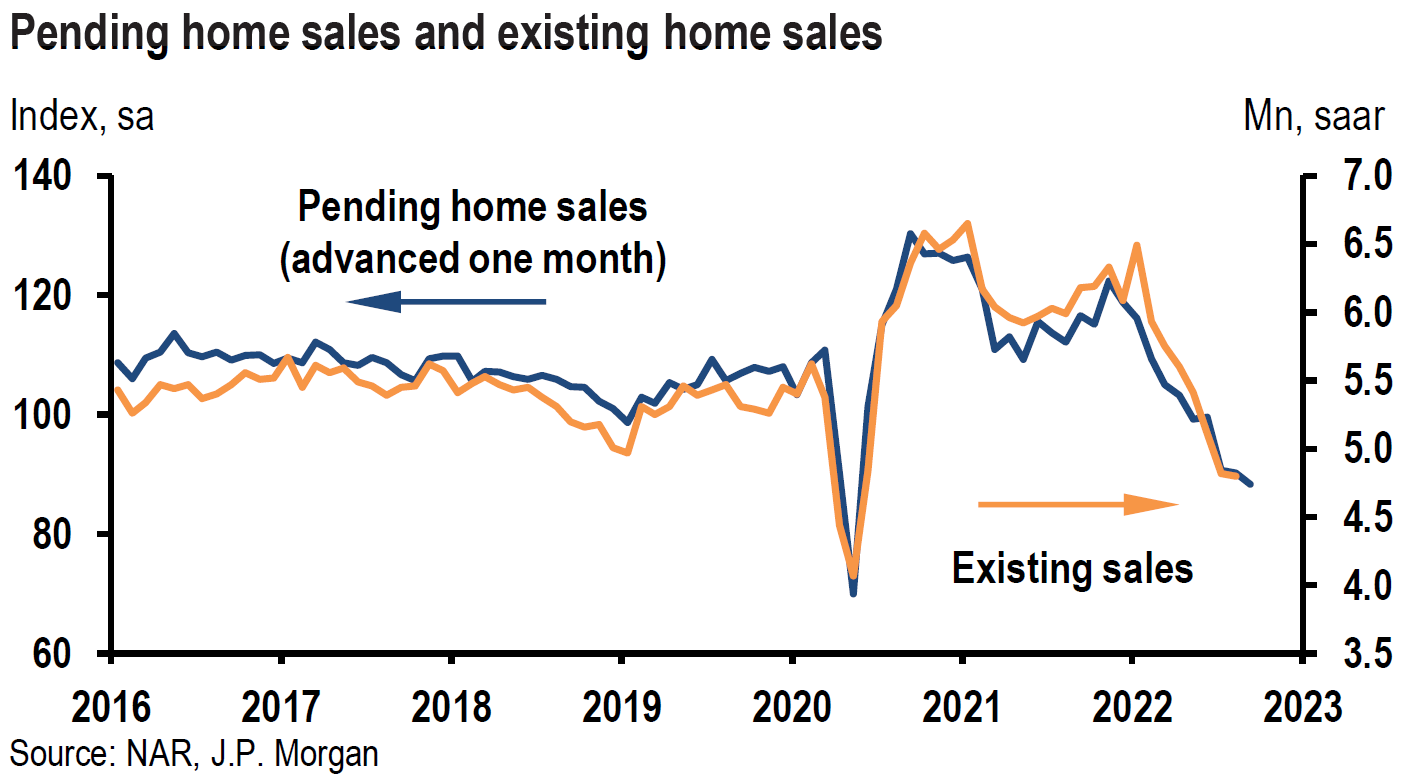
Source: JP Morgan, US: Pending home sales decline again (9-28-2022)
U.S. Trade Deficit
The Census Bureau reported midweek that the U.S. August trade deficit narrowed for the fifth consecutive month to $87.3 billion. Exports fell by $1.7 billion from July and imports were $4.6 billion lower. Wholesale inventories rose 1.3% m/m and 25.1% y/y. July’s inventories were 0.6% higher m/m. We view this data as reflecting a slower U.S. economy – especially the lower import data.
PCE Inflation
On Friday, the Commerce Department released the U.S. Personal Consumption Expenditures index (PCE), which is the Fed’s preferred inflation gauge. Core PCE inflation (ex food and energy) rose 0.6% m/m in August and 4.9% y/y. Food prices were 0.8% higher m/m and energy prices were 5.5% lower m/m. Headline PCE inflation was 0.3% higher m/m in August and was 6.2% higher y/y. The August inflation data was generally higher than expected. Personal income rose 0.3% m/m matching July and expectations. Spending rose 0.4% m/m versus July’s 0.2% decrease m/m but was above expectations of an increase of 3.1%. Spending on goods was 0.3% higher while services spending was 0.6% higher m/m. We saw nothing in this data that would curtail the Fed on its predetermined path of hiking the federal funds rate.
Bottom Line
For the time being we are maintaining our basis investment approach as expressed in last week’s commentary. We continue to prefer high quality big cap stocks that offer good balance sheets, as well as relatively stable cash flows and profit margins. A well-diversified portfolio for long term investors will be most likely the preferred approach.
We foresee an increased probability that the Fed will tighten more than is “required” to rein in inflation. The Fed’s projected higher federal funds rates should increase the risk of a U.S. recession and downside risks for U.S. equities. We anticipate that downward revisions in Q3 results could further pressure equities. On a selective basis, we remain favorably disposed towards energy, health care, financials and growth stocks – including selected high quality tech stocks.
We assume continued volatility across virtually all financial markets. We would only buy selected stocks during market downturns. We remain concerned about relative illiquidity in many financial markets. We remain focused on the many ramifications of the sharp appreciation of USD relative to many currencies. We are apprehensive over the possibility of a financial market “dislocation” attributable to extreme volatility and relative illiquidity. As the U.S. economy weakens, we expect to see credit spreads widening.
Source: Goldman Sachs, Demand concerns mask unresolved underinvestment (9-27-2022)
Definitions
Federal Funds Rate – The term federal funds rate refers to the target interest rate set by the Federal Open Market Committee. This target is the rate at which commercial banks borrow and lend their excess reserves to each other overnight.
Headline PCE Inflation – A measure of the prices that people living in the United States, or those buying on their behalf, pay for goods and services. The PCE price index is known for capturing inflation (or deflation) across a wide range of consumer expenses and reflecting changes in consumer behavior.
Core PCE Inflation – A measure of the prices that people living in the United States, or those buying on their behalf, pay for goods and services that excludes food and energy prices. The core PCE gives a more accurate reading of inflation because food and energy are very volatile parts of the economy.
Conference Board – The Conference Board (CB) is a not-for-profit research organization that distributes vital economic information to its peer-to-peer business members.
Credit Spread – The credit spread is the difference in yield between bonds of a similar maturity but with different credit quality.
Inverted Yield Curve – An inverted yield curve describes the unusual drop of yields on longer-term debt below yields on short-term debt of the same credit quality. Sometimes referred to as a negative yield curve, the inverted curve has proven in the past to be a relatively reliable lead indicator of a recession.
Market Liquidity – Market liquidity refers to the extent to which a market, such as a country’s stock market or a city’s real estate market, allows assets to be bought and sold at stable, transparent prices.
U.S. Dollar Index (DXY) – The U.S. dollar index is a measure of the value of the U.S. dollar relative to a basket of foreign currencies.
Gilts – Government bonds in the U.K., India, and several other Commonwealth countries are known as gilts. Gilts are the equivalent of U.S. Treasury securities in their respective countries.
Emerging Markets – An emerging market economy is the economy of a developing nation that is becoming more engaged with global markets as it grows.
Durable Goods – Durable goods derive their name from the fact that they last in value for a relatively long time. An individual’s wealth is preserved by spending a high proportion of their income on durable, investment, or capital goods, because the goods retain their economic value for longer periods of time.
Trade Deficit – A trade deficit occurs when a country’s imports exceed its exports during a given time period.
Case-Shiller Housing Index – The Case-Shiller Index, formally known as the S&P CoreLogic Case-Shiller U.S. National Home Price NSA Index, is an economic indicator that measures the change in value of U.S. single-family homes on a monthly basis.
Federal Housing Finance Agency (FHFA) – The Federal Housing Finance Agency (FHFA) is a U.S. regulatory agency that oversees the secondary mortgage market.
Stoxx Europe 600 – The STOXX Europe 600 Index is derived from the STOXX Europe Total Market Index (TMI) and is a subset of the STOXX Global 1800 Index. With a fixed number of 600 components, the STOXX Europe 600 Index represents large, mid and small capitalization companies across 17 countries of the European region: Austria, Belgium, Denmark, Finland, France, Germany, Ireland, Italy, Luxembourg, the Netherlands, Norway, Poland, Portugal, Spain, Sweden, Switzerland and the United Kingdom.
S&P 500 – The S&P 500 is a total return index that reflects both changes in the prices of stocks in the S&P 500 Index as well as the reinvestment of the dividend income from its underlying stocks.
Personal Consumption Expenditures Index (PCE) – This is a measure of the prices that people living in the United States, or those buying on their behalf, pay for goods and services. The PCE price index is known for capturing inflation (or deflation) across a wide range of consumer expenses and reflecting changes in consumer behavior. It is produced by the Bureau of Economic Analysis (BEA).
IMPORTANT DISCLOSURES
The views and opinions included in these materials belong to their author and do not necessarily reflect the views and opinions of NewEdge Capital Group, LLC.
This information is general in nature and has been prepared solely for informational and educational purposes and does not constitute an offer or a recommendation to buy or sell any particular security or to adopt any specific investment strategy.
NewEdge and its affiliates do not render advice on legal, tax and/or tax accounting matters. You should consult your personal tax and/or legal advisor to learn about any potential tax or other implications that may result from acting on a particular recommendation.
The trademarks and service marks contained herein are the property of their respective owners. Unless otherwise specifically indicated, all information with respect to any third party not affiliated with NewEdge has been provided by, and is the sole responsibility of, such third party and has not been independently verified by NewEdge, its affiliates or any other independent third party. No representation is given with respect to its accuracy or completeness, and such information and opinions may change without notice.
Investing involves risk, including possible loss of principal. Past performance is no guarantee of future results.
Any forward-looking statements or forecasts are based on assumptions and actual results are expected to vary from any such statements or forecasts. No assurance can be given that investment objectives or target returns will be achieved. Future returns may be higher or lower than the estimates presented herein.
An investment cannot be made directly in an index. Indices are unmanaged and have no fees or expenses. You can obtain information about many indices online at a variety of sources including: https://www.sec.gov/fast-answers/answersindiceshtm.html or http://www.nasdaq.com/reference/index-descriptions.aspx.
All data is subject to change without notice.
© 2024 NewEdge Capital Group, LLC


