

Weekly Summary – May 1 – May 5
Key Observations:
- The Federal Reserve (Fed) appeared to align with our base case scenario outlined in our commentary last week of a hike in the federal funds rate along with a pause for quite some time. Fed chair Powell indicated firmly that the Fed was not considering a cut in rates any time soon.
- Last week we postulated that “equity volatility might begin to increase from its rather dormant state in April.” Through Thursday, the VIX index rose to close over 20, confirming this view. The VIX is a measure of market volatility expectations for the S&P 500 over the next thirty days. But the VIX retreated substantially on Friday. Regional bank stocks were very hard hit on Thursday before a dramatic rebound on Friday. Substantial downdrafts in the stock prices of regional banks are often taken as a sign of an impending credit contraction that would slow economic growth. We surmise that the dramatic rebound in regional bank stock prices was the main driver of strong equity prices in general on Friday.
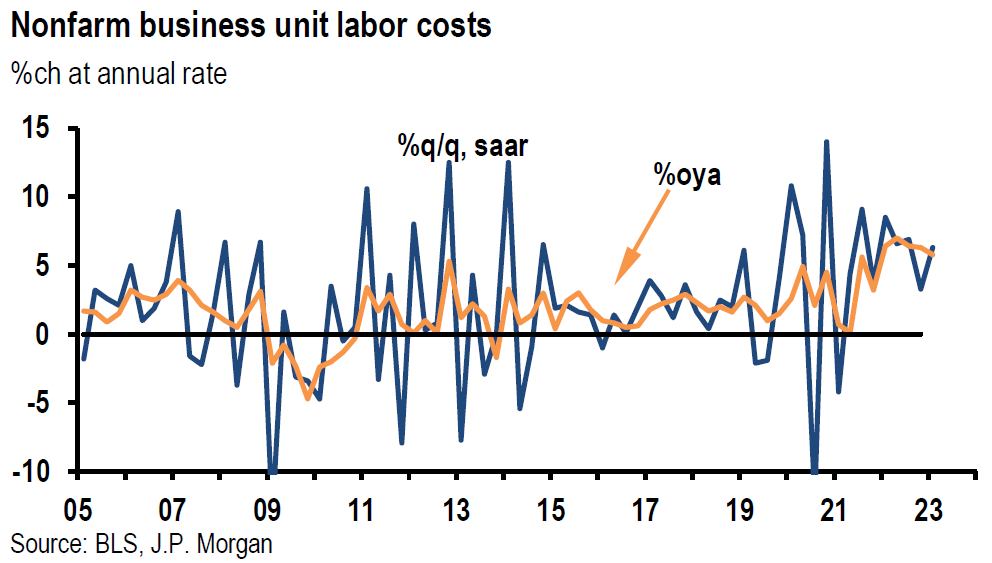
- The better-than-expected U.S. nonfarm payroll additions for April appeared to dampen some expectations for the Fed cutting rates over the near term. The higher-than-expected average hourly earnings also was “helpful” in this regard. We view recent poor labor productivity trends and the increasing unit labor cost tends as headwinds for reducing U.S. inflation. These factors should help prevent the Fed from cutting rates for quite some time. We believe that financial markets appear to be too optimistic in “pricing in” in interest rate cuts this year. A change in incoming economic data could drastically change the Fed’s proclivities to implement various policies.
- The market’s “mood swings” were exemplified by the very substantial rebound in regional bank stock prices after a very substantial drawdown the day before. As we have stated many times before, financial institutions “require” that their customers and investors have confidence in their viability. We have seen how quickly banks can fail once their depositors decide to suddenly withdraw their deposits. We expect that this uncertainty will remain an “overhang” for many financial institutions for quite some time. We believe that these uncertainties will lead many banks to further tighten their lending standards and for credit to contract further. We continue to expect more sudden changes and surprises in economic data.
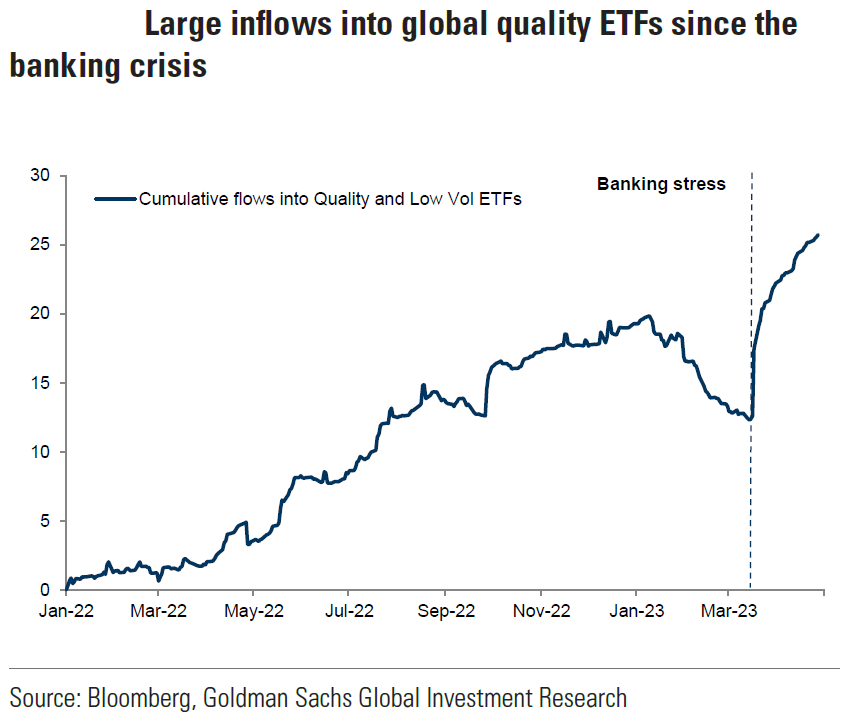
The Upshot: Our general investment approach remains the same as depicted in last week’s commentary. We maintain our preference for quality stocks with good balance sheets, relatively stable cash flows with stable margins. Volatility across sectors continues to be supportive of a diversified portfolio for long term investors. We continue to stress that stock selectivity in the current environment is of paramount importance.
The two-year Treasury yield has been much more volatile than the 10-year or 30-year Treasury yields this week. At some points during this week, the two year was most instrumental in causing the two-to 10-year Treasury yield curve to become much less inverted or more “steep.” As we have noted in prior commentaries, this “bull steepener” of the two-to 10-year Treasury yield curve is often a prelude to an impending recession. As of early Friday afternoon, the two-year Treasury yield was lower for the week, the 10-year Treasury yield was little changed and the 30-year Treasury yield was higher for the week. The two-year Treasury yield is most sensitive to and most reflective of expected changes in the Fed’s interest rate policies. In general, the two-year Treasury yield traded at its lows this week when financial markets were most optimistic that the Fed would cut interest rates in the relatively near future.
FOMC Hikes 25 bps and “Pauses”
Through Thursday, this was another week of “mixed” economic data and earnings reports. Market reactions to “good” or better-than-expected earnings reports were often unpredictable and typically were swayed more by managements’ forward guidance of their earnings and other relevant financial data. But the highlight of this week was the meeting of the Federal Open Market Committee (FOMC or Committee).The Committee decided by a unanimous vote to raise the target federal funds rate 25 basis points (bps) to a range of 5.0% to 5.25%. The FOMC statement retained the phrase from its March statement that the U.S. banking system is “sound and resilient.” Instead of conjecturing on the likelihood of tighter credit conditions due to recent developments, tighter credit conditions were now assumed as a “fact.” “Tighter credit conditions for households and businesses are likely to weigh on economic activity, hiring and inflation. The extent of these effects remains uncertain.” The phrase which indicated that the Committee anticipated “additional policy firming” that may be appropriate was replaced by “In determining the extent to which policy firming may be appropriate to return inflation to 2% over time, the Committee will take into account the cumulative tightening of monetary policy, the lags with which monetary policy affects economic activity and inflation, and economic and financial developments.” On several occasions in his press conference after the release of the FOMC Statement, Federal Reserve (Fed) chair Jay Powell characterized this change as “meaningful.” Powell indicated that there will now be an “ongoing assessment” if more policy firming would be appropriate. This would be considered on a meeting-by-meeting basis and would be therefore data dependent. Whether the new federal funds rate range will be sufficiently restrictive to bring down inflation to the Fed’s 2% target cannot be determined now. The Fed will have to see the “accumulation” of data before it can make that determination. Along with most analysts, we viewed this latest policy stance by the Fed as a “pause” to its rate hiking. This new baseline policy stance is much like our forecast in last week’s commentary that the Fed would hike the interest rate 25 bps and then retain an “elongated pause.”
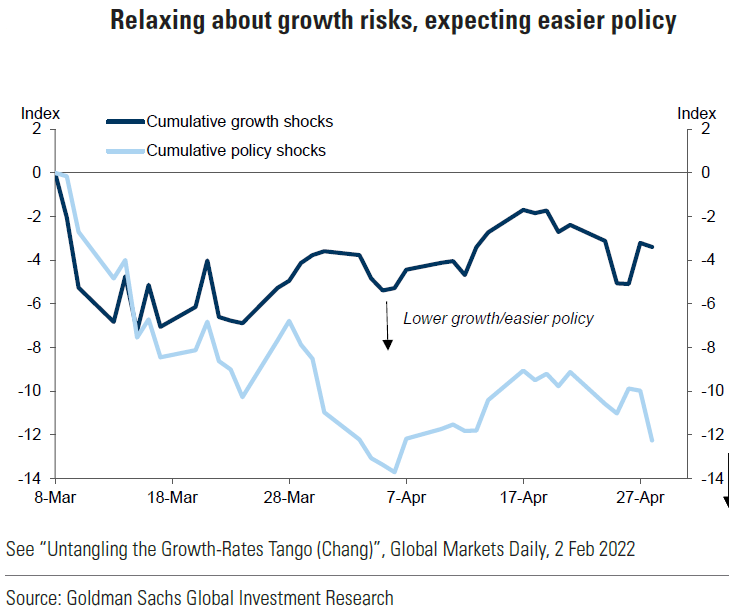
Source: Goldman Sachs, Global Market Views: Back on the Narrow Path (Trivedi/Wilson) (5-1-2023)
“I’m Only Human After All”
In our opinion, Powell did not seem as confident and self-assured as he was in prior press conferences explaining the Fed’s latest pronouncement of its policy stances. It was almost as if Powell was trying to tell us that he was only “human” and that he really was not to blame for the “difficulties” in our current economic environment. We thought that Rag’n’Bone Man’s song “Human” conveyed these feelings in a powerful manner. “Maybe I’m foolish; Maybe I’m blind; Thinking I can see through this; And see what’s behind; Got no way to prove it; So maybe I’m blind; But I’m only human after all … Don’t put your blame on me.” In our most recent weekly commentaries, we have been highlighting the substantial degree of uncertainty in trying to forecast economic growth trends and inflation trends. We surmise that this uncertainty in forecasting might have played a role in the Fed’s decision to pause its rate hikes. Perhaps the Fed was realizing finally that they could no longer be comfortable with their forecasts. “Take a look in the mirror; And what do you see; Do you see it clearer; Or are you deceived; In what you believe.” It is also possible that due to the banking crisis, which first surfaced in March and that exacerbated the uncertainties surrounding credit and the viability of some regional banks, it has become too difficult to forecast at present. It could be that we need to see simply more data before changing any policy stances. “Don’t ask my opinion; Don’t ask me to lie; Then beg for forgiveness; For making you cry,”
Plenty of Blame to Go Around
Although we don’t think the Fed is blameless in our current predicament of high inflation in a slowing economy, we think that there is plenty of blame to go around. The pandemic and the Ukraine-Russia war along with many disrupted supply chains certainly played a large part in accentuating inflation at various times. It appears that managements at many U.S. regional banks lacked sufficient risk controls and were simply bad managers of their respective franchises. The Fed hikes were very well telegraphed and we do blame the managements of some regional banks for their “shaky” predicaments. It is easy to say if not for the Fed’s aggressive rate hiking path, these banks would have avoided their current state. But we believe that risk controls were very lacking at many regional banks. We have stated many times that financial institutions “require” their customers to have confidence in their viability. The predicament of many regional banks has exposed the fragility of the U.S. banking system. We postulate that once lost, regaining confidence is never an easy task. Powell indicated in his press conference that much of the Fed’s current and forward focus will be on determining what is happening with credit. One manifestation of the general loss of confidence in many regional banks, is that the KRE – S&P regional banking exchange-traded fund (ETF) – traded down on Thursday to its lowest level since October 2020. Many regional bank stock prices fared much worse. We hope that the Fed’s assessment of the U.S. banking system as “sound and resilient” is accurate. But we fear that this might be contingent on the stability of deposits at many banking institutions. We have seen how quickly deposits can be withdrawn with devastating consequences.
Tighter Lending Standards and Credit Contraction
Powell stated in his press conference that since the banking crisis surfaced in March, the banking system had “broadly improved.” Powell acknowledged the uncertainty surrounding future credit conditions. The Fed’s decision to “pause” rate hikes and instead rely on an “ongoing assessment” if a more restrictive policy stance would be appropriate seems to be based on at least two unknowns. How many rate hikes are comparable to tighter credit conditions due to banks further tightening their lending standards and to what extent will lending be curtailed. We should mention that an uncertain economic environment should also curtail loan demand. In our April 21 commentary, we highlighted that the Fed’s latest Beige Book – a compilation of anecdotal information from each of the Fed’s twelve Districts – indicated “several Districts noted that banks tightened lending standards amid increased uncertainty and concerns about liquidity.” Powell hinted that the Fed’s Senior Loan Officer Opinion Survey, which will be released early next week, will reflect further bank tightening of their lending standards as well.
Accumulation of Incoming Economic Data Will Determine if Fed Policies are “Sufficiently Restrictive”
It appeared that Powell gave a clear sign that the current targeted federal funds range of 5.0% to 5.25% was either very close, or was now already restrictive enough, to bring inflation down to the Fed’s 2% inflation target. In this context, Powell said “we feel like we’re getting close, or even may be there” already. But Powell still thought that we had a “long way to go” to bring inflation down to 2%, that the Fed was “strongly committed” to attaining that goal and that the Fed is prepared to tighten further when more monetary policy restrictions are “warranted.” This determination will be driven by incoming economic data and will be on a meeting-by-meeting basis. Credit conditions will be a factor in the Fed’s future decisions. Powell indicated that he thinks the U.S. economy will continue to grow at a “moderate” pace and that inflation has moderated somewhat. Powell indicated that avoiding a recession was more likely than having one. He also stated that it was essential that the U.S. debt ceiling be resolved in a “timely” manner, and that the consequences of a U.S. default on its debt obligations would be “quite adverse.” Powell did not think that it is “possible” at this point to make a determination regarding whether the Fed’s policies are sufficiently restrictive. Furthermore, Powell saw the need for the “accumulation” of a sufficient amount of data. Although Powell characterized the labor market as “extraordinarily” tight, he acknowledged that he saw some softening in the labor market. He saw a lot of “excess” demand for labor and that job openings were still high but “cooling.” Powell also noted that there were “some signs that supply and demand in the labor market are coming back into better balance,” and that wage increases have been moving lower. Powell opined that wage increases close to 3% would be consistent with a 2% rate of inflation. He also stated that he did not view wages as a principal driver of inflation.
No Rate Cuts for “Some Time”
Powell offered that he expects to see inflation come down slowly, that it will “take some time” to achieve the Fed’s 2% target and that it will not be a smooth process. In ”that world,” Powell stated that it would not be appropriate to cut rates. This view coincides with our base case stated in last week’s commentary of a “pause” in rate hikes but a holding pattern with no rate cuts for some time. However, financial markets continue to expect that the Fed will cut rates as early as September and that the federal funds rate will be as low as in the 4.3%-to-4.4% range by the end of the year. The Fed’s current “pause” in hiking rates has been characterized by various analysts as a dovish or a hawkish pause. Count us as part of the hawkish view. This is because the Fed still does not anticipate a cut in rates for quite some time and has left open the possibility of at least one more hike without considering rate cuts at this juncture.
March JOLTS Indicates a Less Tight Labor Market
We assume that the Job Openings and Labor Turnover Survey (JOLTS) based on data from the last business day of March was one of the sources which provided a basis for Powell stating that he saw signs of cooling in the U.S. labor markets. Job openings fell by a greater-than-expected 384,000 to 9.59 million versus an expected 9.775 million. This was the lowest number of job openings since April 2021 and the third consecutive month of large declines in job vacancies. The ratio of job openings to unemployed persons fell from a recent peak of 2.0 to 1.6. J.P. Morgan (JPM) considers a level of 1.0-1.2 to be consistent with a less-deflationary job market. The number of “quits” dropped 129,000 to 3.85 million – the lowest since May 2021. The quits rate is considered as a gauge to judge a worker’s confidence in leaving a job and the ability to find another job. It is typical to conclude that the higher the quits rate, the tighter the labor market. Layoffs rose to 1.8 million – the most since December 2020. Job openings and quits remain historically high and layoffs are historically low. However, all three of these measures have been moving in the direction of a less-tight labor market. Establishments with fewer than 10 employees showed decreases in their job openings, as well as increases in their layoffs and discharges rates. However, establishments with more than 5,000 employees saw little change in their job openings, hires and total separations. Could it be that small establishments were starting to feel the effects of tighter credit conditions?
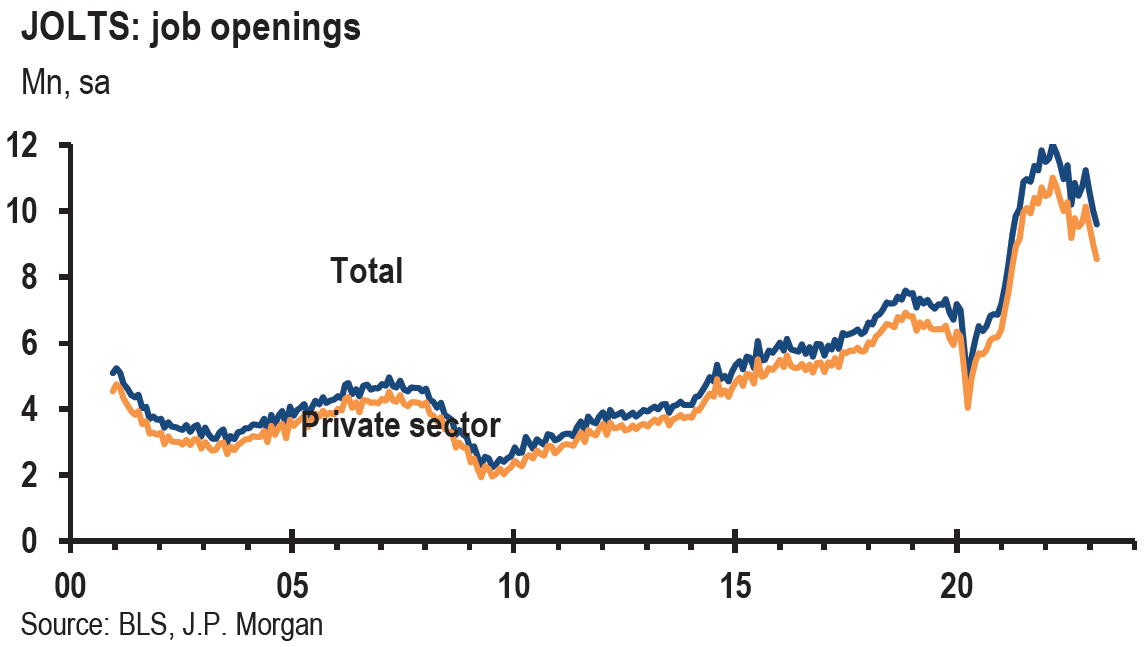
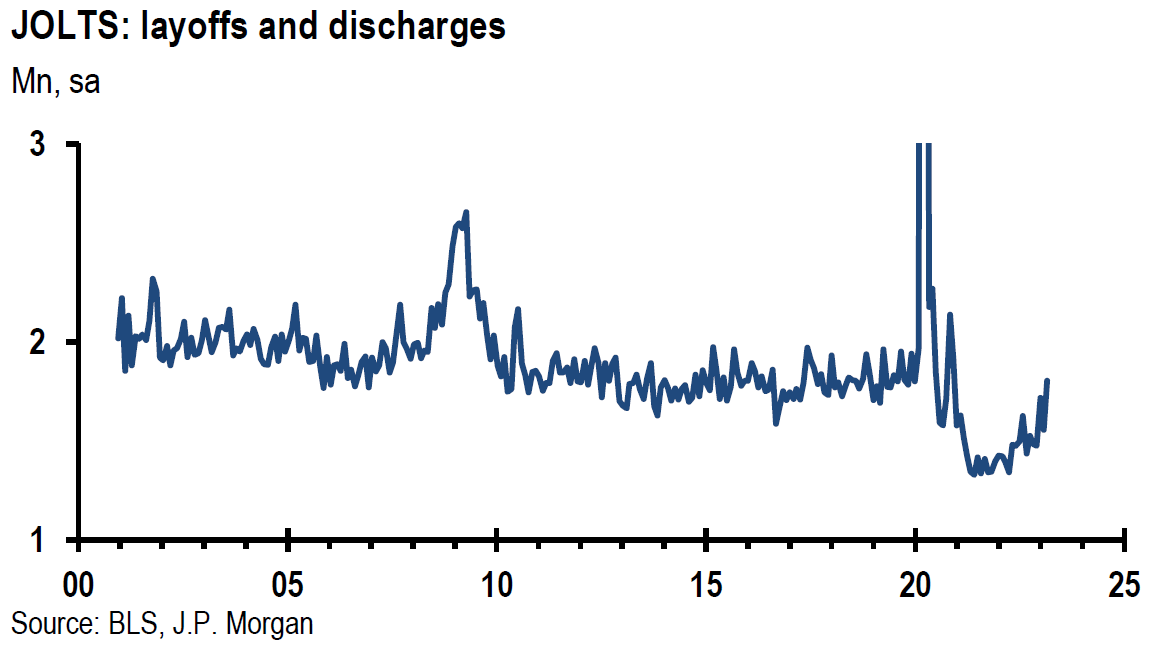
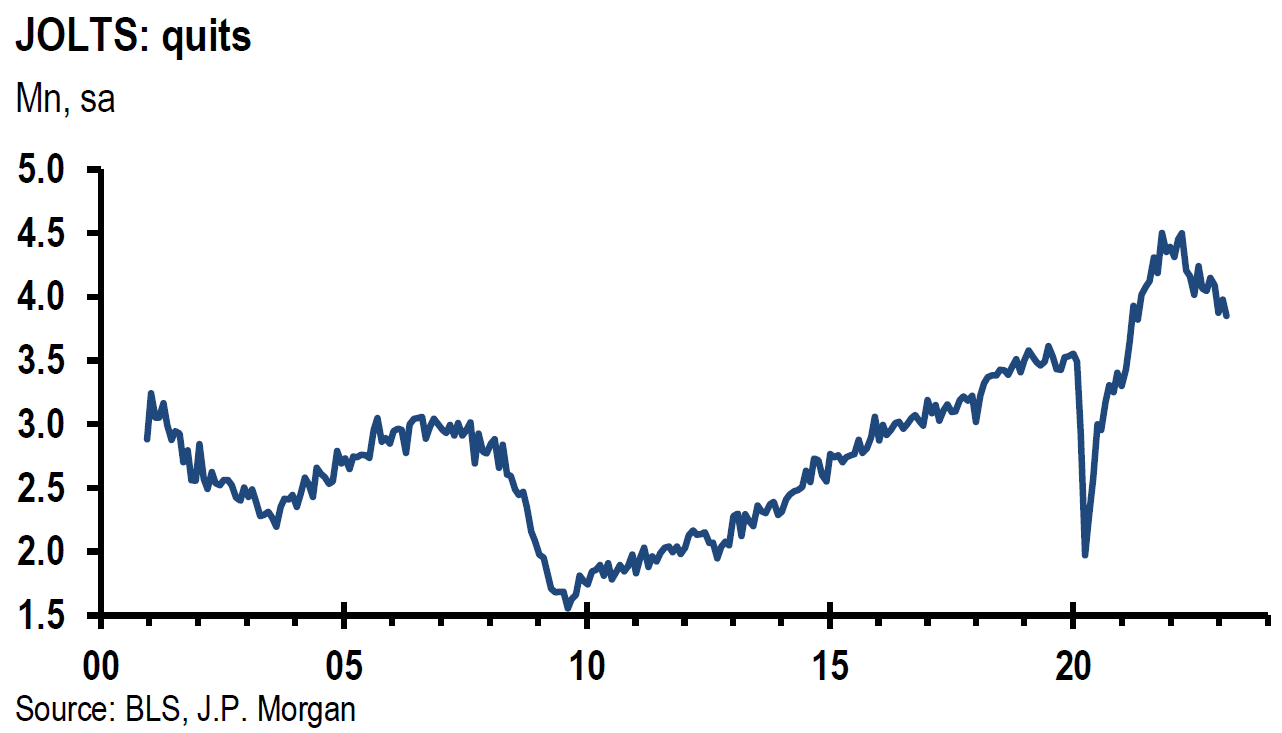
Source: JP Morgan, JOLTS are less jarring (3-2-2023)
Outplacement Firm Challenger Broadly Confirms a Loosening U.S. Labor Market in April
The global outplacement and business and executive coaching firm Challenger, Gray & Christmas, Inc. (Challenger) announced on Thursday its latest job cuts report. U.S. based employers announced 66,995 job cuts in April, a 176% increase from April 2022 but a 25% drop from the 89,703 job cuts announced in March. Retail led all industries with 14,689 cuts, up 270% from March’s level, followed by the technology sector with 11,553 cuts. Year-to-date (YTD), employers announced 337,411 job cuts, a 322% increase over the first four months of 2022. This is the highest four-month total of job cuts to start a year since 2020. YTD the tech sector announced 113,944 job cuts, retail 36,115 cuts and financial 33,356. The Challenger report noted that we have “seen large banks fail recently, which will mean a more cautious approach to the sector going forward.” Hiring plans YTD have also confirmed a slowing jobs market. In April, companies announced plans to hire 23,310 workers for a total of 93,948 so far this year. This total was 81% lower than the first four months of last year. It was also the lowest number of announced hiring plans for that four-month period since 2016.
U.S. Jobless Claims Give Mixed Signals
Initial claims for unemployment benefits rose 13,000 to a seasonally adjusted 242,000 for the week ended April 29 versus an expected 240,000 initial claims. The previous week’s level was revised lower by 1,000. Continuing claims for the week ended April 22 fell by 38,000 from the prior week’s revised level to 1.8 million. The previous week’s level was revised down by 15,000. We continue to characterize these claims numbers as indicating a tight labor market.
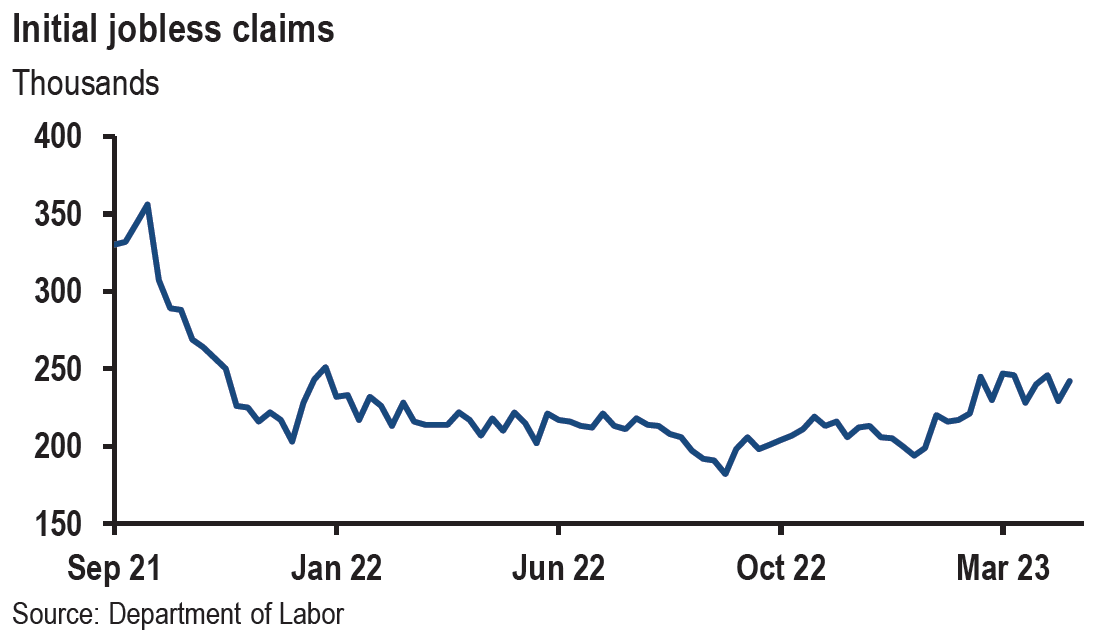
Source: JP Morgan, Thursday data wrap-up (5-4-2023)
Troublesome Trends in Q1 U.S. Labor Productivity and Unit Labor Costs
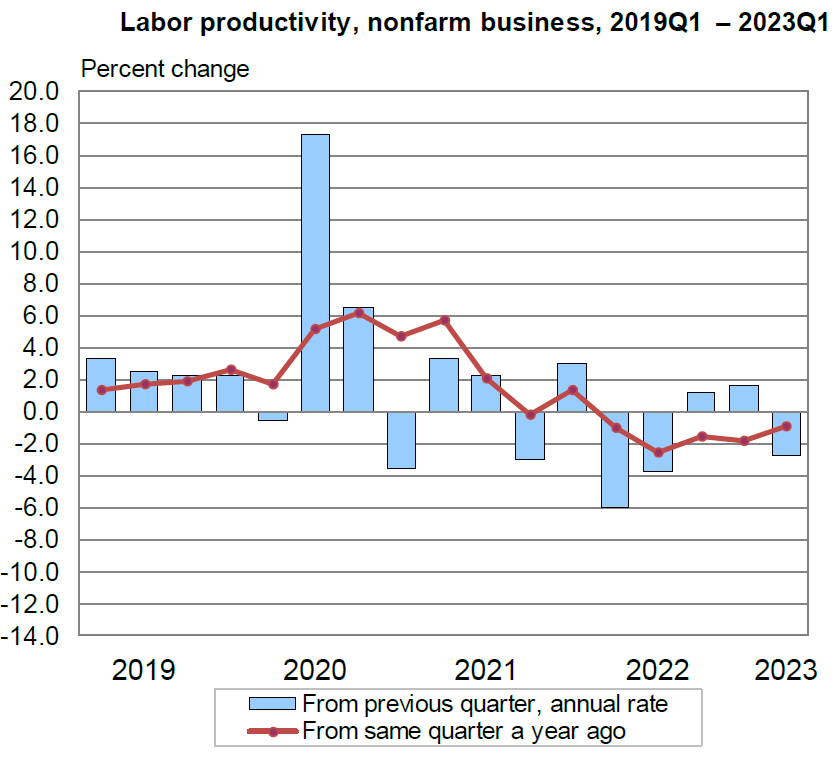
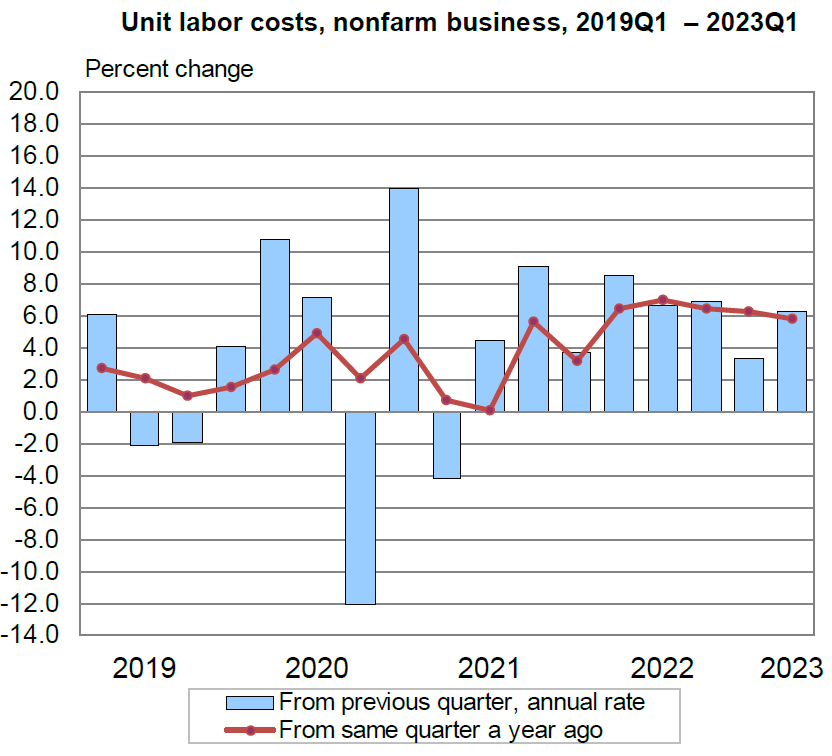
U.S. nonfarm business sector labor productivity fell by 2.7% (seasonally adjusted annual rate) quarter-over quarter (q/q) versus an expected 1.8% drop. Output increased 0.2% and hours worked increased 3.0%. Compared to Q1 2022, labor productivity was 0.9% lower, reflecting a 1.3% increase in output and a 2.3% increase in hours worked. The Q1 0.9% decline was the first time since Q1 1948 that the four-quarter change was negative for five consecutive quarters. U.S. labor costs increased 6.3% in Q1, reflecting a 3.4% increase in hourly compensation and a 2.7% increase in productivity. Unit labor costs increased 5.8% over the last four quarters. The peak year-over-year increase for unit labor costs in this current cycle was 7% in Q2 2022. According to JPM on May 4, 5.8% was almost 4% “above what would be consistent with 2% inflation in a stable profit margin environment.”
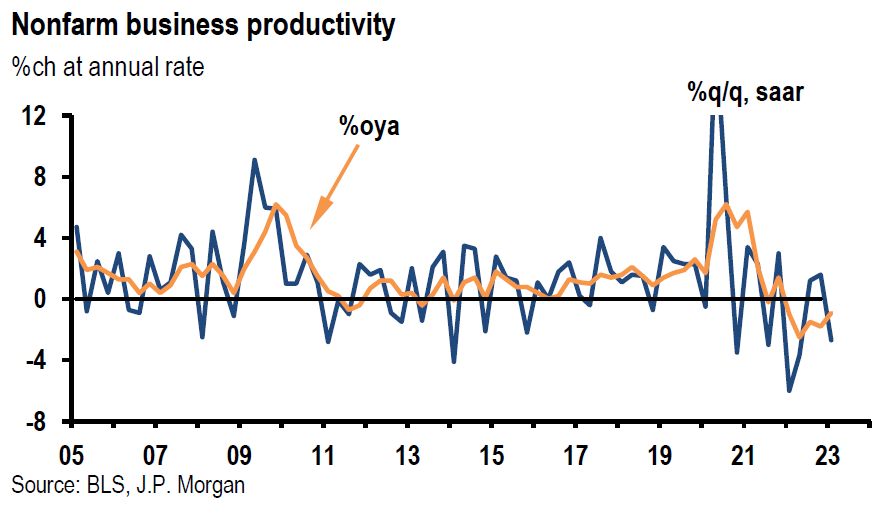
Source: JP Morgan, Thursday data wrap-up (5-4-2023)
Source: US Department of Labor, Productivity and Costs (5-4-2023)
April U.S. Nonfarm Payrolls Exceed Estimates
Total nonfarm payroll employment rose by 253,000 in April versus 180,000 expected. Private payrolls rose by 230,000, which was comprised of an increase in service providing jobs of 197,000 and goods producing jobs of 33,000. Each of March and February totals were revised lower by over 70,000 for a total of 149,000 lower. The three-month average of total jobs added fell from 295,000 in March to 222,000 in April. The three-month average of private jobs added fell from 223,000 to 182,000. The unemployment rate fell to 3.4% from March’s 3.5% rate. The labor force participation rate remained unchanged from the prior month’s reading of 62.6%. Professional and business services industries added 43,000 jobs. Over the prior six months an average of 25,000 jobs were added in this category. Employment in temporary help services declined by 23,000 during April and was now 174,000 lower than its peak in March 2022. Healthcare employment rose by 40,000 in April compared with its average 47,000 gain over the prior six months. The leisure and hospitality industry added 31,000 jobs in April, including 25,000 in food services and drinking places. Leisure and hospitality jobs increased by an average of 73,000 per month over the prior six months. Employment in this industry remains 402,000 jobs short of its February 2020 level, which is a shortfall of 2.4%. Average hourly earnings for all employees on private nonfarm payrolls increased 0.5% month-over-month (m/m) compared to an expected 0.3% increase. Average hourly earnings were 4.4% higher y/y versus an expected increase of 4.2%. Powell made it clear in his press conference this week that he thought that these high rates of wage growth were not compatible with achieving a 2% rate of inflation. We were encouraged by downward revisions in the number of jobs added for March and February, but we found the higher-than-expected wage growth numbers problematic.
U.S. ISM April Manufacturing PMI Improved but Remains in Contractionary Territory
The Institute for Supply Management (ISM) manufacturing Purchasing Managers’ Index (PMI) increased by more than expected to 47.1 from 46.3 in March. A reading of 46.8 was expected. This was the sixth consecutive month of an under 50 reading, which means that the index was in contractionary territory. The sub-indexes of new orders and production rebounded but also remained under 50. The employment index rebounded strongly to 50.2 in April from 46.9 in March. Even though supplier delivery times hit a new cycle low of 44.6, indicating faster delivery times, the prices paid index rose to 53.2 from 49.2 in March.
U.S. ISM April Services PMI was “Mixed” but Continued to Expand
The ISM services PMI increased by a slightly better than expected 0.7% to 51.9. The business activity index was 3.4% lower to 52.0, which was its lowest level since May 2020, and the employment index fell 0.5% to 50.8. New orders rose 3.9% to 56.1 and new export orders rose 17.2 points to 60.9. Prices paid rose slightly to 59.6. Although slightly better than expected, this services index remained near the low end of its range for the last decade.
ECB Raises its Key Deposit Rate by 25 bps to 3.25% as Expected
The president of the European Central Bank (ECB), Christine Lagarde stated: “We have more ground to cover and we are not pausing … that’s extremely clear.” Lagarde described the ECB’s decision as “almost unanimous” with some colleagues favoring a larger hike. Lagarde indicated that the ECB’s key deposit rate may need to rise to 3.75%, a rate last seen in 2000. Hopefully, that rate would be “sufficiently restrictive” to bring inflation down to ECB’s 2% inflation target. In contrast to the Fed’s “pause,” the ECB indicated that more rate hikes are most likely.
Bottom Line
For the time being we are maintaining our basic investment approach as expressed in last week’s commentary. We continue to prefer high quality stocks that offer good balance sheets, as well as relatively stable cash flows and profit margins. We prefer a global diversified portfolio for long term investors. We continue to stress that stock selectivity in this current environment is of paramount importance. We foresee continued financial market volatility.
We believe that we have not seen the end of “problems” emanating from regional banks. We continue to assume that lending standards will be further tightened and that credit will contract further in an uneven manner. We believe that these trends will lessen U.S. economic growth. We expect that high yield spreads will widen further later this year.
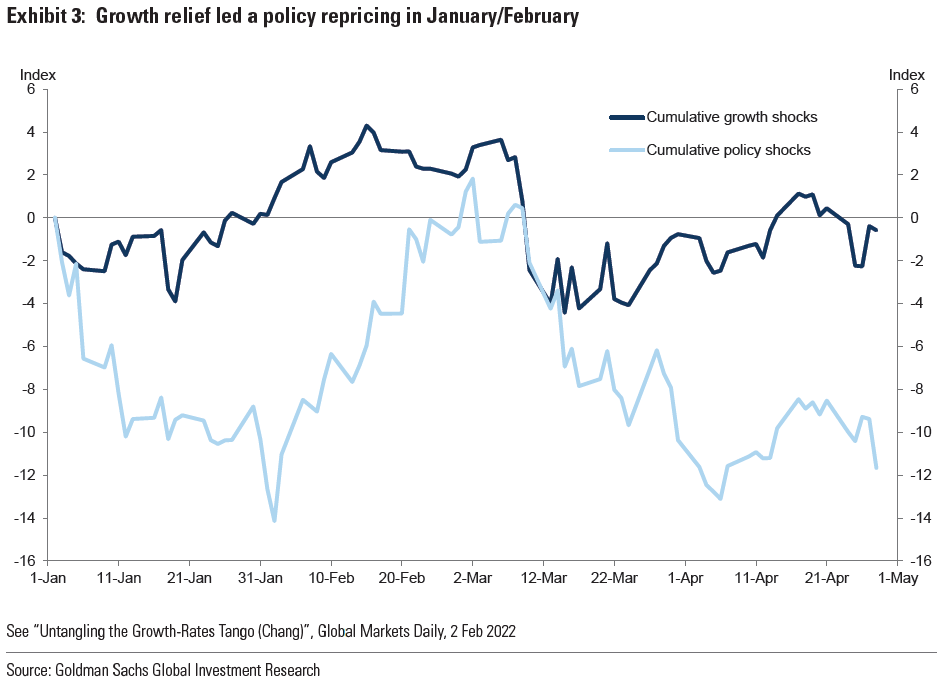
Source: Goldman Sachs, Flight to quality (3-3-2023)
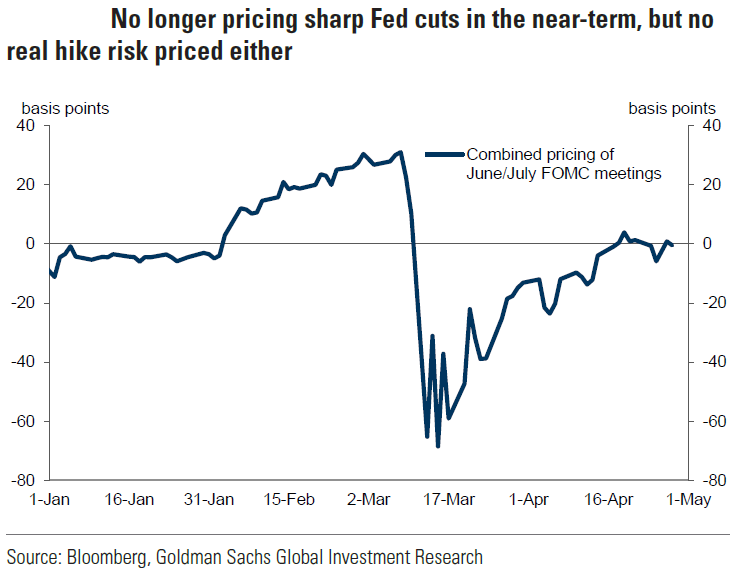
Source: Goldman Sachs, Top of the ‘Fat & Flat’ range (5-4-2023)
Definitions:
Cboe Volatility Index (VIX) – The VIX is a real-time index that represents the market’s expectations for the relative strength of near-term price changes of the S&P 500 Index (SPX). Because it is derived from the prices of SPX index options with near-term expiration dates, it generates a 30-day forward projection of volatility. Volatility, or how fast prices change, is often seen as a way to gauge market sentiment, and in particular the degree of fear among market participants.
S&P 500 – The S&P 500 is a total return index that reflects both changes in the prices of stocks in the S&P 500 Index as well as the reinvestment of the dividend income from its underlying stocks.
SPDR S&P Regional Banking ETF (KRE) – The S&P Regional Banks Select Industry Index represents the regional banks segment of the S&P Total Market Index. The S&P TMI is designed to track the broad U.S. equity market. The regional banks segment of the S&P TMI comprises the Regional Banks sub-industry.
ISM Manufacturing PMI – The ISM manufacturing index, also known as the purchasing managers’ index (PMI), is a monthly indicator of U.S. economic activity based on a survey of purchasing managers at more than 300 manufacturing firms. It is considered to be a key indicator of the state of the U.S. economy.
ISM Services PMI – The Institute of Supply Management (ISM) services PMI (formerly known as Non-Manufacturing Index) is an economic index based on surveys of more than 400 non-manufacturing (or services) firms’ purchasing and supply executives.
Inverted Yield Curve – An inverted yield curve describes the unusual drop of yields on longer-term debt below yields on short-term debt of the same credit quality. Sometimes referred to as a negative yield curve, the inverted curve has proven in the past to be a relatively reliable lead indicator of a recession.
Bull Steepener Yield Curve – A bull steepener is a change in the yield curve caused by short-term interest rates falling faster than long-term rates, resulting in a higher spread between the two rates.
Nonfarm Payrolls – Nonfarm payrolls is the measure of the number of workers in the U.S. excluding farm workers and workers in a handful of other job classifications. The nonfarm payrolls classification excludes farm workers as well as some government workers, private households, proprietors, and non-profit employees.
Nonfarm Productivity – Nonfarm Productivity measures the annualized change in labor efficiency when producing goods and services, excluding the farming industry. Productivity and labor-related inflation are directly linked-a drop in a worker’s productivity is equivalent to a rise in their wage.
Job Openings and Labor Turnover Survey (JOLTS) – The job openings and labor turnover survey are a monthly report by the Bureau of Labor Statistics (BLS) of the U.S. Department of Labor counting job vacancies and separations, including the number of workers voluntarily quitting employment.
Job Openings – JOLTS defines Job Openings as all positions that are open (not filled) on the last business day of the month.
Initial Unemployment Insurance Claims – Initial claims are new jobless claims filed by U.S. workers seeking unemployment compensation, included in the unemployment insurance weekly claims report.
Continuing Claims – Continuing claims track the number of U.S. residents filing for ongoing unemployment benefits in a given week. Continuing claims measure ongoing unemployment benefits, which is in contrast to initial claims, which track new filings for benefits.
Quit Rate – The quit rate refers to employees who leave companies of their own accord as opposed to team members who are laid off or fired. The BLS tracks the number of people who quit their jobs each month in the thousands and issues a quit rate, or the number of quits as a percent of total employment.
Senior Loan Officer Opinion Survey on Bank Lending Practices (SOSLP) – The Senior Loan Officer Opinion Survey on Bank Lending Practices is a survey the Federal Reserve conducts to gain insight into bank lending practices and conditions.
IMPORTANT DISCLOSURES
The views and opinions included in these materials belong to their author and do not necessarily reflect the views and opinions of NewEdge Capital Group, LLC.
This information is general in nature and has been prepared solely for informational and educational purposes and does not constitute an offer or a recommendation to buy or sell any particular security or to adopt any specific investment strategy.
NewEdge and its affiliates do not render advice on legal, tax and/or tax accounting matters. You should consult your personal tax and/or legal advisor to learn about any potential tax or other implications that may result from acting on a particular recommendation.
The trademarks and service marks contained herein are the property of their respective owners. Unless otherwise specifically indicated, all information with respect to any third party not affiliated with NewEdge has been provided by, and is the sole responsibility of, such third party and has not been independently verified by NewEdge, its affiliates or any other independent third party. No representation is given with respect to its accuracy or completeness, and such information and opinions may change without notice.
Investing involves risk, including possible loss of principal. Past performance is no guarantee of future results.
Any forward-looking statements or forecasts are based on assumptions and actual results are expected to vary from any such statements or forecasts. No assurance can be given that investment objectives or target returns will be achieved. Future returns may be higher or lower than the estimates presented herein.
An investment cannot be made directly in an index. Indices are unmanaged and have no fees or expenses. You can obtain information about many indices online at a variety of sources including: https://www.sec.gov/fast-answers/answersindiceshtm.html or http://www.nasdaq.com/reference/index-descriptions.aspx.
All data is subject to change without notice.
© 2024 NewEdge Capital Group, LLC


