

Weekly Summary: November 14 – November 18
Key Observations:
- We envision a more challenging trading environment for financial assets as we approach the Federal Reserve’s (Fed) terminal rate for federal funds along with the release of Q4 earnings results. The principal focus for financial markets in 2022 was on inflation, the Fed’s monetary tightening policies and their effects on interest rates. We foresee an increasing focus on concerns over economic slowdown and recession risks. We postulate that the markets’ focus could shift in rather unpredictable ways among these concerns.
- A flexible mindset will be key in taking advantage of market volatility. We anticipate that the rapidity of changes in the focus of financial markets might necessitate a very diversified portfolio that anticipates such changes. High quality stocks across most sectors could be a preferable approach. Depending on each long-term investor’s needs and risk tolerance, portfolios might include fixed income and other asset classes. We have previously recommended investments in the 10-year Treasury bond when its yield was in the vicinity of 4.2% as a possible hedge for those so inclined.
- Even though U.S. October retail sales showed a resilient consumer, the divergence in the earnings announcements of Walmart and Target this week showed that discretionary purchases such as apparel and general merchandise could come under increasing pressure.
- The two-year-to-10-year yield inverted this week by as much as 69 basis points (bps) – two-year yield higher than the ten-year. We interpret such an inversion as indicating an increased risk of a U.S. recession. Recession risks could be determined largely by whether the Fed “over-tightens” its monetary policies.
The Upshot: Our general investment approach remains the same as depicted in last week’s commentary. We maintain our preference for big cap quality stocks with good balance sheets, relatively stable cash flows and stable margins. Volatility across sectors continues to be supportive of a diversified portfolio for long term investors. We foresee that as the federal funds rate approaches 5%, volatility in the yield curve could increase and possibly become even more inverted. The U.S. dollar (USD) seems to have stabilized in the near term after a rather quick and dramatic drop. We anticipate a more sustained bout of USD weakness to the extent China “reopens,” which could help spur global economic growth.
We maintain our belief that U.S. inflation could dissipate in a more rapid manner than has been anticipated by the Fed and many investors and analysts. We hope that the Fed will be patient enough so that they might see a slower pace of inflation that might allow for a “pause” in rate hikes prior to “over-tightening.” We assume no rate cuts in 2023. In our opinion, most of the economic data that we have analyzed recently, including this week’s data, points to slowing U.S. economic growth along with a lessening of inflationary pressures. We also assume persistent structural changes in inflation that we have discussed since the onset of the pandemic. These include developing more diverse and secure supply chains, with cost not the only consideration. Less reliance on just-in-time inventory policies. Further reliance on more expensive renewable energy sources. Less reliance on Russian energy sources. We would also expect to see more disruptions of food supplies due to sporadic shortages due to climate changes that could lead to more unpredictable and more severe weather patterns. Possible increased U.S. – China tensions.
We will continue to monitor closely the reaction of financial assets to any news items, including economic data, so that we might better discern “what’s priced in.” Our intention is to try to take advantage of market volatility and to continue to buy only when prices are lower. We remain concerned over somewhat illiquid markets that when combined with extreme volatility, could lead to disruptive markets that could then lead to financial instability.
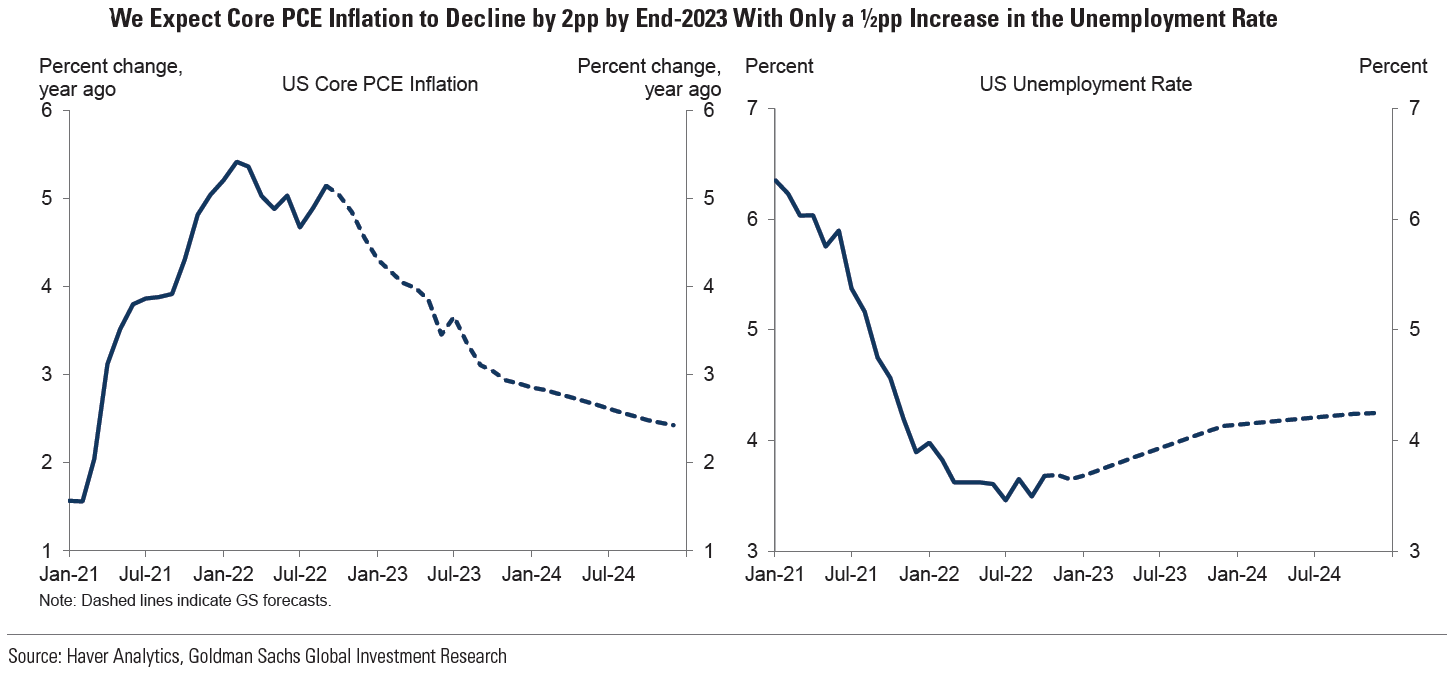
Source: Goldman Sachs, Macro Outlook 2023: This Cycle Is Different (11-16-2022)
Terminal Federal Funds Rate
As we approach the upper limits of the terminal federal funds rate (policy rate), we anticipate a lower level of volatility in overall interest rates. On Thursday, St. Louis Fed president James Bullard indicated that “the policy rate is not yet in a zone that may be considered sufficiently restrictive” to bring inflation down the Fed’s target of 2%. Bullard’s “proper zone” for the policy rate could be in the 5% to 7% range. In Bullard’s opinion, “Thus far, the change in the monetary policy stance appears to have had only limited effects on observed inflation …“ Given the much discussed “lag effects” of Fed monetary policy changes in our previous commentaries, we suggest more patience. The current range is 3.75% to 4.0%. In an interview on Wednesday, the San Francisco Fed president Mary Daly said that she thought a 4.75% to 5.25% range in the federal funds rate is a “reasonable place for us to hold.” She thought that at that point, the Fed would be better able to evaluate the impact of its hikes. She reiterated that “Pausing [stopping to hike rates] is off the table right now. It’s not even part of the discussion.” She also chose to emphasize that to the extent the Fed “holds” rates at the appropriate restrictive level as inflation dissipates, “monetary policy is becoming tighter.” Also on Wednesday, Fed Governor Christopher Waller indicated that he would be “open” to the idea of reducing the federal funds rate pace of increase to 50 basis points (bps) at the December Federal Open Market Committee (FOMC) meeting: “Looking toward the FOMC’s December meeting, the data of the past few weeks have made me more comfortable considering stepping down to a 50-basis-point hike.” Waller wanted to make clear that he was “data dependent” in his decision making.
Inflation and Fed Monetary Tightening Policies Focus Versus Economic Slowdown Focus
As indicated in our commentary last week, we surmise that the economic data we have analyzed “is broadly supportive of our notion that U.S. inflation could dissipate in a more rapid manner than has been anticipated by the Fed and many investors and analysts.” Given our assumptions, we remain hopeful that the Fed will “pause” its rate hikes when the federal funds rate is in the 5.0% to 5.25% range. As we approach that level, we foresee diminished overall interest rate volatility. However, we forecast continued volatility in the two-year-to-10-year Treasury yield curve. The yield curve inversion – two-year yield higher than 10-year yield – traded at a forty-one year high of at least 69 bps this week. We would not be surprised to see the two-year-to-10-year Treasury yield curve become even more inverted in the midst of still more volatility in this inversion. As discussed in our November 4 commentary, we view such extreme inversions as indicative of increased probability of a U.S. recession next year.
During 2022, our principal concern revolved around inflation trends and the extent of the Fed’s monetary tightening. We now anticipate entering a period in the not-too-distant future of concerns over inflation and the Fed’s monetary tightening policies on the one hand, and escalating concerns over the extent of an economic slowdown and the effect that a slowdown will have on margins and earnings. We can envision a scenario where financial markets will choose to focus on one or the other of these concerns in an unpredictable fashion. We believe that this could lead to a more unpredictable trading pattern early next year. Since shifts in sectors and asset classes could occur very swiftly, we continue to recommend well-diversified portfolios for long-term investors. This was yet another week that was illustrative of daily sector volatility, as well as volatility in other asset classes. In our November 4 commentary, we recommended a 10-year Treasury yield with a yield hovering near 4.2% as a possible hedge against a recession in a diversified portfolio for those so inclined. That yield traded under 3.7% this week.
“I Still Haven’t Found What I’m Looking For”
In a shifting investment landscape we have portrayed above, we conjecture that many investors and analysts will be able to relate to U2’s song “I Still Haven’t Found What I’m Looking For.” But we are relatively certain that we will all be trying to comprehend more fully the trends in financial markets. In this context, we should continue to follow our 2022 strategy of buying desired securities only on downturns in their prices. We will continue to try using financial market volatility to our advantage. Eventually, we hope to discern more predictable trends in global economies and financial markets. Additionally, we suppose that there could be abrupt shifts in market sentiment, positioning and economic trends. We continue to view “rapidity of change” as the hallmark of economic and financial markets since the pandemic began, and which was further exacerbated by Russia’s invasion of Ukraine. A flexible mindset is key.
New York Fed’s Survey of Inflation Expectations
The general trends of a slowing U.S. economy along with signs of dissipating inflation trends that we have highlighted in many of our commentaries was evident again this week. The New York Fed’s survey of consumer inflation expectations in October once again showed consumers’ sensitivity to gasoline prices. Inflation expectations over the next year jumped from 5.4% in September to 5.9%. Three-year inflation expectations rose from 2.9% to 3.1% and five-year expectations rose from 2.2% to 2.4%. We view these changes as still portraying well-anchored inflation expectations. One year inflation expectations were influenced heavily by perceptions of gasoline prices that were now expected to increase 4.8% over the next year versus an expected increase of just 0.5% in September. This was the largest monthly increase since this survey began in 2013. Home prices were expected to appreciate only 2% over the next year, which was tied for the lowest expectation since June 2020. A record high 56.7% of respondents thought that credit would be more difficult to obtain next year.
October PPI
The Bureau of Labor Statistics (BLS) released the U.S. October Producer Price Index (PPI) this week. Like the Consumer Price Index (CPI) released last week, its components were less than expected and showed a slowing rate of wholesale prices in general. Headline PPI increased 0.2% month-over-month (m/m) versus an expected increase of 0.4%, and gained 8.0% year-over-year (y/y) versus a peak annual increase of 11.7% in March. Core PPI, which excludes food and energy, was flat m/m versus an expected increase of 0.3% and was +6.7% y/y. The peak core PPI y/y rate of 9.7% also occurred in March. Wholesale services inflation decreased 0.1% m/m, which was the first monthly decrease in that measure since November 2020.
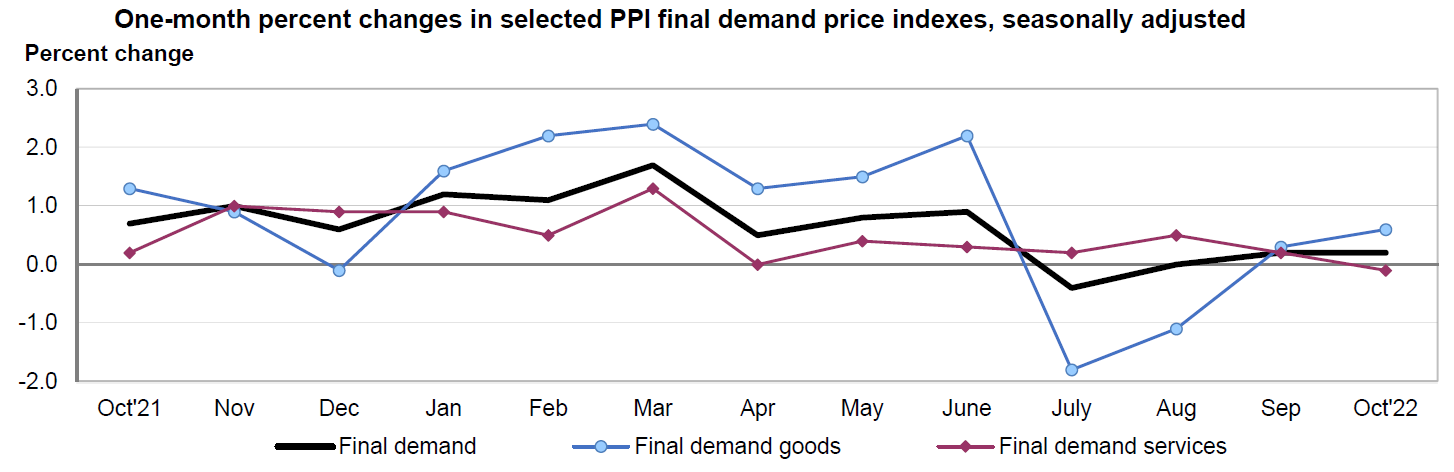
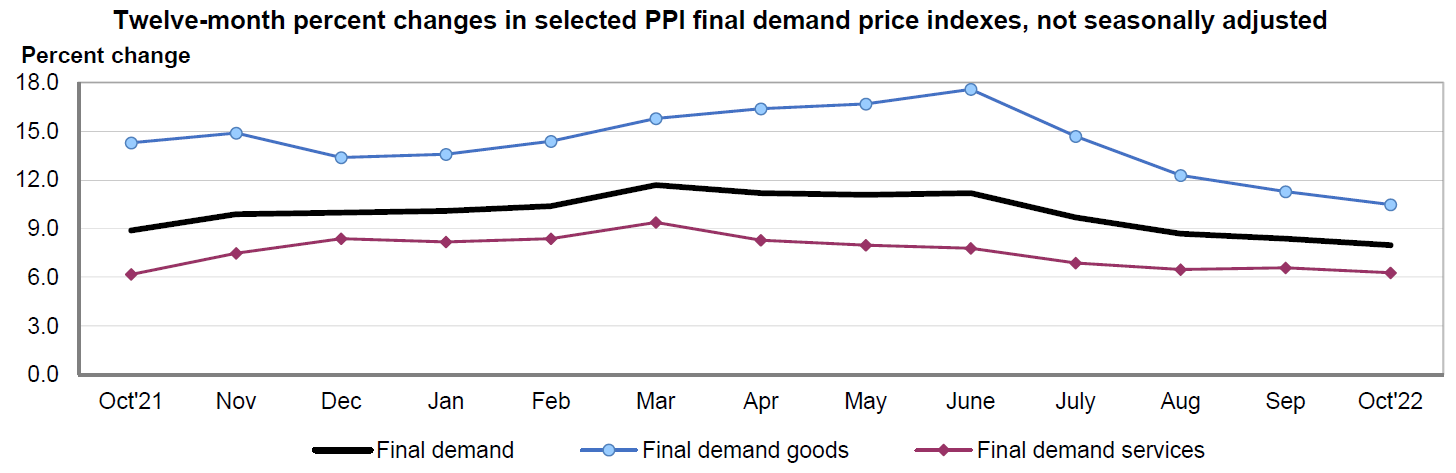
Source: US Department of Labor, Producer Price Indexes – October 2022 (11-15-2022)
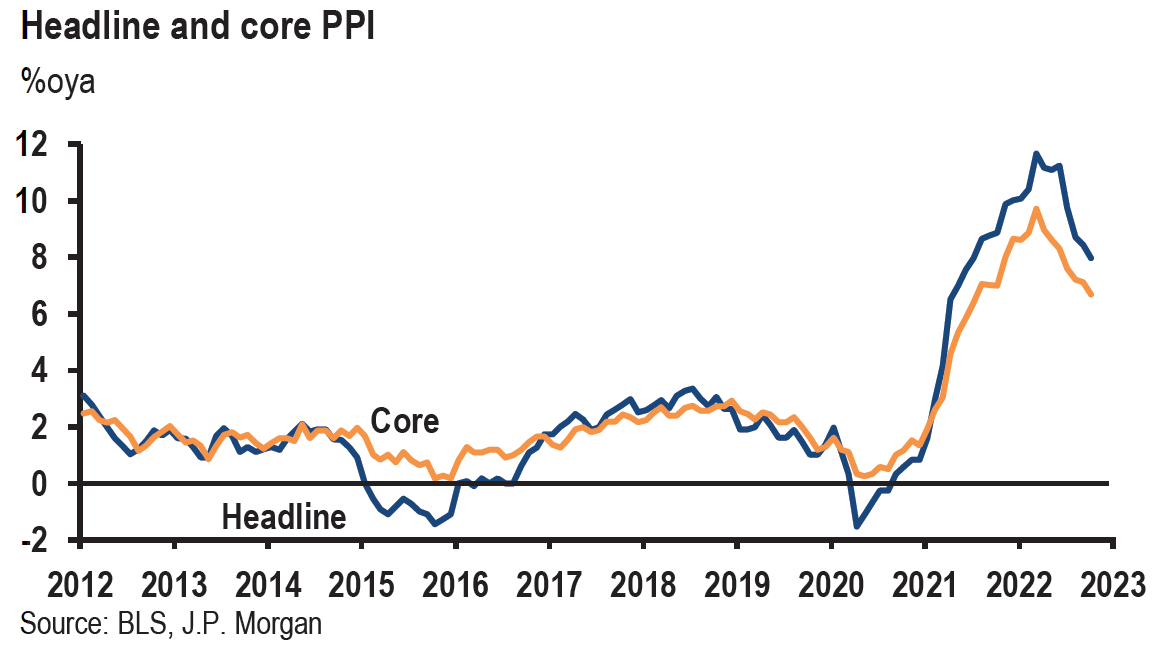
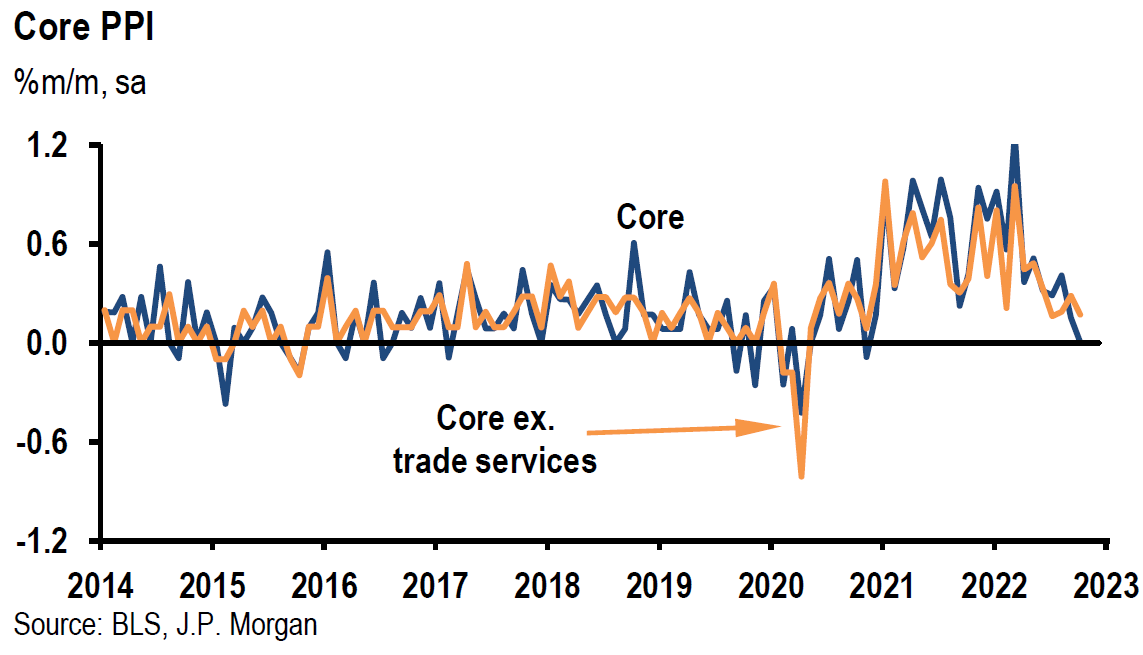
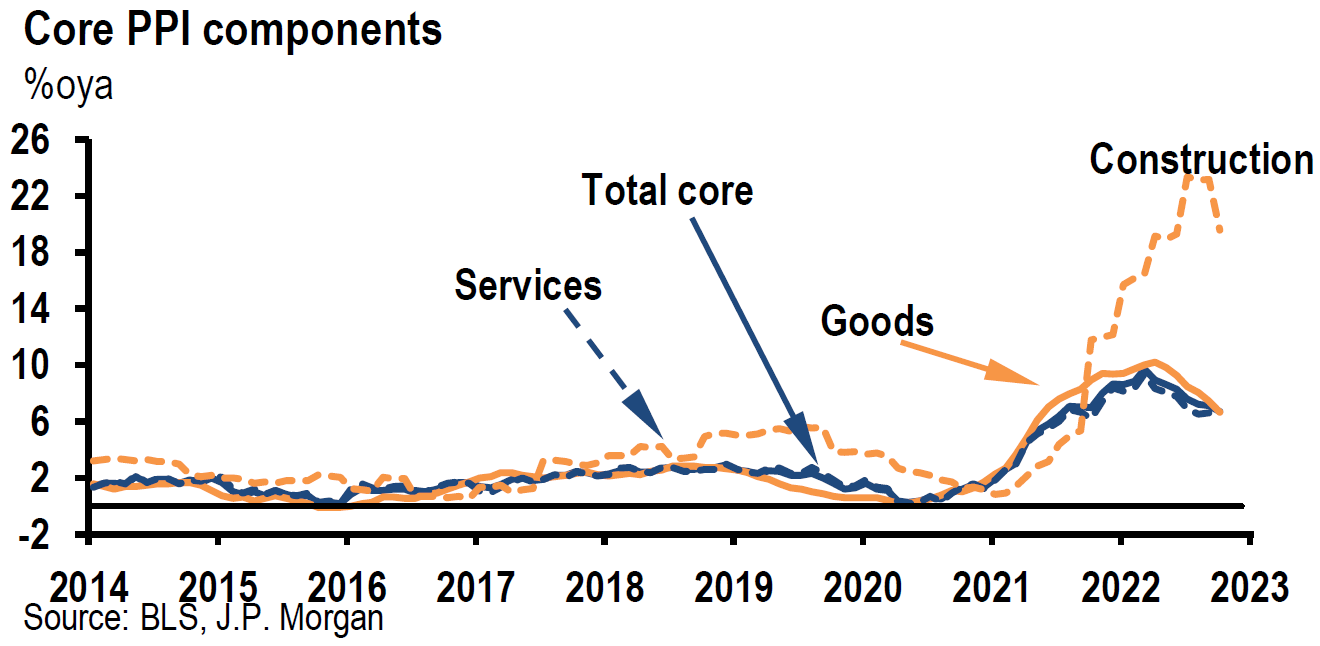
Source: JP Morgan, US: October PPI data signal moderating inflation (11-15-2022)
Regional Fed Surveys
The November manufacturing surveys of the New York Fed (Empire State), Philadelphia Fed and Kansas City Fed were mixed. These surveys were either rather pessimistic about business conditions over the next six months or showed a slowdown in current business conditions. The headline Empire State current business conditions rose 14 points to climb out of negative territory to 4.5, which was the first positive reading since July. But many respondents expected business conditions to worsen over the next six months as the index for future business conditions fell four points to a negative -6.1. The Philadelphia Fed’s headline for manufacturing general business activity fell further into negative territory from -8.7 to -19.4 – the lowest level since May 2020 and much below the expected level of -6.2. Although future indexes rose slightly, they continue to suggest a decline in business activity and new orders six months from now. The Kansas City Fed manufacturing survey continued to show a negative reading – a composite index of -6 versus a -7 in October. The manufacturing production index grew at the second-slowest pace since March 2021. Both the current and expected supplier delivery times reached their lowest levels in the history of this survey, which we welcome as a sign of easing of supply constraints that should help ease inflationary pressures.
The New York Fed’s Business Leaders Survey conducted in regard to service firms in the New York area, continued to show a decline as the headline business activity index rose four points but remained in negative territory at -11.8, which was the third negative reading in the past four months. The business climate index edged down further to -43.6. Although employment continued to expand, the still-elevated wages index fell to its lowest level in more than a year. Hiring plans appeared to weaken. Many service firms grew more pessimistic about the six-month business outlook as the index for future business climate fell to its lowest level since early 2020.
Weaker U.S. Housing Market Trends Continue
The National Association of Home Builders (NAHB) index of U.S. homebuilders for November is meant to provide a measure of the single-family housing market. This survey fell another five points to 33, versus an expected level of 36. Excluding the onset of the pandemic, this month’s decline marked a deterioration to a ten-year low. This index has declined in every month this year. Sixty percent of homebuilders were offering incentives to buy a home in November versus only 13% in September. Current sales conditions fell from 45 to 39, and sales expectations over the next six months fell four points to 31. Similarly, traffic of prospective buyers dropped five points to 20. The NAHB chair summarized: “Higher interest rates have significantly weakened demand for new homes as buyer traffic is becoming increasingly scarce.” But according to Freddie Mac, the average 30-year fixed rate mortgage fell from 7.08% the prior week to 6.61% this week. This was the largest week-over-week decline since November 1981.
U.S. housing starts declined 4.1% m/m in October versus an expected decrease of 2.0% and were 8.8% lower y/y. Single family starts were 6.1% lower m/m as they fell to their lowest level since May 2020. Housing permits fell 2.4% m/m and were down 10.1% y/y. Single family permits decreased 3.6% m/m.
According to Realtor.com on November 17, rents in October rose 4.7% y/y. which was the slowest annual increase in 18 months. The chief economist at Realtor.com struck a relatively optimistic tone: “While it’s still a bit early to say we’re officially on a downward trajectory for rent prices, the data shows a promising return toward normal seasonal slowdowns and suggests that the astronomical price gains of the past several years may be behind us.” Rent growth annually has been slowing for nine consecutive months. Nevertheless, rents are 23.5% higher from October 2019, before the pandemic hit. Recent CoreLogic reports show that apartment rents are cooling more quickly than single-family rents, which have been in a downward trajectory over the past five months. Single-family rents increased 10.2% y/y in September, down from an annual gain of almost 14% in April.
The National Association of Realtors reported this week that sales of existing U.S. homes declined for the ninth consecutive month in October, falling 5.9% m/m and down by 28.4% y/y. This marks the longest streak of declining sales on record.
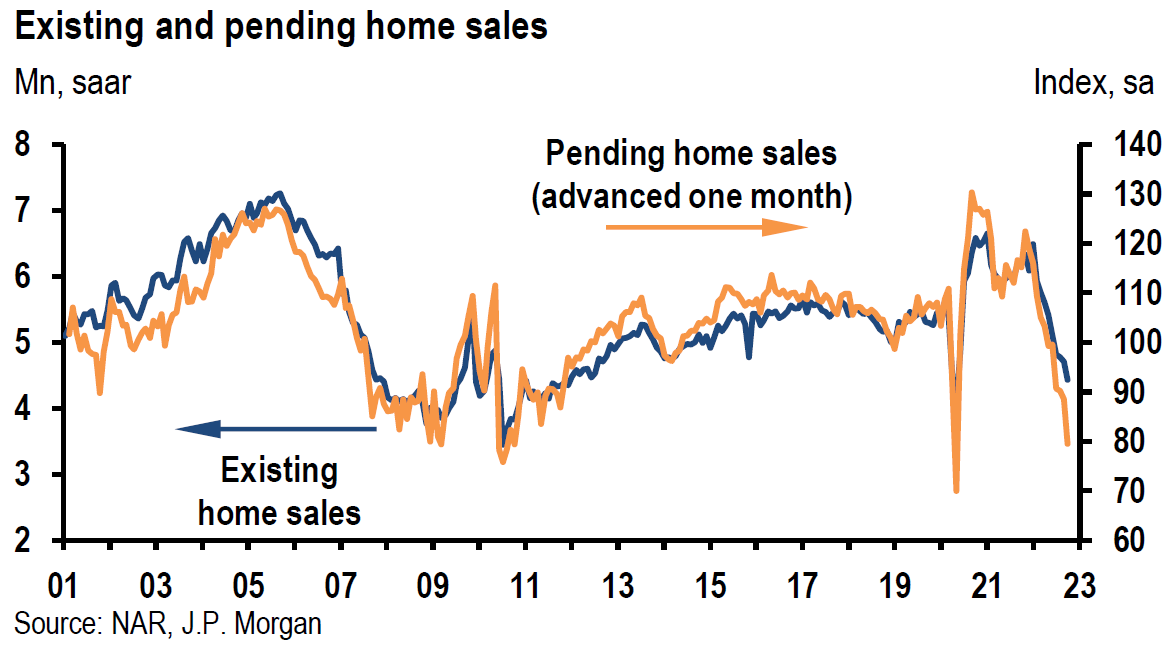
Source: JP Morgan, US: Existing home sales fall another 5.9% (11-18-2022)
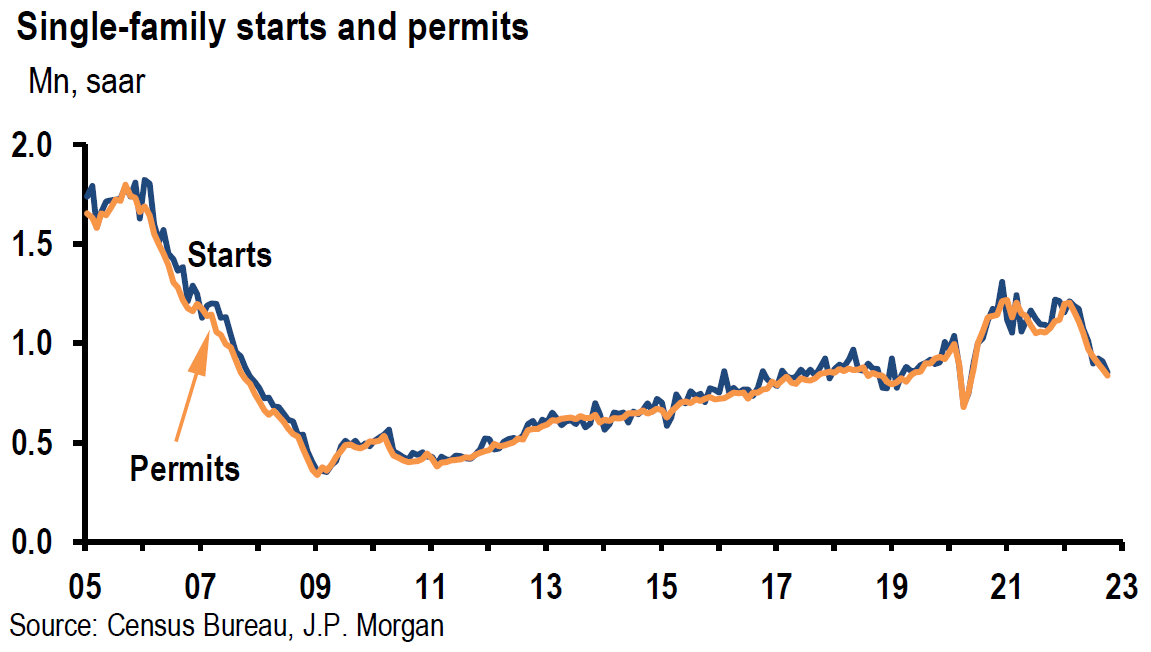
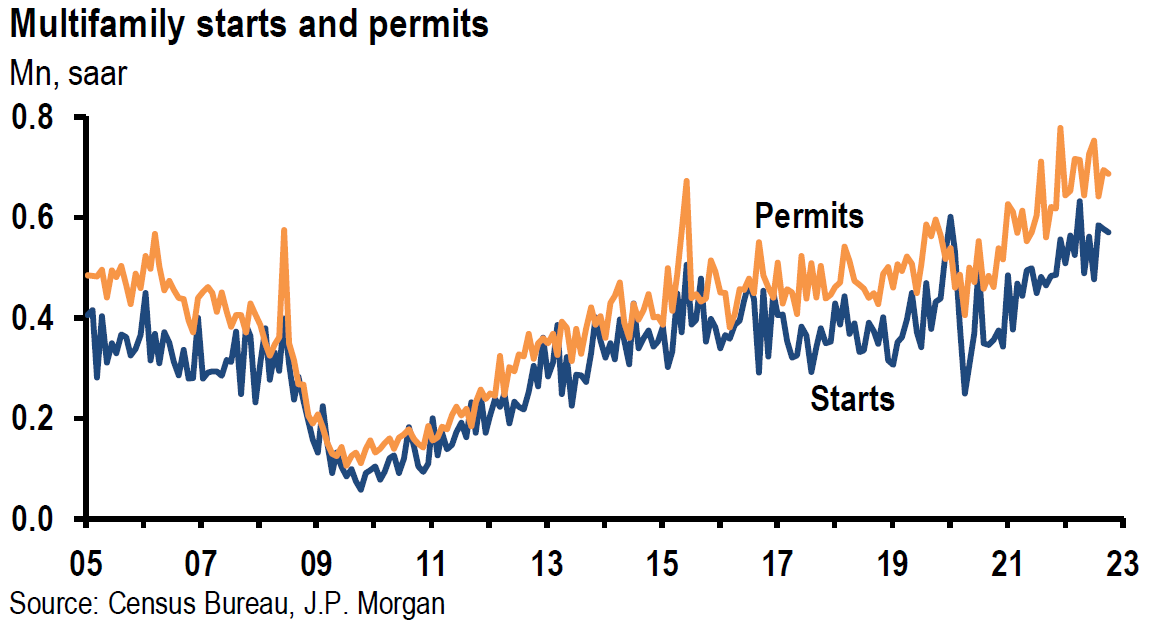
Source: JP Morgan, US: Housing starts and permits move down again (11-17-2022)
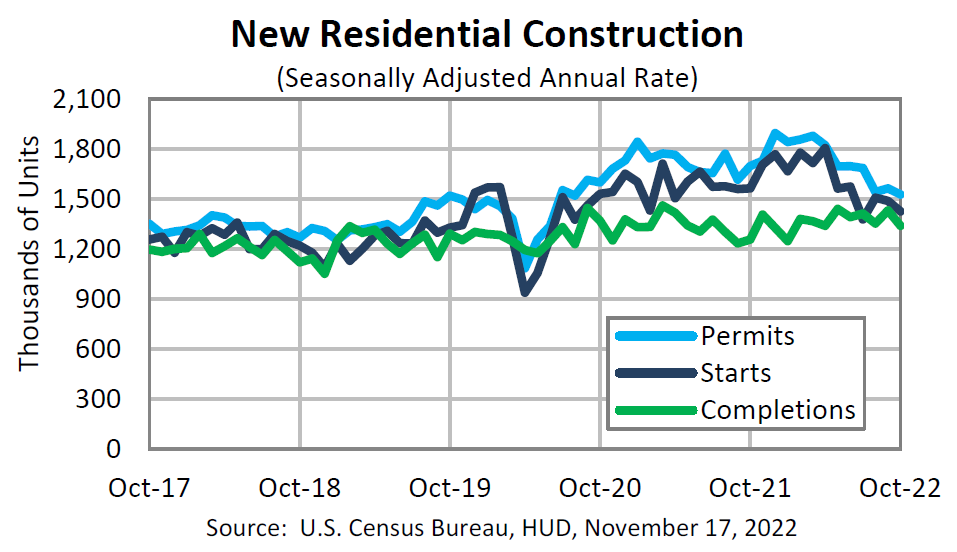
Source: US Census Bureau, Monthly New Residential Construction, October 2022 (11-17-2022)
U.S. Consumer Debt Increases
The New York Fed released its Q3 report on household debt and credit this week. Credit card balances rose more than 15% y/y, which is the largest annual increase in more than twenty years. Mortgage balances also grew substantially.
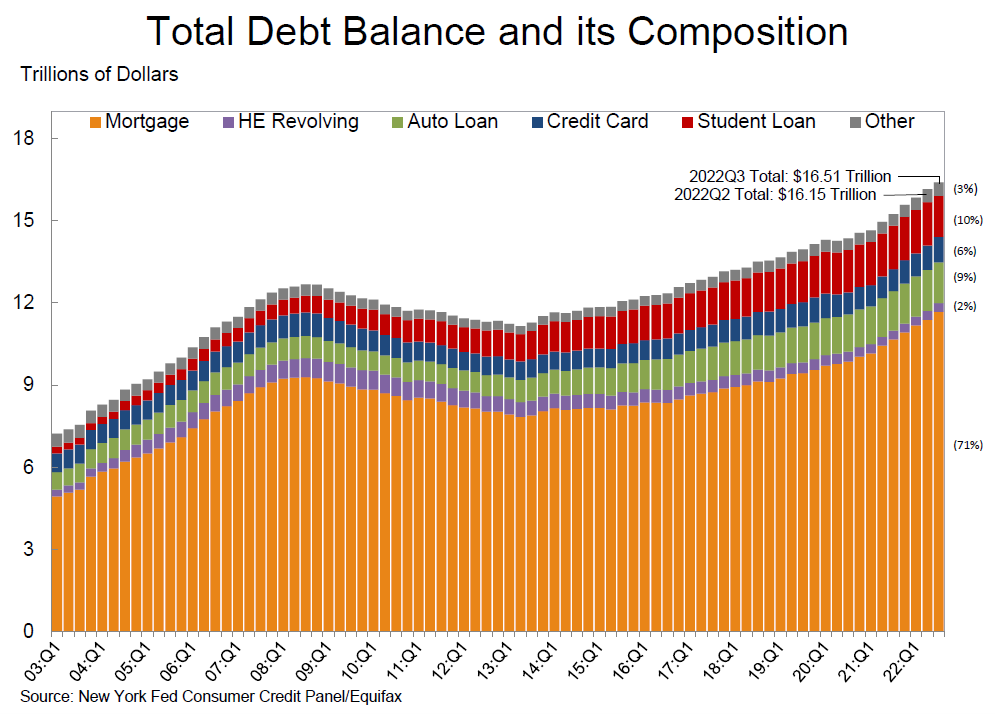
Source: New York Fed Consumer Credit Panel, Quarterly Report on Household Debt and Credit (Nov 2022)
U.S. October Retail Sales
Retail sales exceeded expectations as they increased 1.3% m/m and 8.3% y/y versus an expected growth of 1.0% m/m. After a flat m/m reading in September, this month’s rise was the largest monthly increase in eight months. Sales at motor vehicle dealers also rose 1.3% m/m as supply chain constraints continued to ease. Gas stations sales increased 4.1% m/m, mostly reflecting higher gasoline prices. Excluding gasoline and autos, retail sales grew 0.9% m/m. These retail figures suggest a resilient consumer who continues to spend despite higher inflation and rising borrowing costs hitting consumer demand. These overall robust retail figures seem to mask a less resilient consumer under the surface as exemplified by the vast differences in the stock price performance and outlook of Walmart when compared to Target this week. The more robust Walmart results seem to be due to their greater reliance on goods of necessities, such as food and groceries, and less so on more discretionary purchases such as apparel and general merchandise when compared to Target.
U.S. October Industrial Production
Industrial production decreased 0.1% m/m versus an expected gain of 0.1%. Manufacturing production also disappointed with a gain of just 0.1% m/m versus expectations of +0.2%. The 3.3% y/y increase was the smallest annual increase since January. The previously reported gains in manufacturing output for July, August and September were all lower. Capacity utilization decreased 0.2% in October to 79.9%. This is still 0.3% above its long-run average between 1972 and 2021.
U.S. Leading Indicators
The Conference Board Leading Economic Index (LEI)decreased by 0.8% in October to 114.9 after a 0.5% September decline. The LEI has now declined for eight consecutive months and is 3.2% lower over the past six months. The Senior Director, Economics, at the Conference Board summarized this survey’s findings: “The downturn in the LEI reflects consumers’ worsening outlook amid high inflation and rising interest ratees, as well as declining prospects for housing, construction and manufacturing. The Conference Board forecasts real GDP growth will be 1.8% y/y in 2022, and a recession is likely to start around year end and last through mid-2023.”
Bottom Line
For the time being, we are maintaining our basic investment approach as expressed in last week’s commentary. We continue to prefer high quality big cap stocks that offer good balance sheets, as well as relatively stable cash flows and profit margins. We expect volatility across virtually all financial markets to continue.
We are still hoping that inflation might dissipate quickly enough so that the Fed does not “over-tighten.” To the extent the Fed is really data dependent as they now claim, we do not anticipate the terminal federal funds rate to exceed the 5.0% to 5.25% range. Absent any financial instability, we do not expect the Fed to cut rates next year. We interpret the extreme inversion of the two to 10-year Treasury yield curve as indicating an increased probability of a U.S. recession next year. We expect more volatility in regard to this part of the yield curve as we approach a 5% federal funds rate. We will continue to try to decipher what’s “priced in“ to various financial markets to enable us to take better advantage of volatility. We assume many persistent structural changes that could make it more difficult to achieve the Fed’s 2% inflation target.

Definitions
Producer Price Index (PPI) – The producer price index (PPI), published by the Bureau of Labor Statistics (BLS), is a group of indexes that calculates and represents the average movement in selling prices from domestic production over time. It is a measure of inflation based on input costs to producers.
Core Producer Price Index (PPI) – The core producer price index (PPI), published by the Bureau of Labor Statistics (BLS), is a group of indexes that calculates and represents the average movement in selling prices from domestic production over time that excludes food and energy prices, which are the more volatile parts of inflation.
Federal Funds Rate – The term federal funds rate refers to the target interest rate set by the Federal Open Market Committee. This target is the rate at which commercial banks borrow and lend their excess reserves to each other overnight.
Fed Funds Terminal Rate – The terminal rate is defined as the peak spot where the benchmark interest rate, the federal funds rate, will come to rest before the central bank begins trimming it back.
Basis Points (bps) – A basis point is one hundredth of one percent, used chiefly in expressing differences of interest rates.
Inverted Yield Curve – An inverted yield curve describes the unusual drop of yields on longer-term debt below yields on short-term debt of the same credit quality. Sometimes referred to as a negative yield curve, the inverted curve has proven in the past to be a relatively reliable lead indicator of a recession.
Federal Open Market Committee (FOMC) – The Federal Open Market Committee (FOMC) is the branch of the Federal Reserve System that determines the direction of monetary policy specifically by directing open market operations. The committee is made up of 12 members: the seven members of the Board of Governors; the president of the Federal Reserve Bank of New York; and four of the remaining 11 Reserve Bank presidents on a rotating basis.
Fed “Over-tightening” – Fed “over-tightening” refers to the Fed “over doing” it and raising interest rates perhaps too high, which could lead to serious economic risks in the market.
Leading Economic Indicators Conference Board – The components of The Conference Board Leading Economic Index for the U.S. include:
- Average weekly hours in manufacturing – The average hours worked per week by production workers in manufacturing industries tend to lead the business cycle because employers usually adjust work hours before increasing or decreasing their workforce.
- Average weekly initial claims for unemployment insurance – The number of new claims filed for unemployment insurance are typically more sensitive than either total employment or unemployment to overall business conditions, and this series tends to lead the business cycle.
- Manufacturers’ new orders for consumer goods and materials – These goods are primarily used by consumers. The inflation-adjusted value of new orders leads actual production because new orders directly affect the level of both unfilled orders and inventories that firms monitor when making production decisions.
- ISM Index of New Orders – This index reflects the levels of new orders from customers. As a diffusion index, its value reflects the number of participants reporting increased orders during the previous month compared to the number reporting decreased orders, and this series tends to lead the business cycle.
- Manufacturers’ new orders for nondefense capital goods excluding aircraft orders – This index, combing with orders from aircraft (in inflation-adjusted dollars) are the producers’ counterpart to consumer goods and materials.
- Building permits for new private housing units – The number of residential building permits issued is an indicator of construction activity, which typically leads most other types of economic production.
- S&P 500 Index of Stock Prices – The Standard & Poor’s 500 stock index reflects the price movements of a broad selection of common stocks traded on the New York Stock Exchange.
- Leading Credit Index – This index is consisted of six financial indicators: 2-years Swap Spread (real time), LIBOR 3 month less 3 month Treasury-Bill yield spread (real time), Debit balances at margin account at broker dealer (monthly), AAII Investors Sentiment Bullish (%) less Bearish (%) (weekly), and Senior Loan Officers C&I loan survey
- Interest rate spread (10-year Treasury bonds less federal funds rate) – The spread or difference between long and short rates is often called the yield curve.
- Average consumer expectations for business condition – This index reflects changes in consumer attitudes concerning future economic conditions.
IMPORTANT DISCLOSURES
The views and opinions included in these materials belong to their author and do not necessarily reflect the views and opinions of NewEdge Capital Group, LLC.
This information is general in nature and has been prepared solely for informational and educational purposes and does not constitute an offer or a recommendation to buy or sell any particular security or to adopt any specific investment strategy.
NewEdge and its affiliates do not render advice on legal, tax and/or tax accounting matters. You should consult your personal tax and/or legal advisor to learn about any potential tax or other implications that may result from acting on a particular recommendation.
The trademarks and service marks contained herein are the property of their respective owners. Unless otherwise specifically indicated, all information with respect to any third party not affiliated with NewEdge has been provided by, and is the sole responsibility of, such third party and has not been independently verified by NewEdge, its affiliates or any other independent third party. No representation is given with respect to its accuracy or completeness, and such information and opinions may change without notice.
Investing involves risk, including possible loss of principal. Past performance is no guarantee of future results.
Any forward-looking statements or forecasts are based on assumptions and actual results are expected to vary from any such statements or forecasts. No assurance can be given that investment objectives or target returns will be achieved. Future returns may be higher or lower than the estimates presented herein.
An investment cannot be made directly in an index. Indices are unmanaged and have no fees or expenses. You can obtain information about many indices online at a variety of sources including: https://www.sec.gov/fast-answers/answersindiceshtm.html or http://www.nasdaq.com/reference/index-descriptions.aspx.
All data is subject to change without notice.
© 2024 NewEdge Capital Group, LLC


