

Weekly Summary: March 13 – March 17
Key Observations:
- The banking crisis continued this week in the U.S. Many European banks also came under pressure. First Republic Bank (FRC) stock price continued to drop on Friday even after many large banks injected liquidity into FRC. As we stated in last week’s commentary, confidence is “required” for financial institutions to function properly. Confidence appears to be slipping away from some regional banks as many deposits have migrated to larger banks. Lack of liquidity seems to be an increasing concern as many banks borrow from Federal Reserve (Fed) facilities.
- At next week’s Fed meeting, the Fed will try to balance immediate financial stability concerns against inflation concerns. This week, the European Central Bank (ECB) chose to focus on reining in inflation as it hiked its key policy rate by 50 basis points (bps). The ECB gave no further guidance, as it indicated that further hikes would be likely. The ECB also said it would be data dependent in determining its future monetary policies. At present, given the ECB’s actions and their explanations for its actions, we now believe that the Fed will most likely hike the federal funds rate by 25 bps next week.
- We discussed the Fed’s dot plot in last week’s commentary. The dot plot shows each of the Federal Open Market Committee’s (FOMC) participants indication of what they perceive to be the appropriate “terminal” federal funds rate. Powell recently indicated that he expected a higher dot plot. But that was before the latest banking crisis. Financial markets are pricing in much lower terminal rates versus those that were projected pre-financial stability concerns. To what extent will the Fed follow the financial markets’ pricing of the federal funds rate. Will the Fed pause or rein in its quantitative tightening program (QT), which is meant to reduce its balance sheet and which would further reduce liquidity?
- Powell indicated recently that the Fed is data dependent in determining its monetary policies. The latest financial stability concerns make it more difficult to discern the meaning of data dependency. Will the Fed merely analyze the “hard” data that it can actually see and scrutinize? Or will it try to project the economic consequences of a generally more circumspect U.S. banking system? In our opinion, we can envision a more cautious banking sector leading to slower economic growth and slower rates of wage growth and lower inflation rates. We trust that in such an environment, the Fed could be less aggressive in its tightening policies.
The Upshot: Our general investment approach remains the same as depicted in last week’s commentary. We maintain our preference for quality stocks with good balance sheets, relatively stable cash flows with stable margins. Volatility across sectors continues to be supportive of a diversified global portfolio for long term investors. We expect volatility to continue across asset classes.
We continue to stress that stock selectivity in this current environment is of paramount importance. In last week’s commentary we explained why we thought that quality growth stocks have outperformed dramatically this year and have continued to outperform this week as well. Many of our preferred securities have been part of this outperformance. We have not been surprised that many of these stocks have commanded a premium valuation.
Financial stability concerns could lead to a slowing economy and lower rates of inflation. To the extent that the U.S. economy slows sufficiently. Credit issues could be expected to lead to loan losses at many banks as well as an increase in credit spreads. The better capitalized banks should be expected to better “navigate” in such an environment.
Feds Come to the Rescue
Fed chair Powell has often referred to the Fed’s dual mandate of conducting monetary policy “so as to promote effectively the goals of maximum employment [and] stable prices.” Powell has indicated that we are most likely past full employment. As a consequence of these circumstances, the Fed’s focus has been on trying to get inflation down to a 2% rate. The minutes of many FOMC meetings have expressed concerns over possible situations that could lead to “financial instability” in financial markets. In this context, the Fed has noted the relative illiquidity in the Treasury markets, as well as in commodity markets that have been often very volatile. Last week’s commentary highlighted the extreme volatility in interest rates due to “funding” issues at some regional U.S. banks. We chose to focus on Silicon Valley Bank (SVB). SVB’s customer deposit base was very concentrated with venture capitalists, and had many accounts of over the $250,000 limit insured by the Federal Deposit Insurance Corporation (FDIC). SVB also had bought many long-duration instruments that were deemed to be “held to maturity.“ These designated securities then would not have to be marked down as interest rates rose and their value diminished. Once deposits started to be withdrawn at a precipitous rate, the designated securities had to be sold at a loss to cover the “funding” outflows, and SVB was soon closed. Signature Bank suffered a similar fate quickly thereafter. Both of these banks were taken then into FDIC receivership. Fearing deposit outflows from those with over $250,000 in deposits, Federal authorities acted quickly. On Sunday, March 12, the Treasury, the Fed and FDIC announced that all depositors at those two banks would be fully protected. This action was predicated on the “systemic risk” exception. It was believed that financial instability might have occurred with a precipitous outflow of deposits. Government officials then strongly implied that all deposits would be covered 100%. This was deemed to be an “implicit” guarantee. But only an act of Congress could raise the limit of the amount of deposits that would be protected. In spite of these “guarantees,” many deposits were moved from some regional banks to some large money center banks.
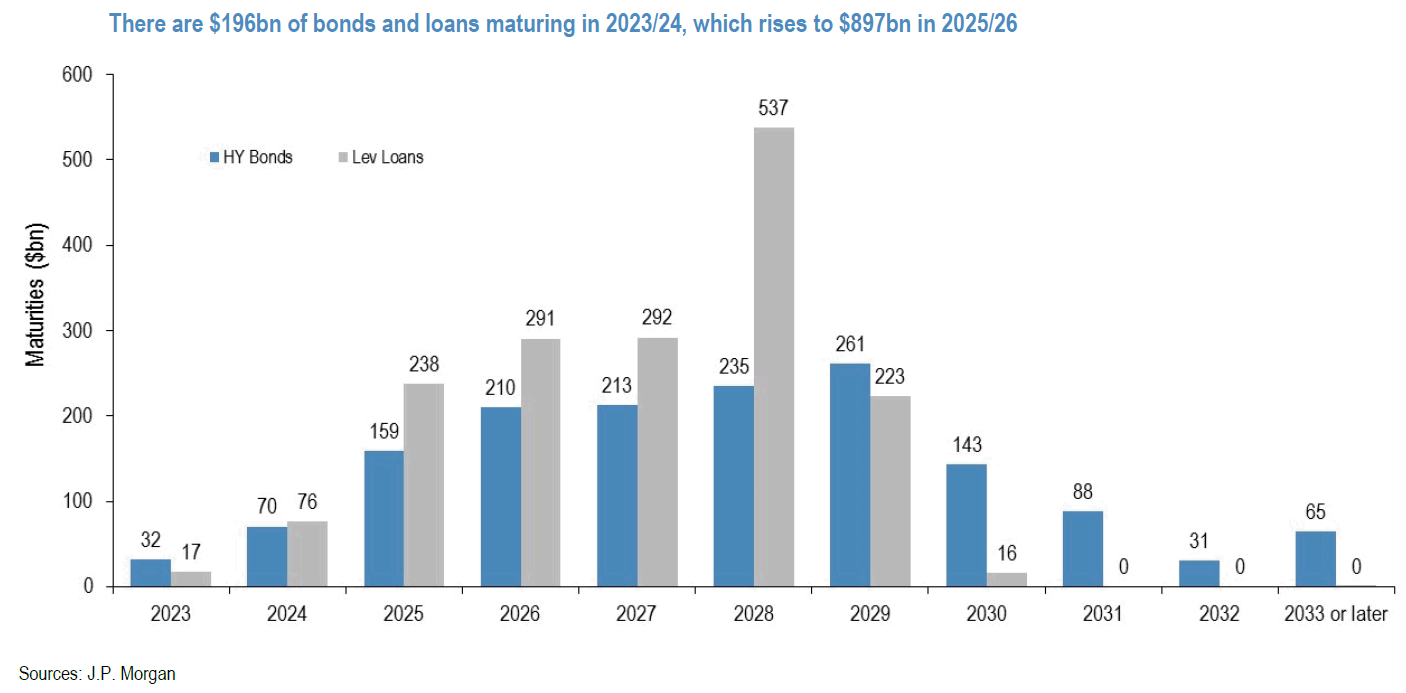
Source: JP Morgan, Crisis Watch Redux: A Series of Unfortunate Events (3-16-2023)
New Funding Facility Created for Banks — Many Banks Increase Liquidity
In response to this banking crisis, the Fed and Treasury also created a new Bank Term Funding Program (BTFP). The BTFP allows banks to tender government collateral – ”eligible collateral,” such as Treasuries and agency backed mortgage backed securities (MBS) – in exchange for a one-year loan at “par”, even if their market value was less than par. This facility was backstopped originally with $25 billion from the Treasury’s Exchange Stabilization Fund (ESF). According to Bloomberg News on March 16, $11.9 billion in borrowing already occurred in less than one week since inception. These steps were taken also to increase confidence in the U.S. financial system. As we stated in last week’s commentary, confidence is “required” for financial institutions to function. Data published by the Fed showed an additional $152.85 billion in borrowing from the Fed’s discount window for the week ended March 15. This is the more traditional way that banks can access additional capital from the Fed. This amount compares to the total of $4.58 billion the previous week and exceeded the previous record of $111 billion during the 2008 financial crisis. We take these borrowings as an indication that the U.S. banking system remains in “turmoil.”
San Francisco-based First Republic Bank (FRC) came under increased pressure this week after S&P Global and Fitch Ratings downgraded FRC’s credit rating. As of December 31, FRC was the fourteenth largest U.S. bank with $212 billion in assets and $176.4 billion in deposits. As of December 31, approximately 68% of deposits were above the FDIC-insured limit. In its downgrade, S&P Global stated: “We believe the risk of deposit outflows is elevated … despite the actions of federal banking regulators and the bank actively increasing its borrowing availability to mitigate risk associated with the bank failures over the last week.” Led by J.P. Morgan and Bank of America, eleven of the largest U.S. banks deposited on Thursday a total of $30 billion with FRC. Powell, Treasury Secretary Janet Yellen, and two other regulators jointly stated that “this show of support by a group of large banks … demonstrates the resilience of the banking system.”
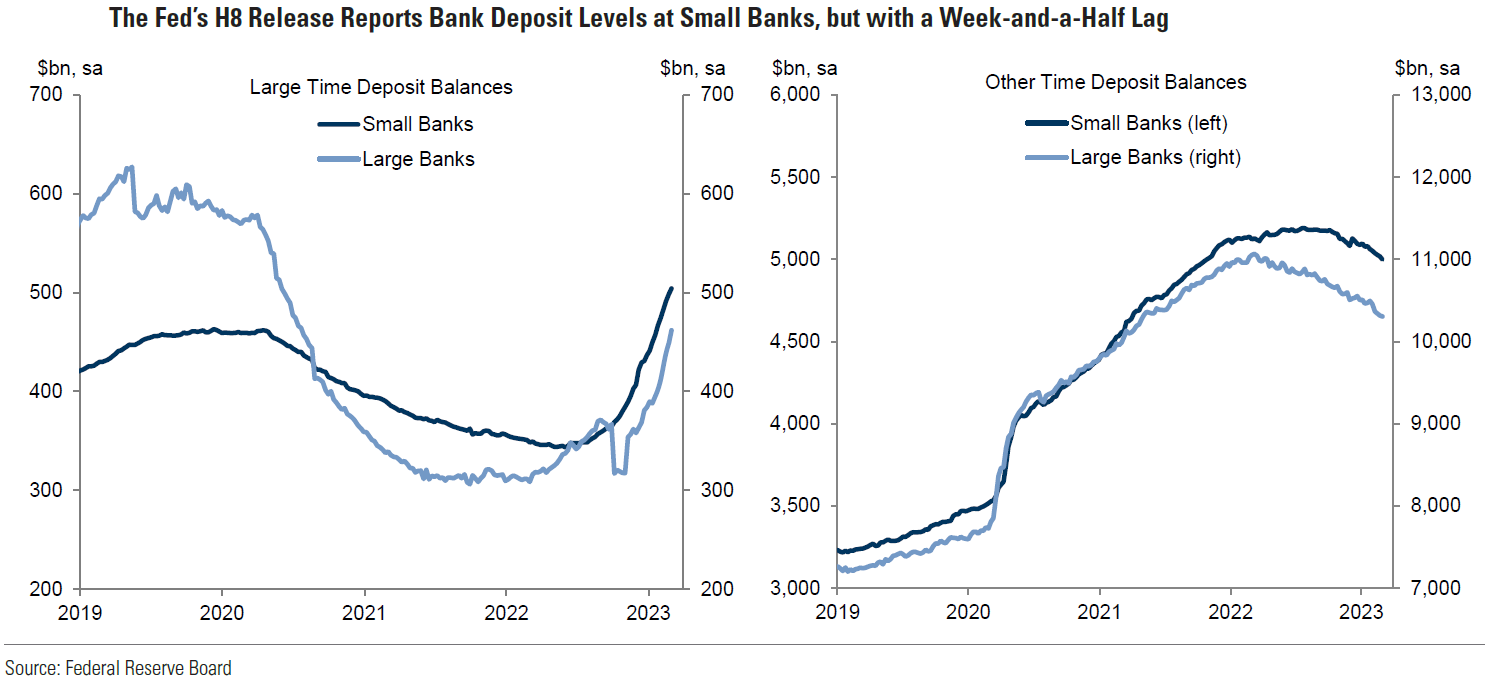
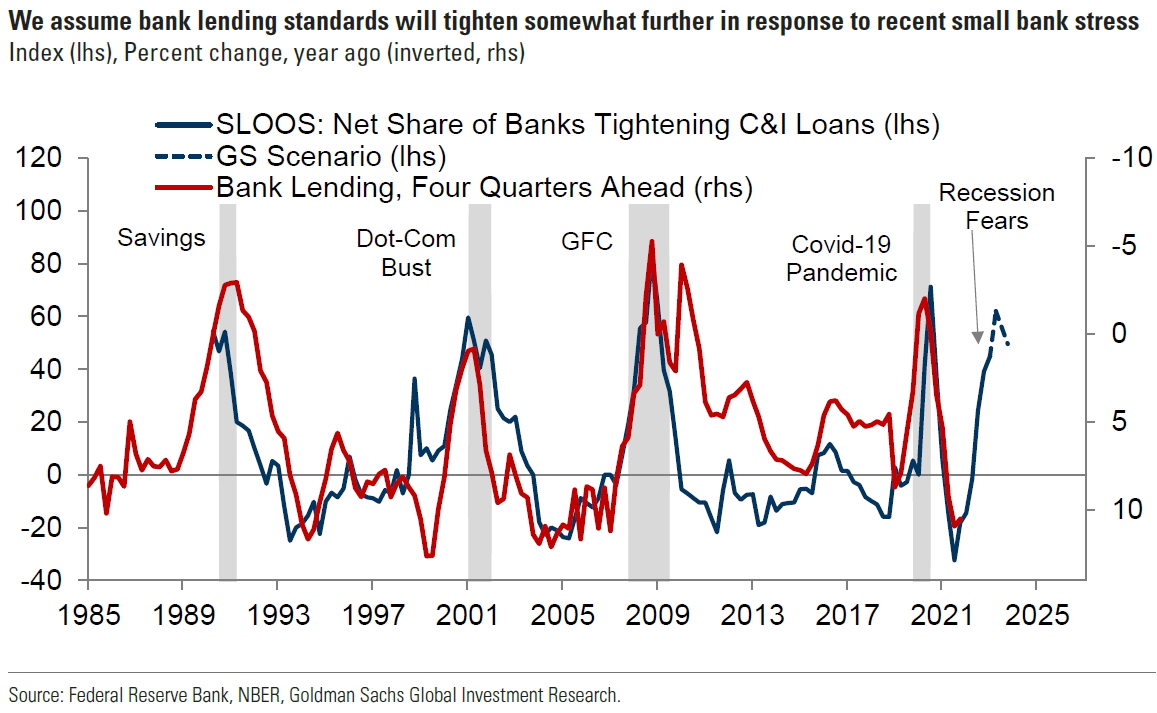
Source: Goldman Sachs, US Daily: How to Monitor Small Bank Stress and Its Spillover Effects (Mericle / Viswanathan / Yaro) (3-16-2023)
Credit Suisse Exposes European Bank Issues
Credit Suisse (CS) showed this week that financial stability concerns were evident in Europe as well. The chairman of Saudi National Bank (SNB), which is the largest shareholder of CS, stated on Wednesday that he would provide no more “assistance” to CS. Among the reasons given was that going over the 10% threshold in CS stock would subject SNB to more regulatory burdens. This precipitated a dramatic selloff in many European banks on Wednesday. On Thursday, Swiss National Bank offered as much as 50 billion francs ($54 billion) from its liquidity facility. Counter party risks with CS was a concern of many banks. According to Bloomberg News on Thursday, European Central Bank (ECB) representatives commented that some European banks could be “vulnerable” to monetary policy tightening. The ECB then hiked its key policy rate – deposit rate – by 50 basis points (bps) to 3.0%.
Tipping Point for Some Banks?
As many major central banks (CBs) have pursued tighter monetary policies, concerns of financial stability have increased. The question regarding at what level a “tipping” point would occur remained. A tipping point could vary by industry, geography, etc. It appears that we have reached a tipping point for many financial institutions as they could not adapt quickly enough to the unprecedented quickness of interest rate hikes. The task of CBs has now become more difficult and uncertain. Financial stability has become the most immediate concern. Should the fight against inflation continue unabated? To what extent should tighter monetary policies be put on hold or modified? To what extent will a more circumspect banking sector further tighten its lending standards and thereby slow economic growth that would presumably slow inflation eventually? The Fed insists it is now more data dependent. To what extent will this new data be incorporated into the Fed’s thinking. We assume that many U.S. regional banks will be impacted the most by a loss of confidence in financial institutions. Many smaller companies get most of their funding from regional banks. Employment statistics indicate that most jobs are created by smaller and medium sized companies. These circumstances could lead to a slowing U.S. economy and less demand for labor. That in turn should lead to a slower growth in wages, which is a principal objective of the Fed.
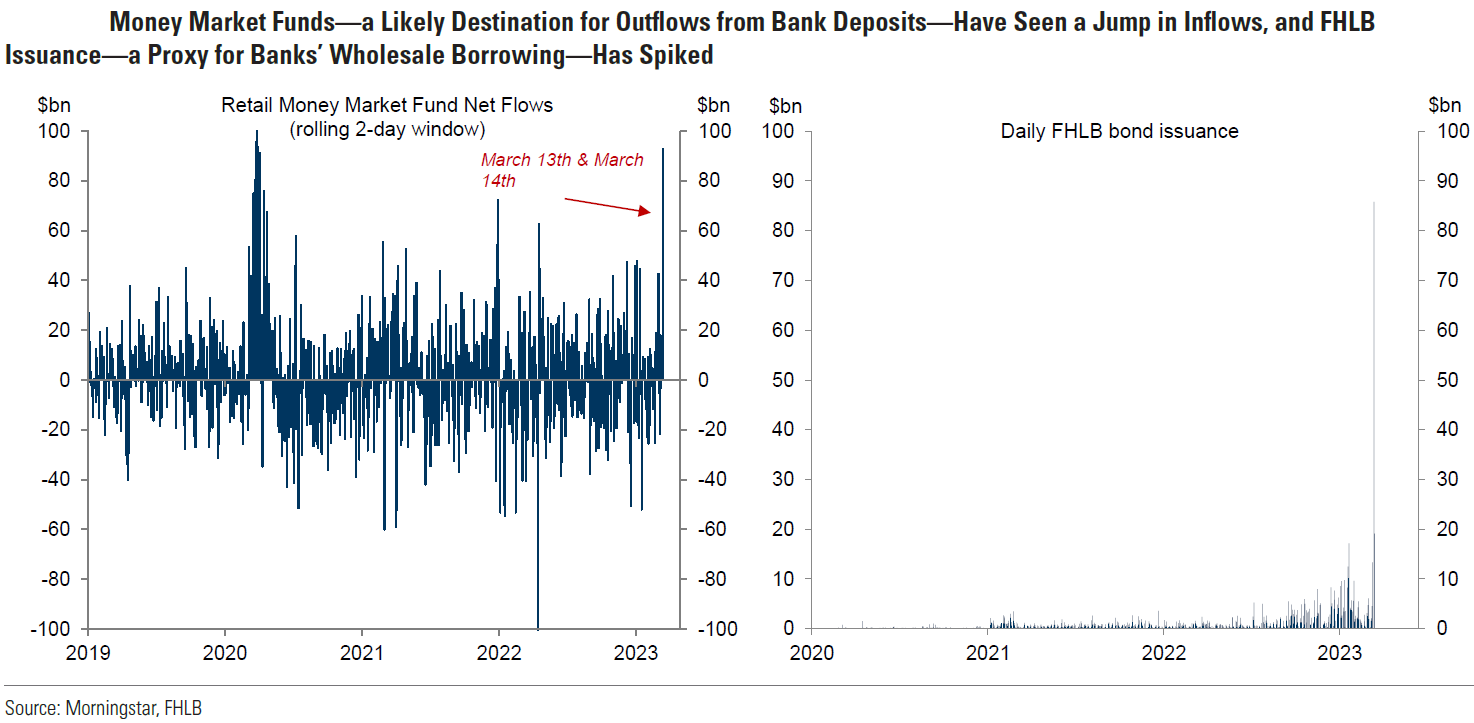
Source: Goldman Sachs, What’s Top of Mind in Macro Research: All about bank stresses (3-15-2023)
Balancing Inflation and Financial Stability Risks – “Karma Chameleon”
The Fed will have a difficult task in balancing the risks of tighter monetary policy to rein in inflation against the risk of financial instability. To what extent are these objectives compatible? To what extent will the Fed become a chameleon? To what extent will this change the Fed’s “karma?” Due to increased uncertainties, we surmise that some of these sentiments expressed in Culture Club’s song “Karma Chameleon,” could be applicable to both the Fed and investors. The added layer of concerns on the fragility of banking systems, means that “every day is like survival … I’m a [person] without conviction; I’m a [person] who doesn’t know; How to sell a contradiction; You come and go, you come and go.”
Uncertainty of Central Banks Future Monetary Policies
Ever since the onset of financial stability concerns surfaced on Thursday last week, financial markets have been pricing in many different scenarios. Before Thursday, the probabilities of a 25 or 50 bps Fed hike on March 22 were more or less probable. Beginning last Thursday, the probabilities were only about whether it would be a 25 bps hike in the federal funds rate or none at all. The terminal rate level was slashed as well. Interest rate cuts were priced in as much more likely this year. Opinions varied widely. Goldman Sachs (Goldman) thought that the Fed would “pause” on March 22 and then resume 25-bps hikes. Goldman also raised the odds of a recession over the next twelve months from a 25% to a 35% probability. JPM thought that a 25-bps hike was still most likely on March 22 and that the U.S. would experience a recession year. The banking “crisis” also precipitated extreme sings in Treasury yields – especially the two-year Treasury yield – and extreme fluctuations in the inversion magnitude of the two-to 10-year Treasury yield curve. Last Wednesday, the inversion was over 108 bps and at one point this week traded under 40 bps. The Merrill Lynch Option Volatility Estimate Index (MOVE Index), which is a measure of Treasury interest rate volatility, closed at a multi-year high on Wednesday at 198.71. Since roughly the last third of February, The MOVE index volatility has far surpassed the VIX. The VIX is a measure of the expected volatility of the S&P 500 over the next thirty days.
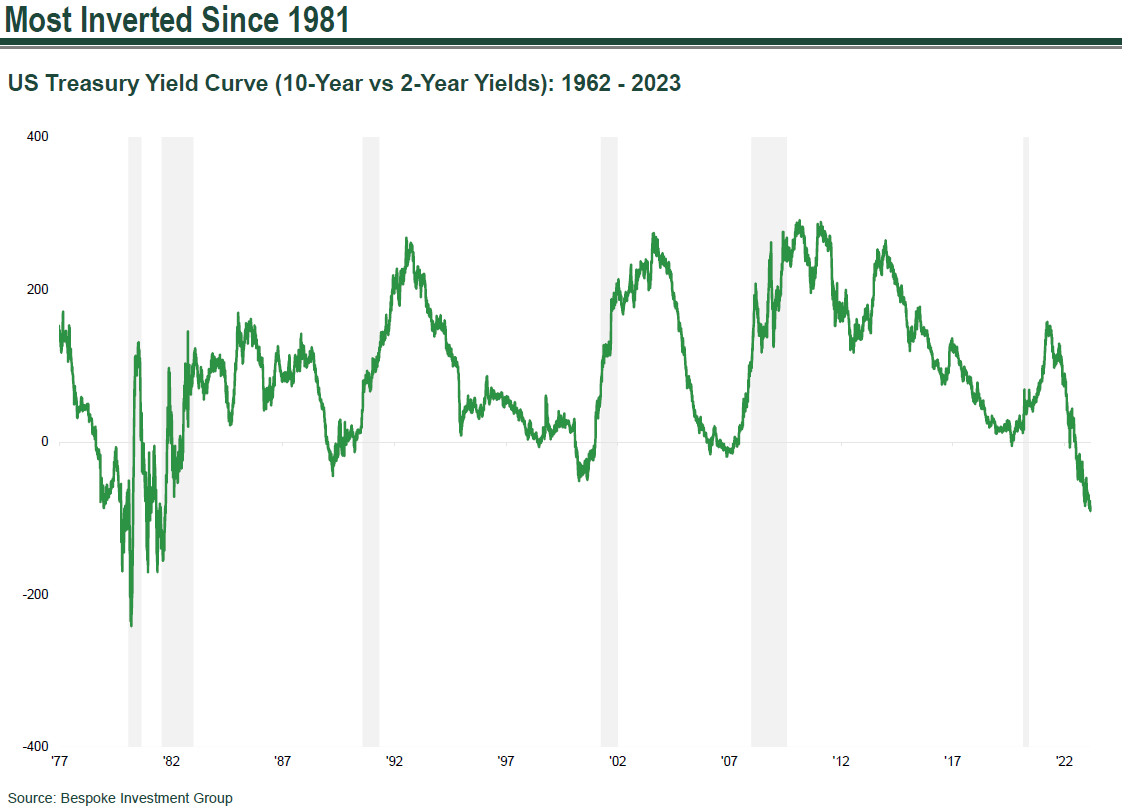
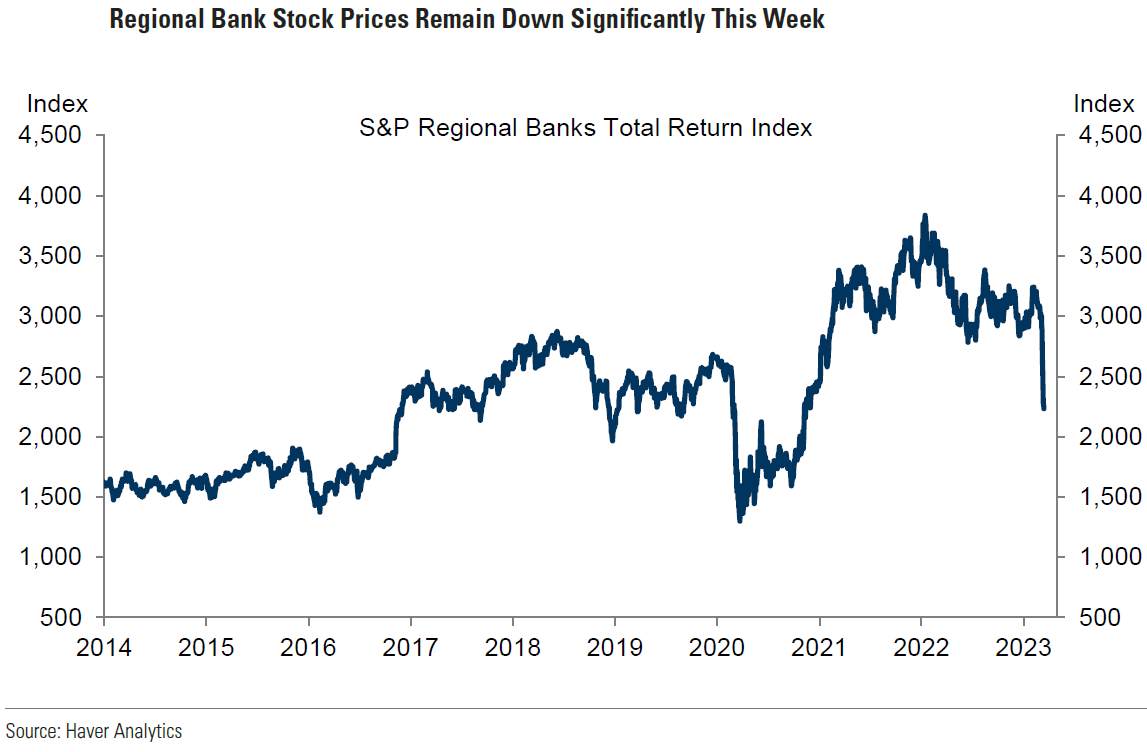
Source: Bespoke Investment Group, Most Inverted Since 1981 (March 2023)
ECB Hikes Key Policy Rate by 50 bps as Originally Planned
The probabilities of how much the ECB would hike its key deposit rate this Thursday also showed wide swings by financial markets. Prior to last Thursday, a 50-bps hike was all but a certainty. A 25-bps hike became a rather high probability as well. Finally, as originally promised, the ECB hiked its key deposit rate 50 bps to 3.0% on Thursday. According to Bloomberg News, The ECB stuck to its original plan due to a fear that anything less than a 50-bps hike might “panic” investors. But the ECB suspended any further forecasts of rate hikes and said it would be “data dependent.” The ECB still believed that further rate hikes were likely in spite of increased financial market volatility. It believed that the risk of banking sector “contagion” appeared limited, that core inflation would remain robust, and that it had the “tools” necessary to deal with both inflation and financial stability concerns. The ECB revised lower its headline inflation forecasts to an average inflation rate of 5.3% for 2023 and a 2.9% average for 2024. This compared to its December forecasts of 6.3% and 3.4%, respectively. Core inflation forecasts were revised higher for 2023 from 4.2% to 4.6%, but revised lower for 2024 from 2.8% to 2.5%. Barring any further detrimental news in the banking sector, we assume that the ECB actions and explanations make it more likely that the Fed will hike the federal funds rate by 25 bps at its next meeting and not pause.
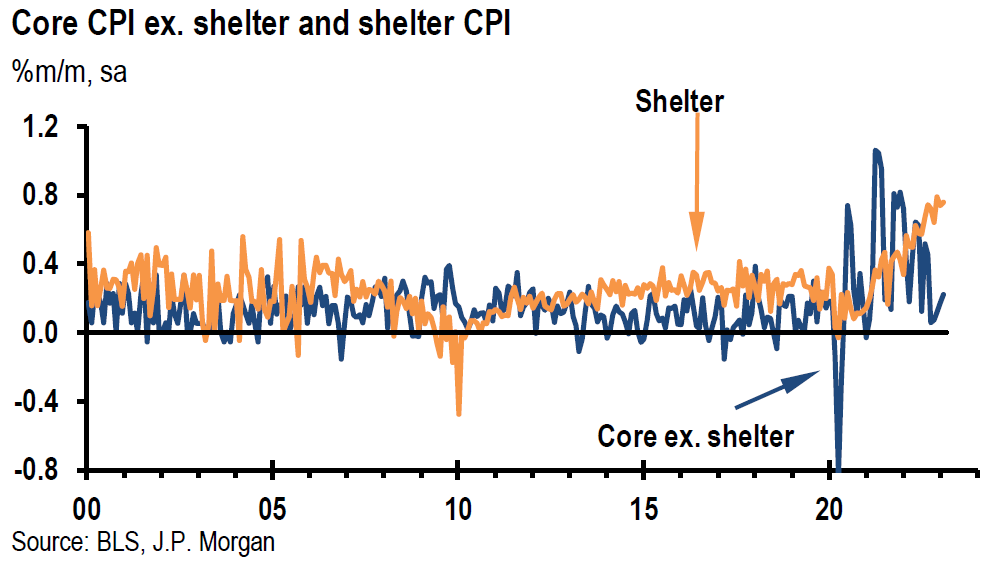
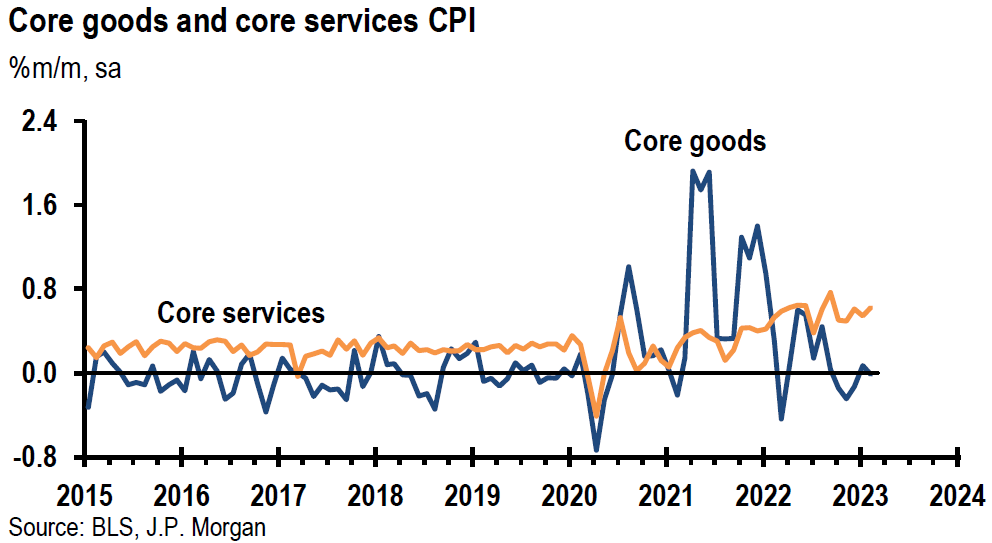
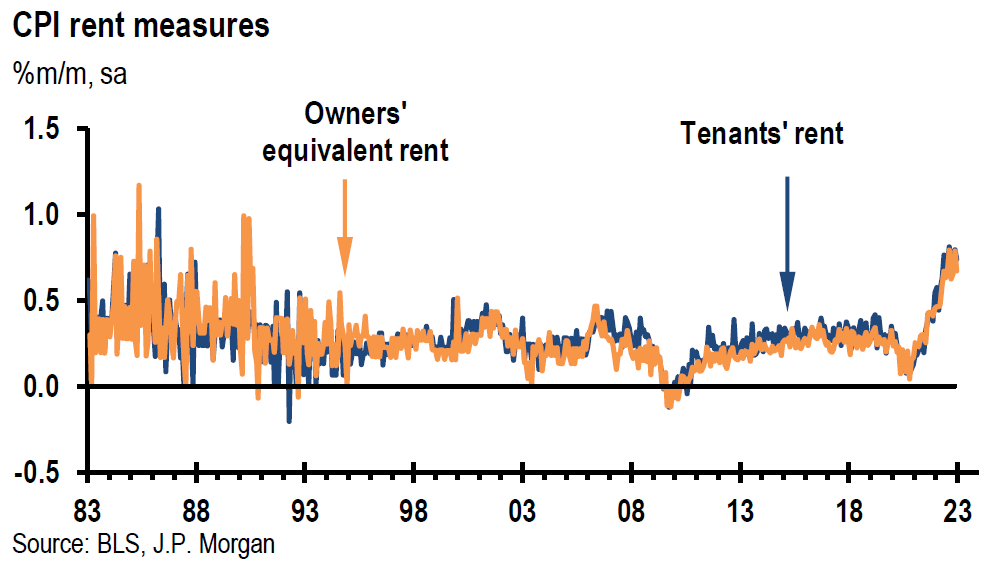
U.S. February CPI — as Expected Generally
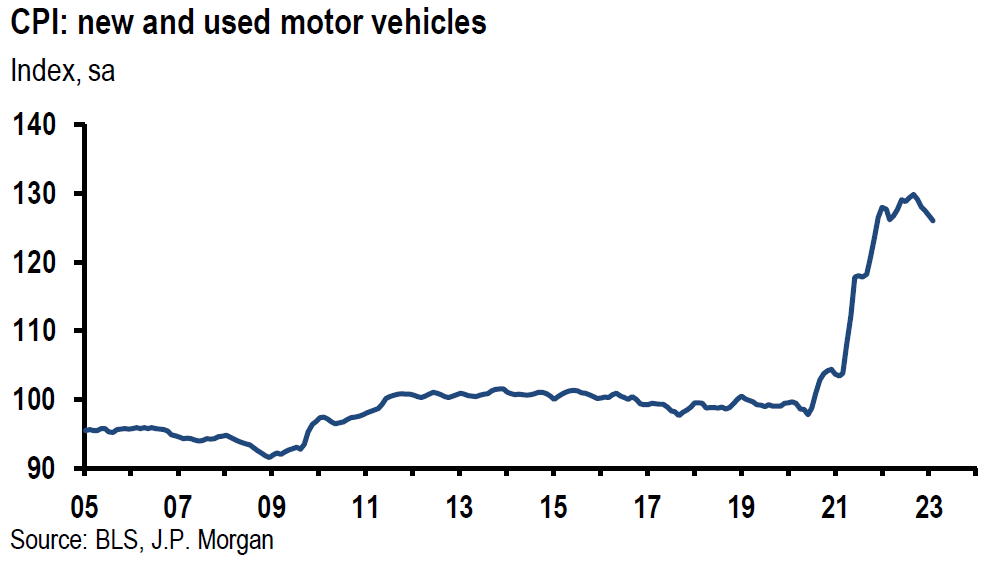
We will next examine some of the most relevant economic data we analyzed this week to help us discern the appropriateness of the Fed increasing the federal funds rate at its next meeting. Perhaps the most anticipated data point was the U.S. consumer price index (CPI) for February, released on Tuesday. Headline CPI rose by 0.4% month-over-month (m/m) and by 6.0% year-over-year (y/y). The y/y increase slowed from January’s 6.4% y/y increase. This was the eighth consecutive month that the y/y headline inflation rate slowed and was the lowest since September 2021. The index for shelter accounted for over 70% of the headline m/m gain. A 0.6% m/m decrease in energy costs helped contain headline inflation. Core CPI was 0.5% higher m/m and 5.5% higher y/y. The core y/y gain was the smallest since December 2021. The only data point above expectations was the m/m core gain that was expected to increase 0.4% m/m. The core monthly gain was pushed above expectations mainly by a 6.4% m/m increase in airfares and by unexpected gains in shelter costs. The core m/m increase was the most since last September. Rent increased 0.76%, above January’s gain of 0.74% and owners equivalent rent (OER) was 0.70% higher, above a 0.67% gain in January. Due to more up-to-date shelter costs that show a clearly decelerating trend, we and the Fed anticipate a slowing in these components of the CPI as well. Core services prices excluding rent and OER, also rose 0.5% m/m – 0.17% above the prior three-month average. Prices for used cars and trucks continued to decline. But given the recent increases in the Manheim used vehicle price index that we have highlighted in recent commentaries, we expect higher prices for used vehicle prices to be reflected in the CPI in the months ahead. According to a CME group estimate, after the CPI report, traders priced in an 85% chance of a 25 bps hike at the Fed’s next meeting. Probabilities continued to fluctuate daily.
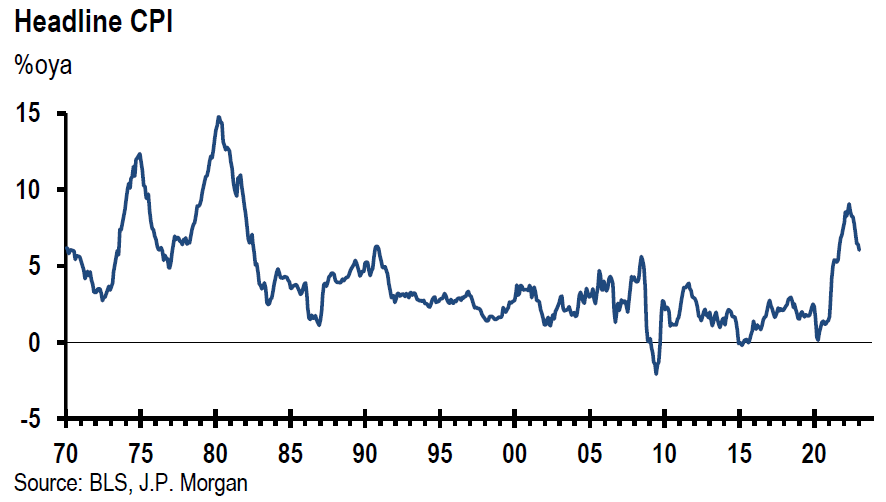
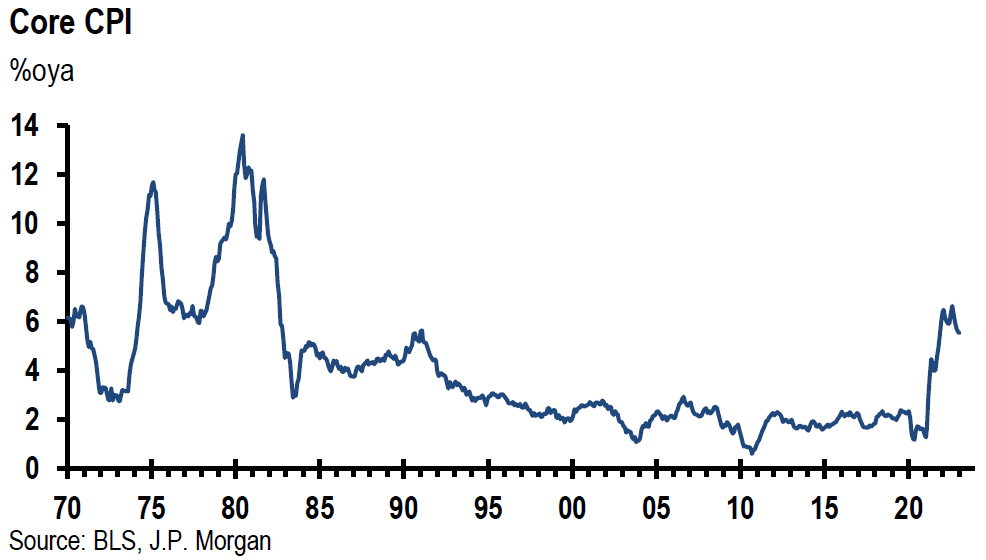
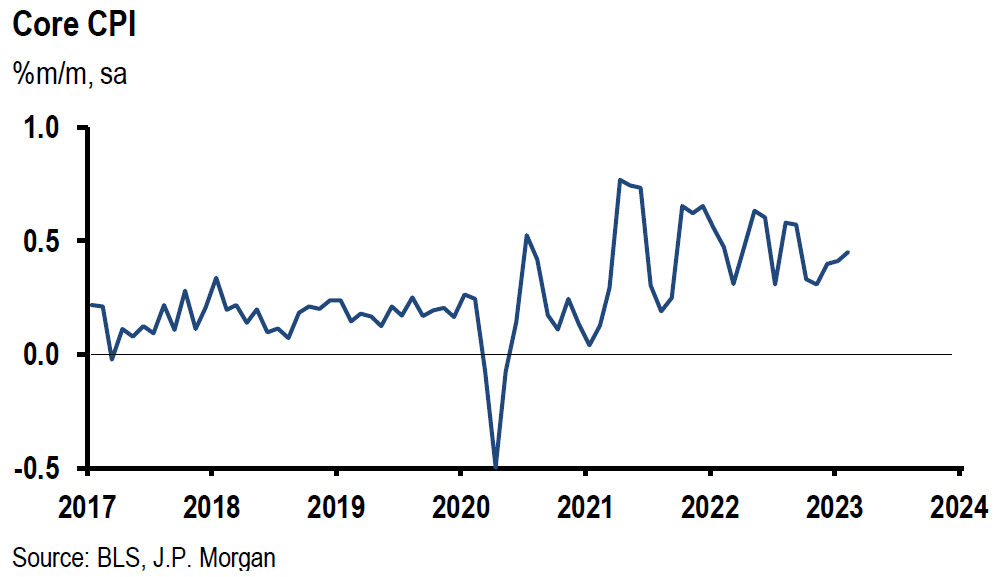
Source: JP Morgan, US: CPI firmness carries over into February (3-14-2023)
U.S. February PPI – Less than Expected
The producer price index (PPI) was 0.1% lower m/m versus an expected increase of 0.3%. The expected increase matched January’s gain that followed a 0.2% m/m decrease in December. PPI was 4.6% higher y/y versus an expected gain of 5.4% and compared to January’s increase of 5.7%. Excluding food, energy and trade, PPI rose 0.2% m/m after a 0.5% gain in January and was 4.4% higher y/y in both February and January. A 0.2% m/m decline in goods prices contributed to February’s deceleration. Most of the drop in goods prices (over 80%) was attributable to a 36.1% m/m plunge in egg prices that had greatly appreciated over the past year. The annual gain of 4.6% in PPI was the lowest since March 2021. Services were lower by 0.8% m/m, but excluding trade, transport and warehousing, showed a 0.3% m/m increase.
U.S. February Retail Sales Lower as Expected but “Control Group” Retail Sales Higher
Headline retail sales were 0.4% lower m/m as expected and increased 5.4% y/y. Excluding autos, retail sales were 0.1% lower m/m and excluding autos and gasoline sales, retail sales were flat. January retail sales were revised up to a monthly gain of 3.2% from the previous estimate of 3.0%. January’s monthly gain in retail sales was the highest since March 2021. Core retail sales rose by 0.5% m/m versus an expected gain of 0.3%. Core retail sales are those of the retail control group. These retail sales exclude receipts from auto dealers, building materials, gas stations, office supply stores, mobile homes and tobacco stores. This “filtered” number is considered a more precise depiction of consumer spending. After the release of February’s retail data, Goldman increased its estimate of Q1 GDP growth to 2.6% from 2.0%. JPM increased their estimate to 2.5% from 2.0%.
Somewhat Encouraging Housing Data
The National Association Home Builders (NAHB) Housing Market Index increased for the third consecutive month in March. The 44 reading was the highest since last September and exceeded expectations of 40. The gauge for current sales conditions rose to 49 from an upwardly revised 47 and traffic of prospective buyers increased by three points to 31, a six-month high. But sales expectations for the next six months fell by one point to 47. “While financial system stress has recently reduced long term interest rates, which will help housing demand in coming weeks, cost and availability of housing inventory remains a critical constraint for prospective home buyers.”
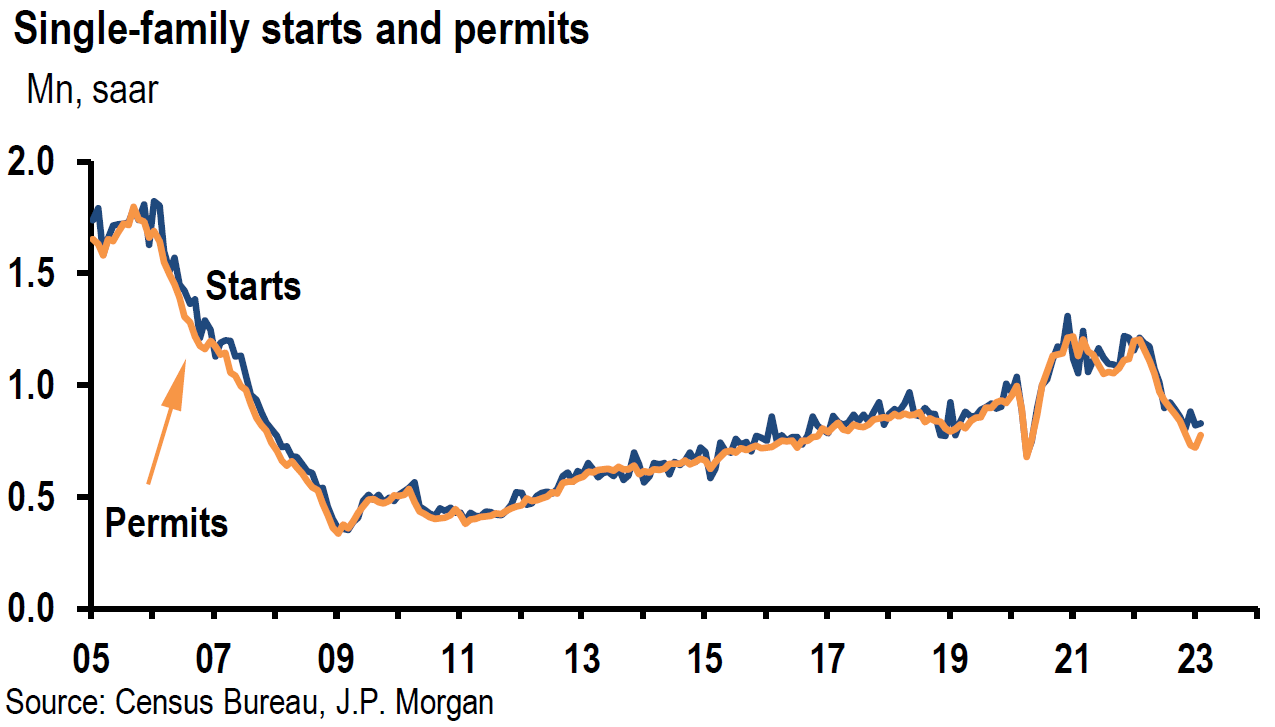
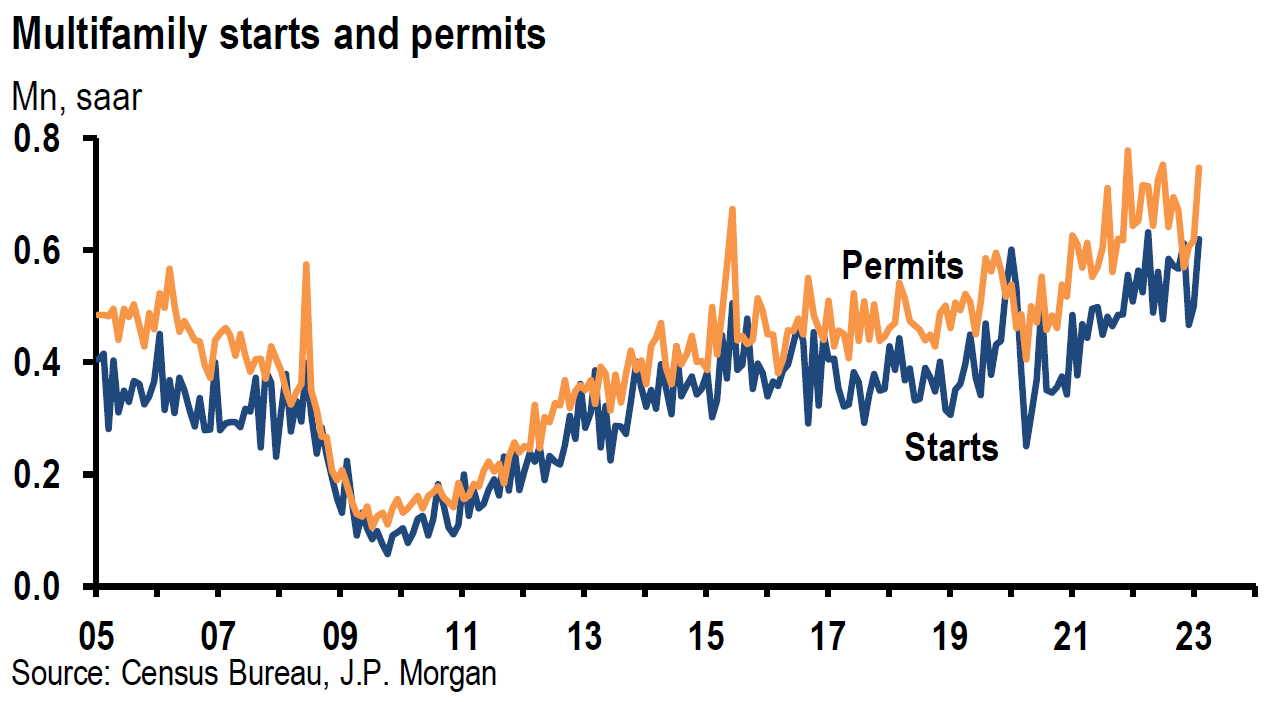
U.S. housing starts jumped 9.8% m/m in February. Most of this increase was attributable to multifamily units, 5 units or more. Single family starts were 1.1% higher m/m. Single family housing permits were more encouraging as they rose 7.6% m/m. Overall permits increased 12.8%.
According to Mortgage Bankers Association on March 15, mortgage applications to purchase a home increased 7.0% week-over-week (w/w) and were 38% lower y/y. This was the second consecutive week of increased mortgage demand to purchase a home. The average 30-year fixed rate mortgage last week dropped to 6.71% from the prior week’s level of 6.79%. These mortgage rates loosely track the 10-year Treasury yield and could be expected to trend lower given the general recent downturn in the 10-year Treasury yield. But given the recent turmoil in the banking industry, and in particular regional banks, we suspect that mortgages could become harder to obtain. Many of the larger banks have been withdrawing from providing mortgages.
Source: JP Morgan, US: Mixed news in 8:30 data releases (3-16-2023)
University of Michigan Consumer Sentiment and Inflation Expectations – Preliminary March Results
Consumer sentiment dropped for the first time in four months to 63.4 from 67 in February, which was also the expected level. The current conditions reading decreased to 66.4 from February’s 70.7 level and expectations fell to 61.5 from 64.7. Before the failure of SVB 85% of the interviews for this survey had been completed. One year ahead inflation expectations fell from 4.1% in February to a preliminary reading of 3.8%. This was the lowest reading since April 2021. The five-year inflation outlook receded to 2.8%. This was only the second tome in 20 months that the 2.9% to 3.1% range was breached to the downside.
New York Fed Survey Shows Year Ahead Inflation Expectations Fall
The New York Fed’s national online February survey showed a surprising drop in one year inflation expectations to 4.2% versus the prior month’s reading of 5.0%. Three-year inflation expectations remained at 2.7%, while five-year inflation expectations rose slightly from 2.5% to 2.6%. We were very encouraged by the one year ahead inflation expectations from both surveys. Inflation expectations have been shown to affect actual inflation rates. We expect the recent banking turmoil to reduce further both consumer confidence and inflation expectations.
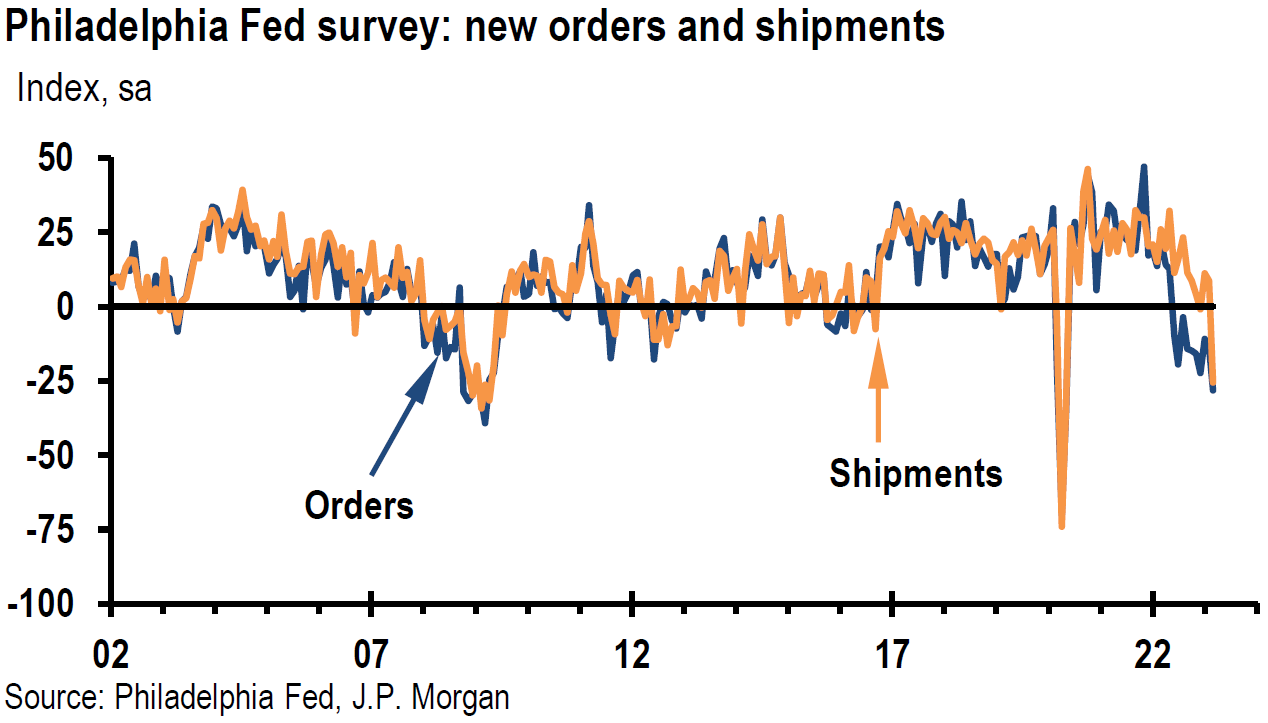
Regional Federal Banks’ Surveys Continue to Show Weakness in General
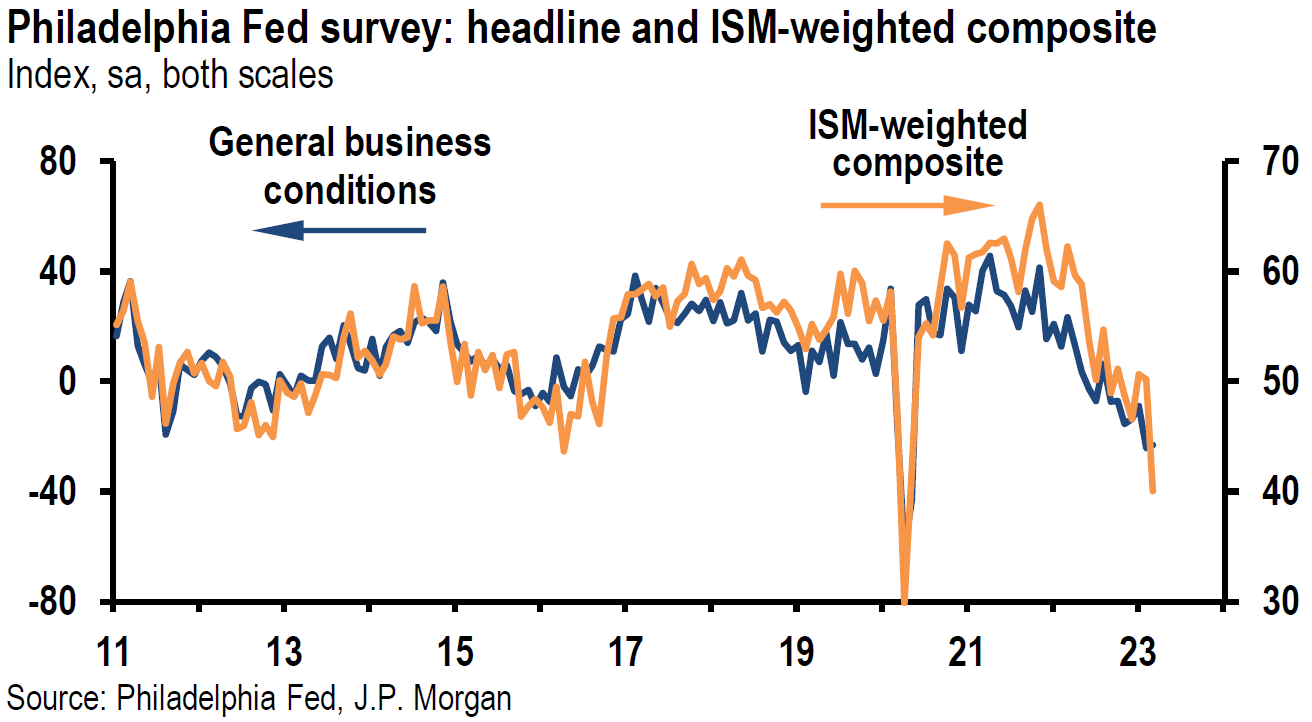
The New York Fed’s Empire State Manufacturing and Business Leaders’ Survey (services industry) both showed weakening trends. The Philadelphia Fed Manufacturing Survey also showed weakening trends.
Source: JP Morgan, US: Mixed news in 8:30 data releases (3-16-2023)
Bottom Line
For the time being we are maintaining our basic investment approach as expressed in last week’s commentary. We continue to prefer high quality stocks that offer good balance sheets, as well as relatively stable cash flows and profit margins. We prefer a very diversified global portfolio for long term investors. We expect volatility to continue across asset classes.
We continue to stress that stock selectivity in this current financial environment is of paramount importance. The volatility this week was emblematic of the “rapidity of change” that has been the hallmark of financial markets since the onset of the pandemic. This has been particularly the case this week in regard to bond market volatility. Changes in financial markets are simply too fast in general to reposition portfolios for long term investors. We are constantly trying to construct a portfolio that could benefit from many types of market environments. Ideally, long term investors should try to take advantage of market volatility by trimming certain positions after large gains and adding to positions on market downturns or when a desired stock is “punished” too severely. Risk-reward is always at the forefront of our analysis.
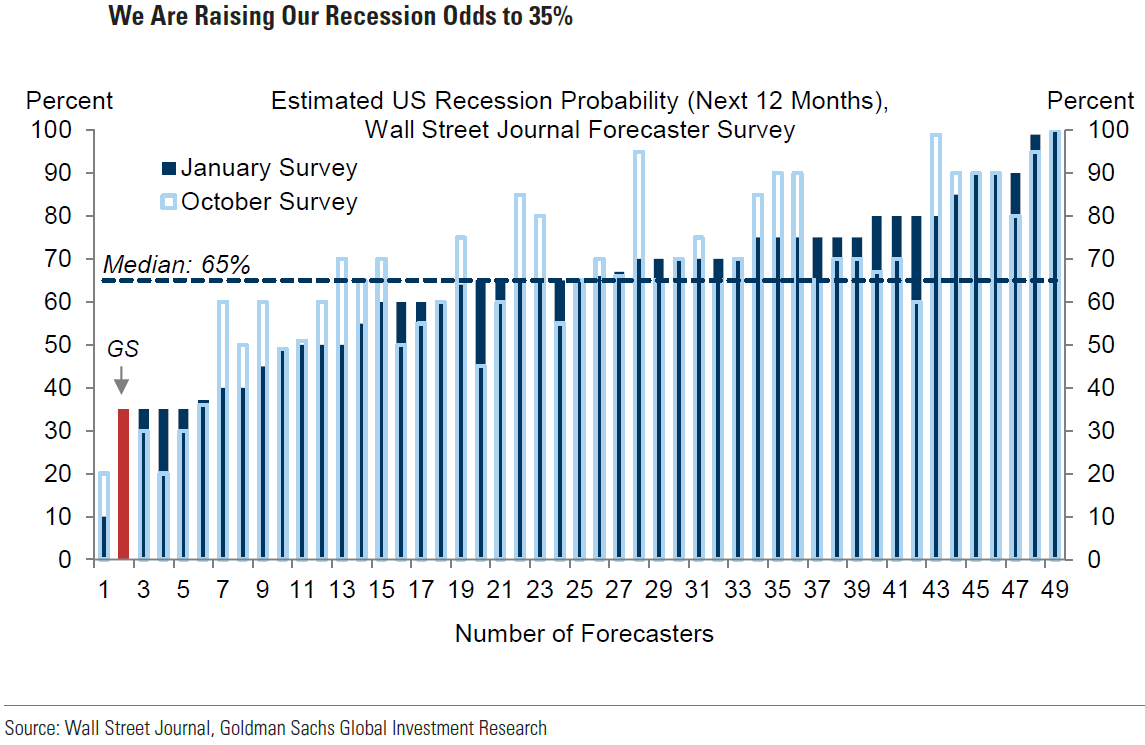
Source: Goldman Sachs, US Daily: March Recession Watch Tracker: Raising Our Recession Odds to 35% (Abecasis) (3-15-2023)
Definitions:
Federal Open Market Committee (FOMC) – The Federal Open Market Committee (FOMC) is the branch of the Federal Reserve System that determines the direction of monetary policy specifically by directing open market operations. The committee is made up of 12 members: the seven members of the Board of Governors; the president of the Federal Reserve Bank of New York; and four of the remaining 11 Reserve Bank presidents on a rotating basis.
Fed Funds Terminal Rate – The terminal rate is defined as the peak spot where the benchmark interest rate, the federal funds rate, will come to rest before the central bank begins trimming it back.
Federal Funds Rate – The term federal funds rate refers to the target interest rate set by the Federal Open Market Committee. This target is the rate at which commercial banks borrow and lend their excess reserves to each other overnight.
Fed Minutes – The Minutes are a detailed record of the Federal Open Market Committee (FOMC) meetings and are released three weeks after every meeting. The minutes offer more concise insights on the monetary policy stances of all members of the committee and how individual members see the value of the USD and other securities.
European Central Bank (ECB) – The European Central Bank (ECB) is the central bank responsible for monetary policy of the European Union (EU) member countries that have adopted the euro currency. This currency union is known as the eurozone and currently includes 19 countries. The ECB’s primary objective is price stability in the euro area.
Fed Dot Plot – The Fed dot plot is published quarterly as a chart showing where each of the 12 members of the FOMC expect the federal funds rate to be for each of the next three years and the long term.
Basis Points (bps) – A basis point is one hundredth of one percent, used chiefly in expressing differences of interest rates.
Inverted Yield Curve – An inverted yield curve describes the unusual drop of yields on longer-term debt below yields on short-term debt of the same credit quality. Sometimes referred to as a negative yield curve, the inverted curve has proven in the past to be a relatively reliable lead indicator of a recession.
Headline Consumer Price Index (Headline CPI) – Headline inflation is the raw inflation figure reported through the Consumer Price Index (CPI) that is released monthly by the Bureau of Labor Statistics (BLS). The CPI calculates the cost to purchase a fixed basket of goods to determine how much inflation is occurring in the broad economy. The CPI uses a base year and indexes the current year’s prices, according to the base year’s values.
Core Consumer Price Index (Core CPI) – Core inflation removes the CPI components that can exhibit large amounts of volatility from month to month, which can cause unwanted distortion to the headline figure. The most commonly removed factors are those relating to the costs of food and energy. Food prices can be affected by factors outside of those attributed to the economy, such as environmental shifts that cause issues in the growth of crops. Energy costs, such as oil production, can be affected by forces outside of traditional supply and demand, such as political dissent.
Producer Price Index (PPI) – The producer price index (PPI), published by the Bureau of Labor Statistics (BLS), is a group of indexes that calculates and represents the average movement in selling prices from domestic production over time. It is a measure of inflation based on input costs to producers.
Core Producer Price Index (PPI) – The core producer price index (PPI), published by the Bureau of Labor Statistics (BLS), is a group of indexes that calculates and represents the average movement in selling prices from domestic production over time that excludes food and energy prices, which are the more volatile parts of inflation.
Retail Sales – Retail sales represent a key macroeconomic metric that tracks consumer demand for finished goods. It acts as a key economic barometer and whether inflationary pressures exist. Retail sales are measured by durable and non-durable goods purchased over a defined period of time.
S&P 500 – The S&P 500 is a total return index that reflects both changes in the prices of stocks in the S&P 500 Index as well as the reinvestment of the dividend income from its underlying stocks.
The NAHB/Wells Fargo Housing Market Index (HMI) – The NAHB/Wells Fargo Housing Market Index is a monthly sentiment survey of members of the National Association of Home Builders. The index measures sentiment among builders of U.S. single-family homes and is a widely watched gauge of the U.S. housing sector.
Fed Senior Loan Officer Opinion Survey on Bank Lending Practices (SOSLP) – The Senior Loan Officer Opinion Survey on Bank Lending Practices is a survey the Federal Reserve conducts to gain insight into bank lending practices and conditions.
Federal Home Loan Bank System (FHLB) – The Federal Home Loan Bank System is a consortium of 11 regional banks across the U.S. that provide a reliable stream of cash to other banks and lenders to finance housing, infrastructure, economic development, and other individual and community needs.
IMPORTANT DISCLOSURES
The views and opinions included in these materials belong to their author and do not necessarily reflect the views and opinions of NewEdge Capital Group, LLC.
This information is general in nature and has been prepared solely for informational and educational purposes and does not constitute an offer or a recommendation to buy or sell any particular security or to adopt any specific investment strategy.
NewEdge and its affiliates do not render advice on legal, tax and/or tax accounting matters. You should consult your personal tax and/or legal advisor to learn about any potential tax or other implications that may result from acting on a particular recommendation.
The trademarks and service marks contained herein are the property of their respective owners. Unless otherwise specifically indicated, all information with respect to any third party not affiliated with NewEdge has been provided by, and is the sole responsibility of, such third party and has not been independently verified by NewEdge, its affiliates or any other independent third party. No representation is given with respect to its accuracy or completeness, and such information and opinions may change without notice.
Investing involves risk, including possible loss of principal. Past performance is no guarantee of future results.
Any forward-looking statements or forecasts are based on assumptions and actual results are expected to vary from any such statements or forecasts. No assurance can be given that investment objectives or target returns will be achieved. Future returns may be higher or lower than the estimates presented herein.
An investment cannot be made directly in an index. Indices are unmanaged and have no fees or expenses. You can obtain information about many indices online at a variety of sources including: https://www.sec.gov/fast-answers/answersindiceshtm.html or http://www.nasdaq.com/reference/index-descriptions.aspx.
All data is subject to change without notice.
© 2024 NewEdge Capital Group, LLC


