

Weekly Summary: June 6 – June 10, 2022
Key Observations:
- The recent aggressive tightening of their monetary policies by many major central banks (CBs), along with their updated forecasts of higher rates of inflation and lower economic growth rates, leads us to conclude that many believe an economic “hurricane” might be fast approaching. The more prudent CBs apparently want to prepare so they avoid “gettin’ blown away.” Many renowned global institutions also have revised very recently their forecasts in a similar manner.
- Recent spending patterns and increases in certain types of borrowing could be a harbinger that the U.S. consumer is not as robust as many analysts assume. Many analysts continue to emphasize the approximate $2 trillion in “excess savings” accumulated by U.S. consumers during the pandemic. However, many surveys highlighted in our previous commentaries have shown a waning of consumer confidence.
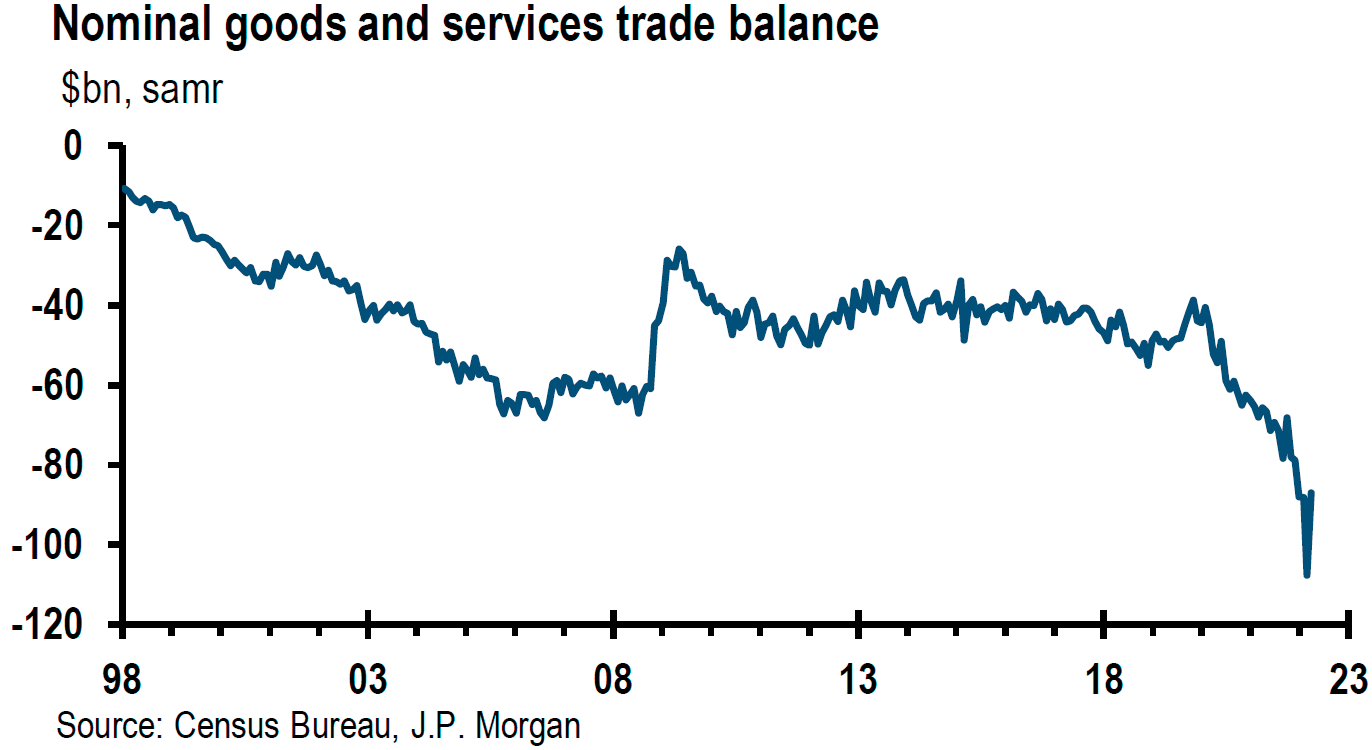
- Fluctuating U.S. trade deficits have been driven recently in most part by fluctuating imports, as U.S. exports have grown in a steadier pattern. We deduce that perhaps at least some of the import fluctuations have been due to COVID-19 related shutdowns in China that hampered the production of many Chinese goods. Due to the manner in which U.S. GDP growth is calculated, fewer U.S. imports means there will be less of a deduction to U.S. GDP estimates.
- We understand that the more aggressive posture of many CBs will continue to close the gap between U.S. interest rates relative to many countries. This should help contain the rise of the U.S. dollar (USD) against most currencies – excluding the yen. In our opinion, acceleration of global economic growth relative to that of the U.S. (whenever that occurs) should cause USD to depreciate against a broad basket of foreign currencies.
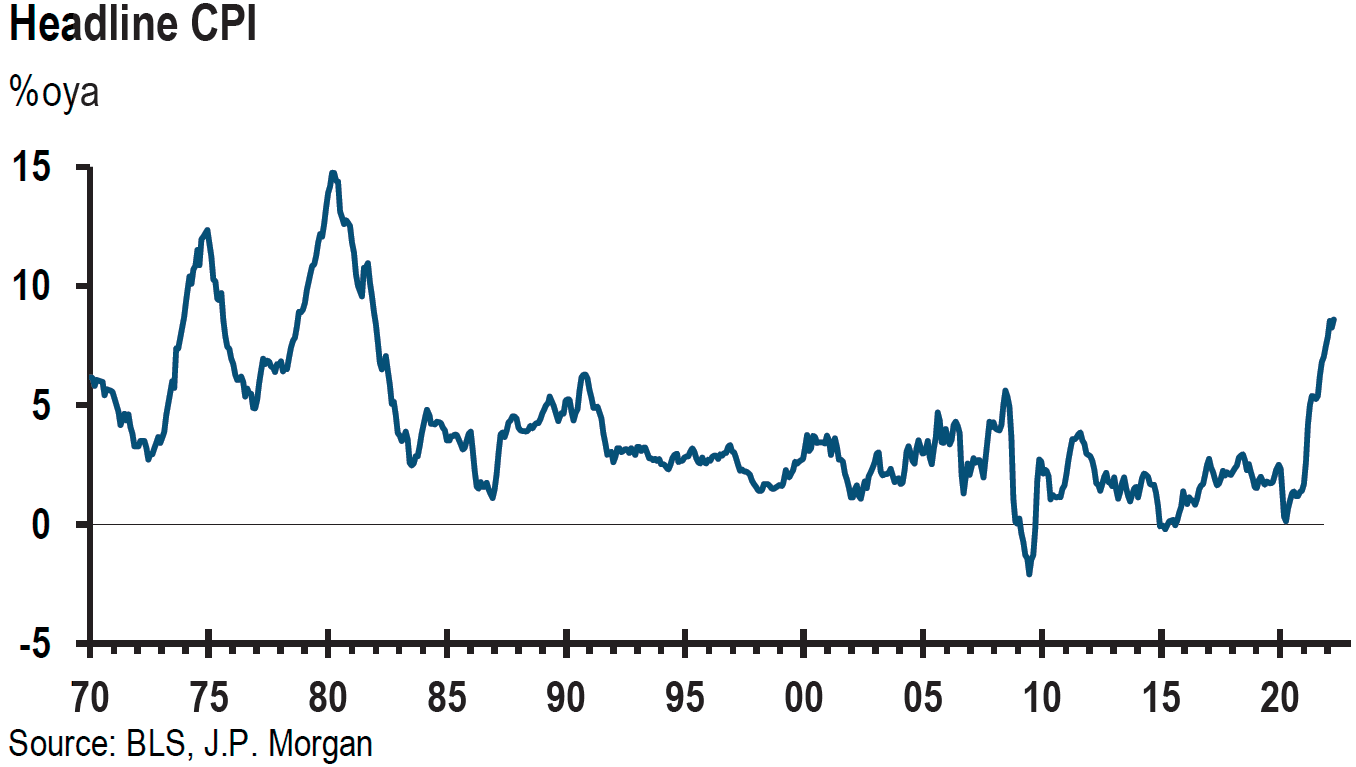
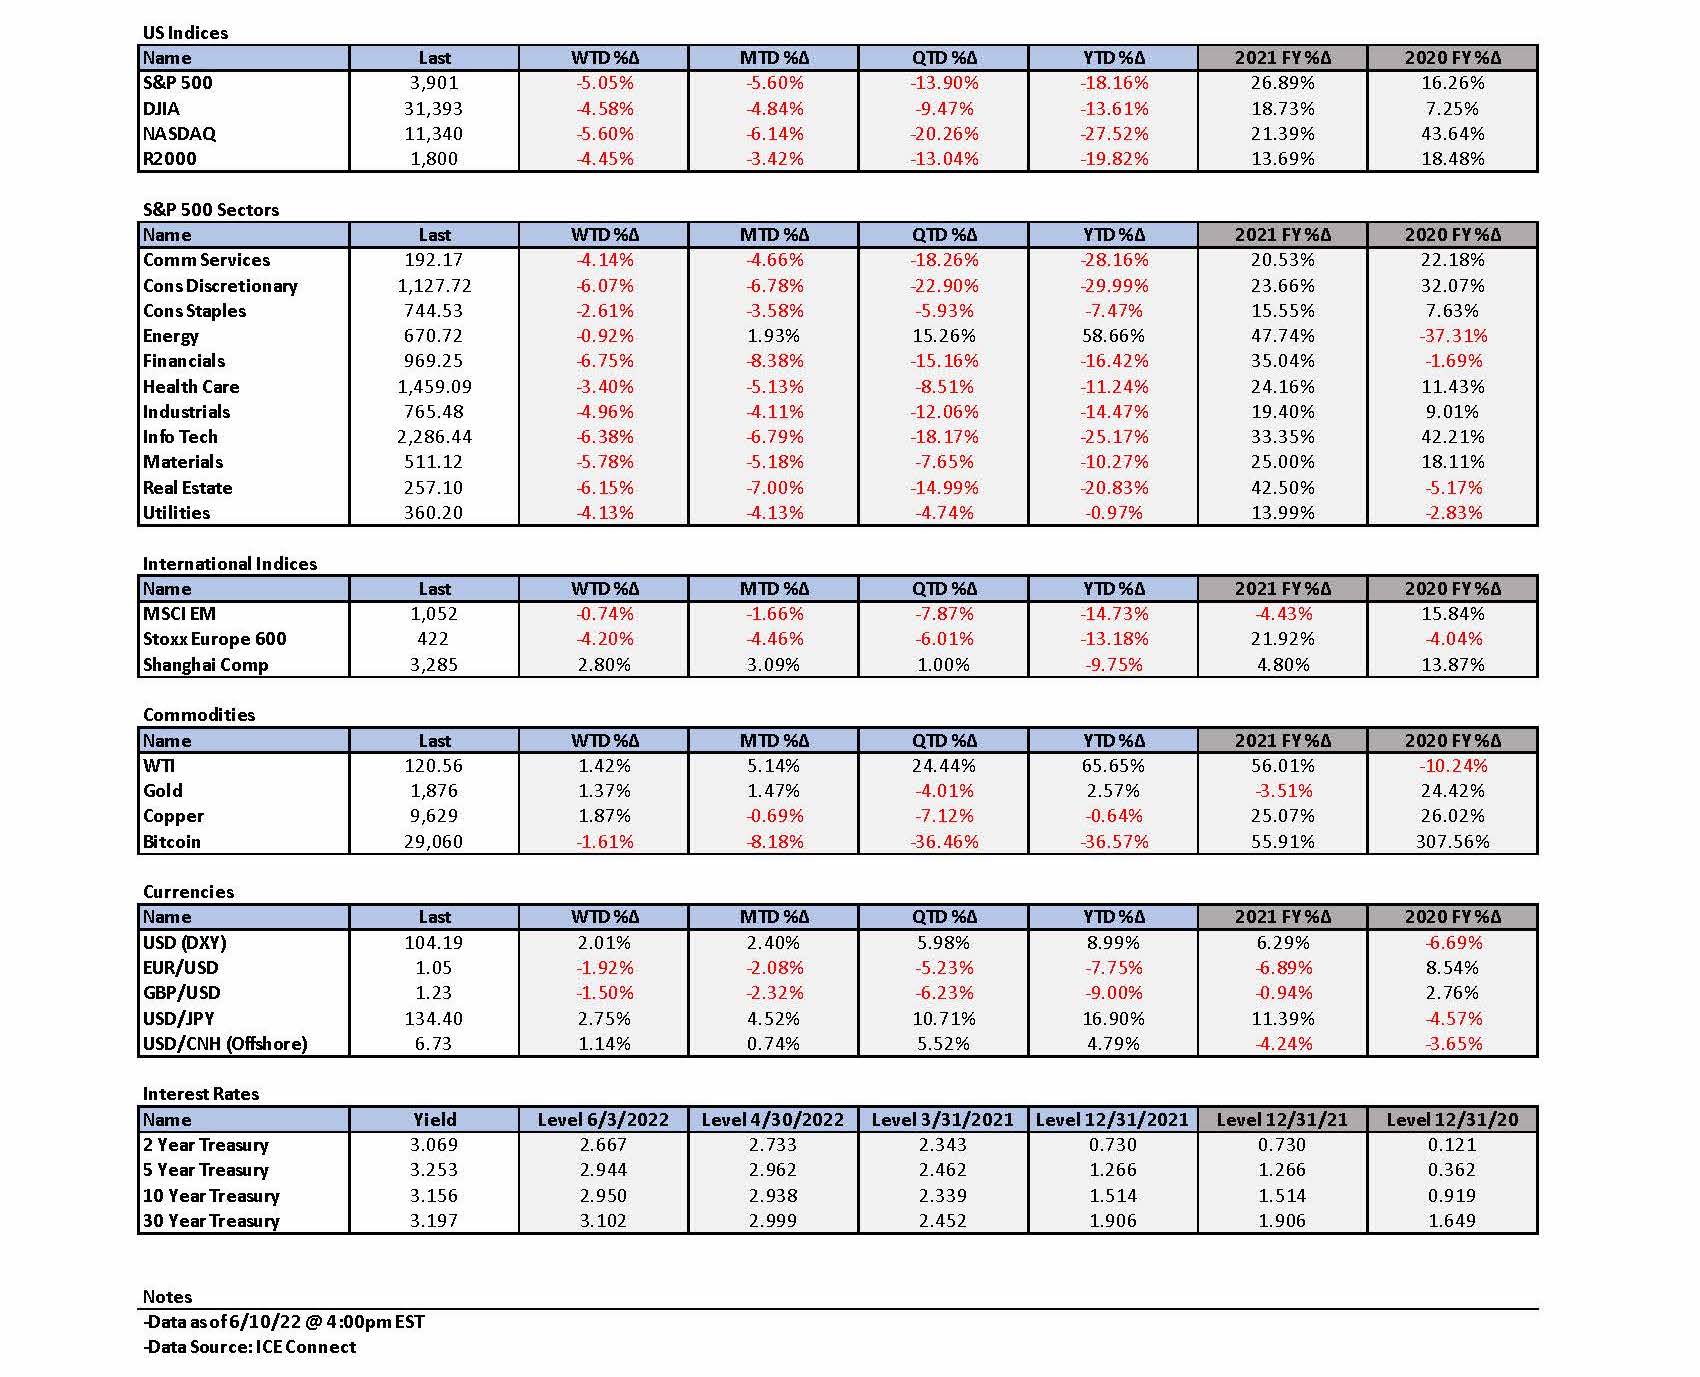
The Upshot: We trust that a depreciating USD would enhance global growth under the present circumstances. It would enhance the earnings of many U.S. multinational corporations when their foreign earnings are translated back into USD. DXY, which is a measure of USD’s value relative to a majority of the most significant U.S. trading partners, rose 0.76% on Thursday and at least another 0.90% to 104.15 mid-morning on Friday after the higher-than-expected U.S. Consumer Price Index (CPI) for May was announced. Both the headline and core CPI readings increased more than expected. The headline reading of 8.6% year-over-year (y/y) in May was the highest such reading since 1981. DXY was still below its May 12 high of 104.75 as of the time of this writing. We are still hopeful that a DXY top remains in place or that any surge above that level will be short-lived. The 2-10-year part of the Treasury yield curve flattened after the CPI release and we believe that stagflation and/or recession risks have increased for the U.S. economy over the next twelve months. We now expect the Fed to raise the federal funds rate by at least 50 bps at its September meeting.
Depreciating currencies typically lead to increased exports. But in the present environment many countries with depreciating currencies have been unable to take full advantage due to supply constraints and increased commodity costs. Most commodities are priced in USD. An appreciating USD has made the cost of commodities even more expensive for countries whose currencies have depreciated. We assume that this has limited foreign spending for other economic activities. Another effect of a strong USD has meant lower U.S. inflation at the margin and higher inflation for countries with depreciating currencies. We therefore postulate that under present circumstances, a depreciating USD would be a net benefit for the global economy. Given our assumptions, we continue to anticipate that global economic growth forecasts will be lower and that headline inflation forecasts, which include energy and food, will be raised. Our summary of the change in the forecasts of many CBs and global economically focused institutions announced this week has generally supported our thesis. We assume that upward revisions in inflation forecasts will be primarily due to higher energy and other commodity prices, mostly because the Russia -Ukraine war (war) persists. Because of the persistence of high energy and food costs due mostly to the war, we anticipate that the focus of most CBs will be on headline inflation. We believe that financial market volatility will continue for at least as long as the war endures. Therefore, we still favor diversified portfolios for long-term investors that consist of large-cap high quality stocks, as well as some commodity exposure. We will continue to look for opportunities to take advantage of market volatility.
Source: J.P. Morgan, US: May CPI data are strong and above expectations (6/10/22)
Weather Patterns Can Change Quickly
At an investor conference on June 1, J.P. Morgan’s (JPM) CEO Jamie Dimon warned investors that they should prepare for an economic “hurricane.” He stated: “That hurricane is right out there down the road and coming our way.” Although the size and severity of this hurricane could not be determined at present, “you better brace yourself.” I was especially pleased with Mr. Dimon’s latest characterization of the economy because it gave me an excuse to refer to my favorite version of the song “Like a Hurricane” as sung and performed by Bryan Ferry’s group live at the Nuits de Fourviere festival in Lyon. The power and vigor of this version is the most “like a hurricane.” Unlike Mr. Dimon, we already feel like we have been through many “economic hurricanes.” The initial devastating effects from the pandemic, including the global economy coming to a virtual standstill, perhaps were most like a hurricane and the most severe when compared to anything that has followed or is even likely to follow. It was just a few weeks earlier when Mr. Dimon just saw “big storm clouds” on the horizon that he hoped would dissipate. As we all know, weather patterns can change quickly. In some of our more recent commentary, we also have noted how quickly the behaviors of consumers, businesses and central banks also can change very quickly and without notice.
Central Banks Raising Rates – RBA Focus
Many of the world’s central banks have appeared recently to have become much more aggressive in their attempts to rein in inflation. Many of these same CBs have increased their forecasts of inflation and have decreased their assumptions of economic growth. In our recent commentaries we have highlighted the increasingly aggressive monetary stances of both the Bank of England (BOE) and Bank of Canada (BOC) as they have raised their inflation forecasts. The Reserve Bank of Australia (RBA) continued that trend this week. On Tuesday, the RBA surprised financial markets by increasing its “cash rate” 50 basis points (bps) to 0.85% versus expectations of a 25 or 40 bps increase. The interest rate rise followed a previous 25-bps hike in May that was the RBA’s first hike since 2010. RBA stated that it “expects to take further steps in the process of normalizing monetary conditions in Australia in the months ahead.” Consumer price inflation (CPI) hit a 20 year peak of 5.1% in Q1 and could approach 6% in Q2 due to rising costs for energy, food, rents and home building. The rapidity of expected inflation increases was clearly expressed by RBA Governor Philip Lowe: “Higher prices for electricity and gas and recent increases in petrol prices mean that, in the near term, inflation is likely to be higher than was expected a month ago.” Australia’s Treasurer warned Australians that inflation would get worse before easing, and to brace for a “difficult and expensive” winter. CNBC reported on June 7 that the cash rate could reach 3% by year end, making this tightening cycle “easily one of the most aggressive … on record.” It is well known that the Australian housing market is a very heavily indebted market. After strong gains in 2021, house prices have started to “slip” in major cities. Moreover consumer sentiment was “back to the depths of the pandemic.” Given these dynamics, many economists were surprised by the RBA’s aggressive monetary tightening stance. Evidently, RBA was more concerned about inflation than slowing economic growth.
CBs Raising Rates – RBI Focus
After the RBA increased its “cash rate” on Tuesday, the Reserve Bank of India (RBI) announced the very next day a surprisingly hawkish monetary stance as well. RBI raised its key interest rate 50 bps to 4.9% on Wednesday. It was only three weeks earlier that RBI raised rates 0.40%. RBI Governor Shaktikanta Das said “upside risks to inflation … materialized earlier than expected.” The RBI raised its inflation forecast for 2022-23 from 5.7% to 6.7% but maintained its 2022 economic growth forecast at 7.2%. Das focused on the Russia-Ukraine war as the main driver of these revisions. The war gives rise to “newer challenges each passing day which is accentuating the existing supply chain disruptions. As a result, food, energy, and commodity prices remain elevated.” Once again, a major CB’s monetary policies were clearly focused on reining in inflation.
CBs Raising Rates – ECB Focus
Even the European Central Bank (ECB) finally decided on Thursday that it had to focus on reining in inflation at the risk of slowing the Eurozone’s economy. But, in keeping with lagging behind most CBs more aggressive monetary tightening policies, the ECB changed its policies with a delay. The ECB indicated it would raise its three key rates by 25 bps each in July, which could be followed by a bigger hike in September “if the medium-term inflation outlook persists or deteriorates.” The ECB president ruled out a 50-bps hike for July because she thought it would be “good practice” to start with a rate increase that is “sizable, not excessive and indicates a path” that it’s on. The July rate hike would be the ECB’s first hike in over a decade. ECB president Christine Lagarde stated that “inflation is undesirably high and is expected to remain above our target for some time.” The ECB also announced that it would end its Asset Purchase Program (APP) as of the end of June. The Eurozone headline CPI was 8.1% year-over-year (y/y) in May, which is the highest rate of inflation since the creation of the euro currency in 1999. The ECB noted that inflationary pressures had “broadened and intensified” for both goods and services. It even expected core CPI – which excludes food and energy – to exceed its 2% target of inflation through 2024. The ECB also reduced its 2022 forecast for the Eurozone economy from 3.7% to 2.8%, to be followed by a 2.1% CPI for both 2023 and 2024. Headline CPI was now projected to increase by an average of 6.8%, up from the March projection of 5.1% for 2022, fall to 3.5% in 2023 and to eventually fall to 2.1% in 2024. European wages were slower to rise when compared to both the U.S. and UK, but have started to pick up in recent months. Longer-term inflation expectations have begun to rise with recent wage gains. The ECB will be especially watchful of the spread between the bond yields of northern and southern Europe. After the ECB Thursday announcements, The New York Times reported that the spread between the Italian and German 10-year yields expanded to 2.16%, the “widest since early 2020.” The 10-year bond yield on Italian debt rose 22 bps on Thursday to 3.6%, highest since late 2018.
Atlanta Fed’s GDPNow Tracker – Slowing U.S. Economic Growth
The latest indication of a slowing U.S. economy was revealed by the Atlanta Fed’s widely followed Federal Reserve gauge of the U.S., economy. The Atlanta Fed’s GDPNow tracker revealed on Tuesday that U.S. Q2 GDP growth was now estimated at +0.9% annualized compared to a 1.3% estimate on June 1, which is yet another indication of how quickly the economy might change. The Q2 estimate was 2.5% as recently as mid-May. The GDPNow tracker combines information from the U.S. Bureau of Economic Analysis, the U.S. Census Bureau, the Bureau of Labor Statistics and the Institute for Supply Management. According to CNBC on June 7, the latest estimates for U.S. personal consumption expenditures, a measure of consumer spending that accounts for almost 70% of U.S. GDP, were cut to a 3.7% gain from a previous forecast of 4.4%. The $20 billion decrease in the U.S. April trade deficit indicated that the Atlanta Fed’s estimate of Q2 GDP growth would be lowered only by 0.13% from the previous estimate of a 0.25% subtraction. Trade deficits are subtracted from U.S. economic growth figures to more accurately reflect a true measure of U.S. GDP growth.
U.S. Trade Deficits – Effect of China Lockdowns
Mostly due to the variability of U.S. imports as exports have continued to grow more steadily, the U.S. trade deficit has been particularly volatile recently. We attribute most of the import variability to COVID-19 related lockdowns in China that have hampered the country’s ability to produce goods for export. Given the dramatic increase in China’s May exports, which were over twice the expected increase, we suppose that U.S. imports are about to rise along with its associated trade deficit. Unfortunately, it appears that China’s “dynamic zero-COVID-19 policy” will continue to be unpredictable. The city of Shanghai with its over 26 million residents had just come out of a roughly two-month lockdown, when on Thursday, a partial shutdown involving 2.7 million residents was announced after a total of nine coronavirus infections were discovered. Mass testing for the 2.7 million residents affected was scheduled for Saturday. Many details remain unknown to us as of this writing. We believe that China’s zero-COVID-19 policy could be in transition to a less severe version. According to Bloomberg on June 9, president Xi Jinping called on his government to adhere “unwaveringly” to its “zero policy,” while at the same time “striking a balance” with the needs of the economy. Without admitting as such, Xi seems to be responding to premier Li Keqiang widely broadcast plea for more focus on economic growth that we described in previous commentary.
Source: J.P. Morgan, US: Trade deficit narrows sharply in April (6/7/22)
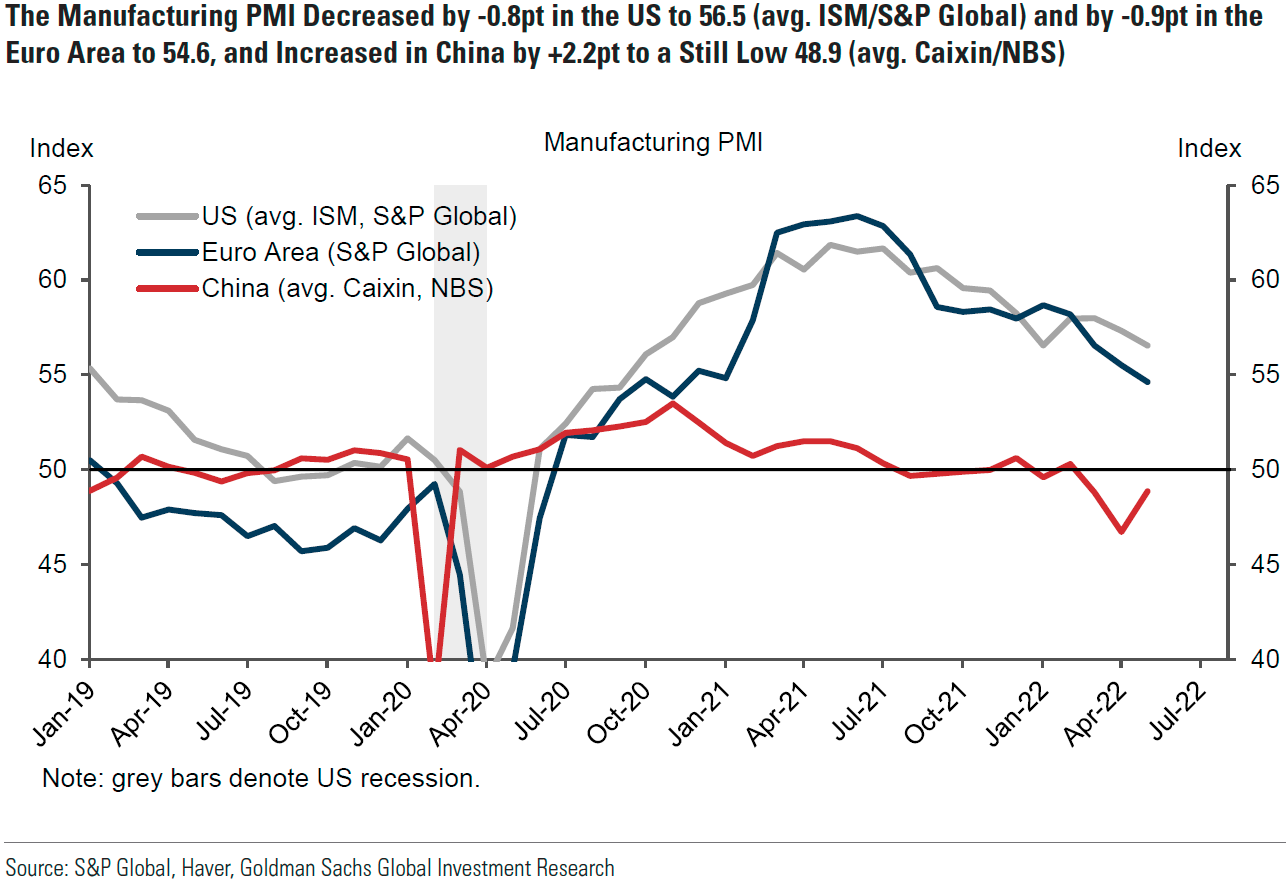
Source: Goldman Sachs, Global PMI Monitor: May DM Manufacturing PMIs Show Slowing New Orders and Shortening Delivery Times (6/6/22)
Consumer Credit and U.S. Stagflation and/or Recession Risk
As we have highlighted in many of our recent commentaries, U.S. equities appear to be increasingly pricing in recession and/or stagflation risks. In its “U.S. Weekly Kickstart” publication of June 3, Goldman Sachs noted “growing recession concerns among managements and investors.” But Goldman believed that the U.S. equity market as of June 3 had only “priced an economic slowdown, but not a full recession.” It is our contention that many company managements, investors and analysts remain confident that recession risks remain de minimis because of their assumption of a robust U.S. consumer with a balance sheet of over $2 trillion in “excess savings.” In our May 13 weekly commentary we remarked that there was a dramatic increase in revolving consumer credit growth in March, mostly through credit cards. Filings by commercial banks also “indicated a clear increase in consumer credit demand since the start of this year.” The Federal Reserve (Fed) released its April Consumer Credit report on June 7. Although March’s consumer credit growth was revised down to 12.7% y/y, April’s consumer credit grew at a greater than expected rate of 10.1% y/y. Revolving credit, which includes credit cards, increased 19.1% y/y, and non-revolving credit, which includes auto and student loans, increased 7.1% y/y in April. One of our prior commentaries also referred to a previous NY Fed survey which showed that consumers were not as confident about the future availability of consumer credit. On June 8, JPM disclosed that U.S. mortgage demand fell to its lowest in 22 years, mostly due to higher rates. In our view, these observations do not depict a robust and confident consumer. Instead, we see a consumer who might suddenly stop or greatly diminish their spending and/or patterns of spending. Our prior commentaries have shown that both Target and Walmart are painfully aware of a sudden shift in consumers’ spending patterns.
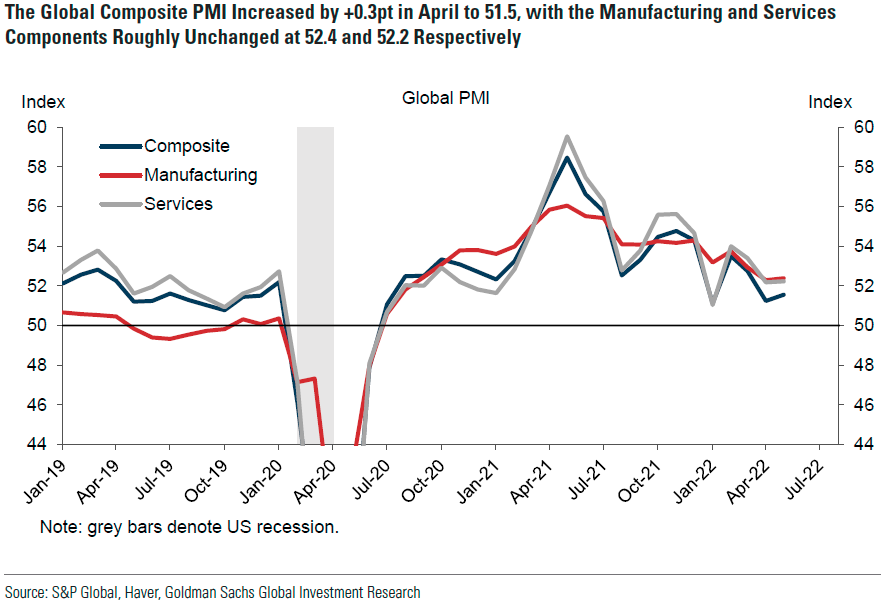
Source: Goldman Sachs, USA: GS Economic Indicators Update (6/6/22)
Revised Global Economic Forecasts – World Bank
The crescendo of the rather sudden emergence of more aggressive monetary tightening policies by many CBs were accompanied this week by major global institutions, such as the World Bank and the OECD, revising their global inflation forecasts higher and their global economic growth rates lower. The World Bank dropped its 2022 global GDP forecast to 2.9% from its January forecast of 4.1%. On Tuesday, the World Bank’s president David Malpass said that “the war in Ukraine, lockdowns in China, supply-chain disruptions, and the risk of stagflation are hammering growth. For many countries, recession will be hard to avoid.” The World Bank projected a rather flat 2023 global GDP growth rate of 3%. The World Bank attributed its lowered forecasts to persistent high energy and food prices as well as higher interest rates due to tighter CB monetary policies. It was particularly concerned about food security of lower-income countries and emerging market (EM) countries. The World Bank report even warned of a possible “major recession in Europe and Central Asia.” The report referred to the nearly seven million refugees of mostly women and children that have entered Europe from Ukraine. The report also warned of possible social unrest due to the rapid increases in the cost of living and the availability and price of food in particular. The report cited several studies that pointed to rising food prices as an “important trigger for the Arab Spring uprisings in 2011.” On June 9, the global head of commodities research at Citi Ed Morse concurred on CNBC TV with the World Bank’s concern of food insecurity for many EMs and the possibility for social unrest. He observed that it was not just insufficient food supply, but the logistical issues of getting food into the hands of the ones most in need. Many of these logistics issues were due to the war. The most recent IMF global GDP forecast from April was 3.6% by comparison.
Source: Goldman Sachs, USA: GS Economic Indicators Update (6/6/22)
Revised Global Economic Forecasts – OECD
On Wednesday, the OECD lowered its global growth outlook for 2022 to 3% from its previous forecast of 4.5%. Although the OECD believed that the risks for a global recession and/or stagflation period were rising it appeared more sanguine than the World Bank that such outcomes could still be avoided. The OECD projected that the average headline CPI inflation rate for its 38 member countries would average close to 9% for 2022, which was about twice its prior estimate. The average inflation rates of some countries were expected to exceed 10%. The OECD was particularly concerned about potential food shortages in EMs.
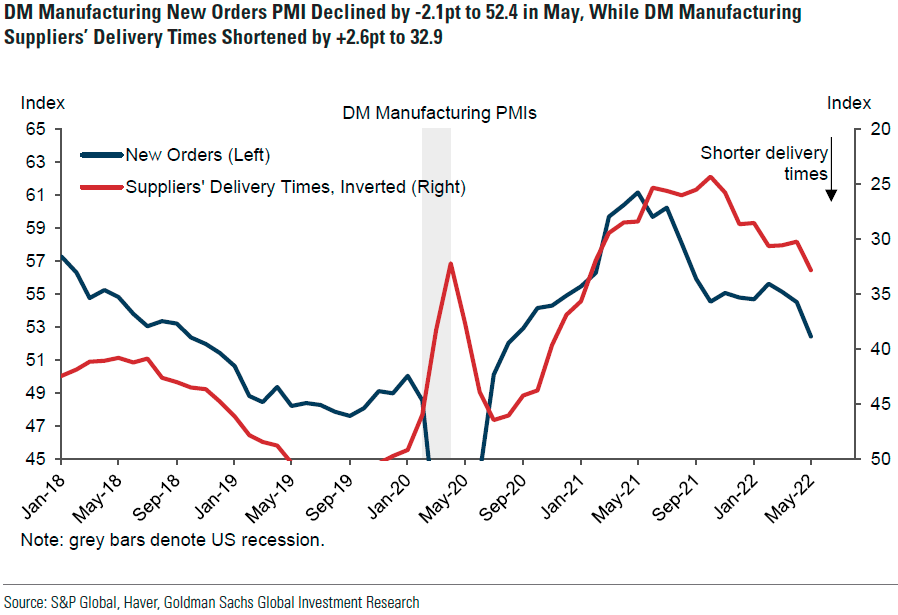
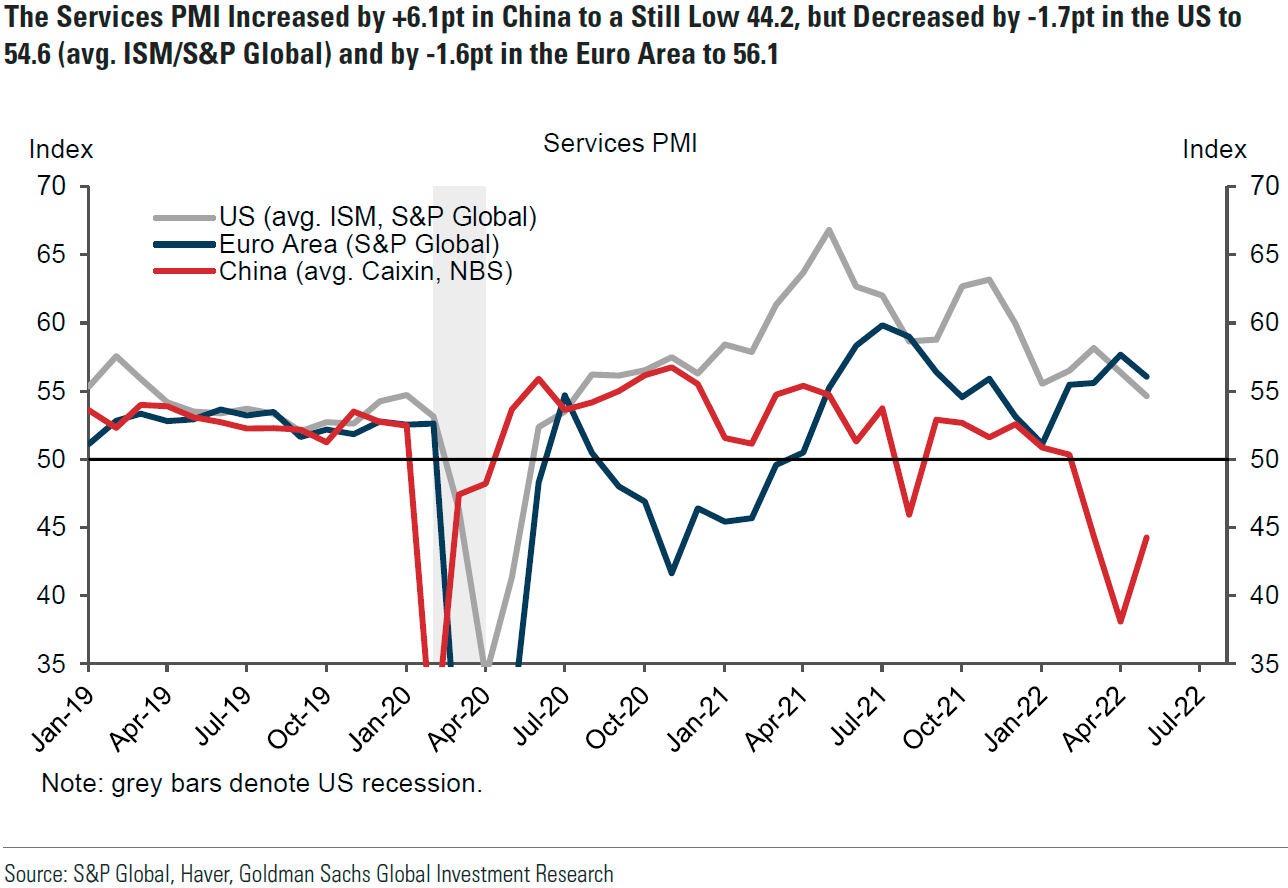
Source: Goldman Sachs, Global PMI Monitor: May DM Manufacturing PMIs Show Slowing New Orders and Shortening Delivery Times (6/6/22)
BOJ and PBOC – Anomalies
In contrast to most CBs pictured above, the Bank of Japan (BOJ) and the People’s Bank of China (PBOC) stand out as the two biggest anomalies. The BOJ has refused to tighten its monetary policies. Instead, it has decided to maintain its monetary stance in spite of inflationary pressures and the fact that Japan must import many of its needed commodities. It should come as no surprise that the yen has plummeted this year to 20-year lows versus the U.S. dollar (USD). Goldman Sachs estimated recently that the yen is at least 25% undervalued vs. USD. The PBOC has actually loosened its monetary policies somewhat this year. But as China’s currency finally started to depreciate vs. USD, China has decided to try a more targeted approach to stimulate its economic growth. However, in our view, China’s zero COVID-19 policies with their associated lockdowns has resulted in a slower economic growth rate for China this year than was originally projected, much in the same way that a very restrictive monetary policy would have “worked.”
Possible USD Top – Continued
In our May 20 weekly commentary, we stated that “we could be putting in a USD top.” In last week’s commentary we reiterated that view. On May 12, DXY reached a high of 104.75. On Thursday DXY rose 0.76% to close at 103.32. After the higher-than-expected May U.S. CPI readings released on Friday, DXY rose at least another 0.90% to 104.15. We are still hopeful that the May 12 top will hold. If not, we expect anything above that level to be short-lived. Most analysts appear to rely on interest rate differentials in their currency forecasts. For much of this year, U.S. interest rates have far exceeded interest rates of many countries. As our depiction above of the rather sudden aggressive restrictive monetary policies of many CBs implies, interest rate differentials have begun to compress – other than in Japan. We believe that this development should contain somewhat any further USD appreciation. We continue to expect a downturn in USD when global growth begins to accelerate relative to that of the U.S.
Bottom Line
We assume continued volatility across virtually all financial markets for at least as long as the war persists. The much more aggressive posture of many central banks recently, along with their upward revisions to their inflation forecasts and downward economic growth revisions, coincides with a narrative that many CBs believe that an economic “hurricane” might be fast approaching and that they should be well prepared. Not knowing the extent and severity of any such possible “hurricane,” many are apparently “bracing” for the worst. We believe that many financial markets have priced in stagflation and/or recession possibilities at least partially. We believe that such risks have increased for the U.S. economy after May’s CPI report released on Friday. We now expect the Fed to raise the federal funds rate by at least 50 bps at its September meeting. For the time being, we still expect the Fed to maintain its stance that hikes in excess of 50 bps are “off-the-table” for its June and July meetings.
The appreciation of USD hopefully has peaked versus most foreign currencies, or is close to a peak. We understand that a depreciating USD would be beneficial for global economic growth in the current environment. Given the persistence of high energy and food prices mostly due to the war, it is our opinion that CBs will focus more on headline inflation. A slowdown in core inflation will still be viewed favorably, but not as much as would normally be the case.
We are still waiting for analysts’ revisions that would lower earnings projections and that would anticipate margin compression. We also continue to uphold our conviction that predictable margins should become increasingly important in evaluating appropriate investments.
Our fundamental investment approach remains the same as expressed in our recent commentaries. We maintain our preference for large-cap high quality stocks in a diversified portfolio with at least some commodity exposure.
Definitions
U.S. Dollar Index (DXY) – The U.S. dollar index (DXY) is a measurement of the dollar’s value relative to six foreign currencies as measured by their exchange rates. Over half the index’s value is represented by the dollar’s value measured against the euro. The other five currencies include the Japanese yen, the British pound, the Canadian dollar, the Swedish krona, and the Swiss franc.
Headline Consumer Price Index (Headline CPI) – Headline inflation is the raw inflation figure reported through the Consumer Price Index (CPI) that is released monthly by the Bureau of Labor Statistics (BLS). The CPI calculates the cost to purchase a fixed basket of goods to determine how much inflation is occurring in the broad economy. The CPI uses a base year and indexes the current year’s prices, according to the base year’s values.
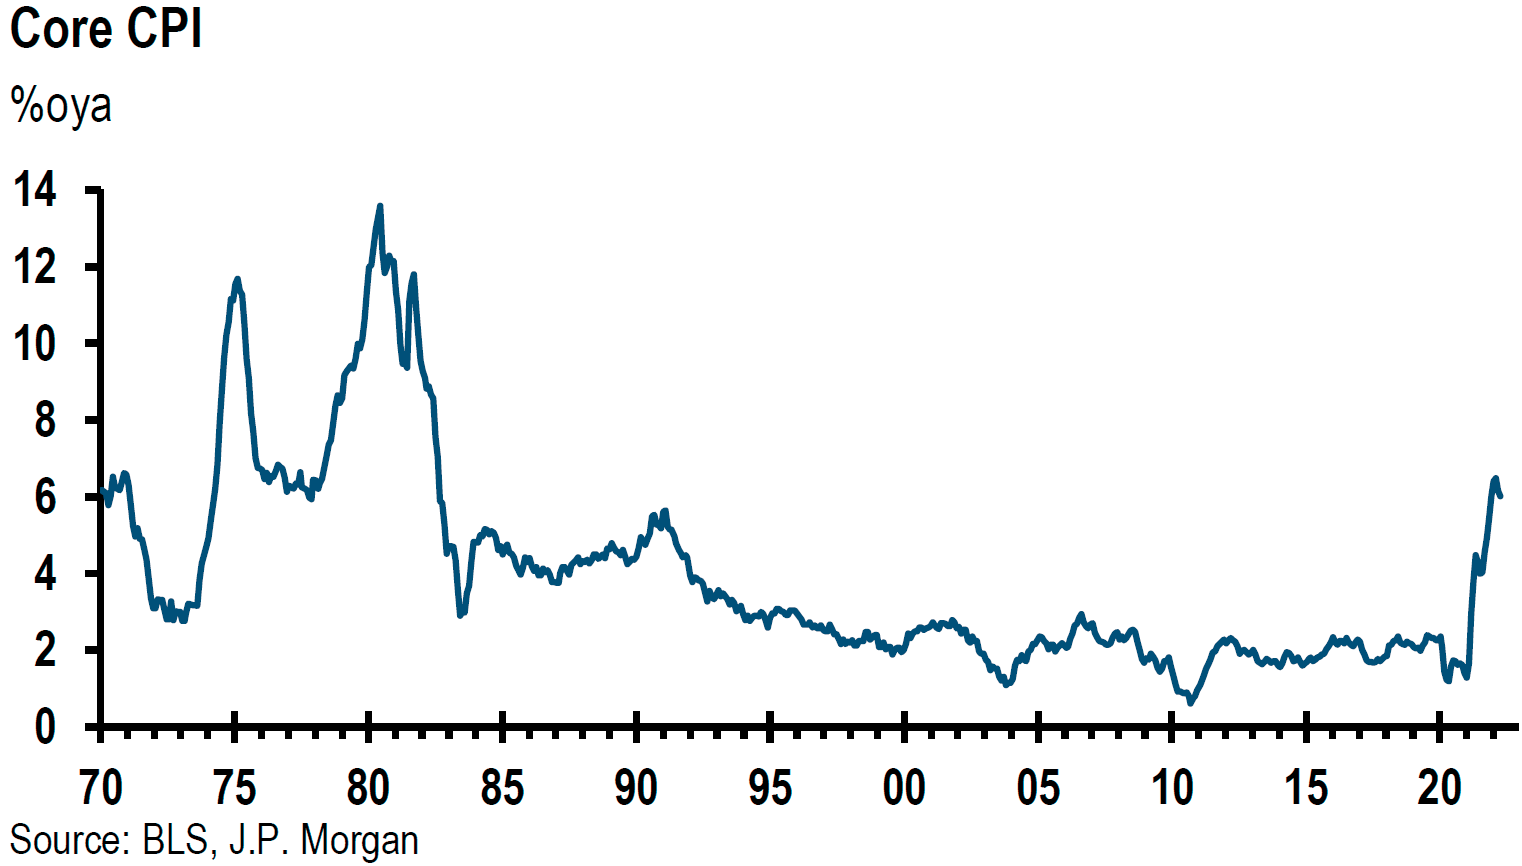
Core Consumer Price Index (Core CPI) – Core inflation removes the CPI components that can exhibit large amounts of volatility from month to month, which can cause unwanted distortion to the headline figure. The most commonly removed factors are those relating to the costs of food and energy. Food prices can be affected by factors outside of those attributed to the economy, such as environmental shifts that cause issues in the growth of crops. Energy costs, such as oil production, can be affected by forces outside of traditional supply and demand, such as political dissent.
Basis Points (bps) – A basis point is one hundredth of one percent, used chiefly in expressing differences of interest rates.
Atlanta Fed GDPNow Tracker – The GDPNow is a running estimate of real gross domestic product (GDP) growth during the current quarter, as opposed to the official GDP numbers which are released by the U.S. Bureau of Economic Analysis (BEA) with a significant delay that can impact policy decisions.
Emerging Market (EM) – An emerging market economy is the economy of a developing nation that is becoming more engaged with global markets as it grows. Countries classified as emerging market economies are those with some, but not all, of the characteristics of a developed market.
World Bank – The World Bank is an international organization dedicated to providing financing, advice, and research to developing nations to aid their economic advancement. The bank predominantly acts as an organization that attempts to fight poverty by offering developmental assistance to middle- and low-income countries.
Organization for Economic Co-operation and Development (OECD) – The Organization for Economic Co-operation and Development (OECD) is a group of 37 member countries that discuss and develop economic and social policy. OECD members are typically democratic countries that support free-market economies.
International Monetary Fund (IMF) – The International Monetary Fund (IMF) is an international organization that promotes global economic growth and financial stability, encourages international trade, and reduces poverty.
IMPORTANT DISCLOSURES
The views and opinions included in these materials belong to their author and do not necessarily reflect the views and opinions of NewEdge Capital Group, LLC.
This information is general in nature and has been prepared solely for informational and educational purposes and does not constitute an offer or a recommendation to buy or sell any particular security or to adopt any specific investment strategy.
NewEdge and its affiliates do not render advice on legal, tax and/or tax accounting matters. You should consult your personal tax and/or legal advisor to learn about any potential tax or other implications that may result from acting on a particular recommendation.
The trademarks and service marks contained herein are the property of their respective owners. Unless otherwise specifically indicated, all information with respect to any third party not affiliated with NewEdge has been provided by, and is the sole responsibility of, such third party and has not been independently verified by NewEdge, its affiliates or any other independent third party. No representation is given with respect to its accuracy or completeness, and such information and opinions may change without notice.
Investing involves risk, including possible loss of principal. Past performance is no guarantee of future results.
Any forward-looking statements or forecasts are based on assumptions and actual results are expected to vary from any such statements or forecasts. No assurance can be given that investment objectives or target returns will be achieved. Future returns may be higher or lower than the estimates presented herein.
An investment cannot be made directly in an index. Indices are unmanaged and have no fees or expenses. You can obtain information about many indices online at a variety of sources including: https://www.sec.gov/fast-answers/answersindiceshtm.html or http://www.nasdaq.com/reference/index-descriptions.aspx.
All data is subject to change without notice.
© 2024 NewEdge Capital Group, LLC


