

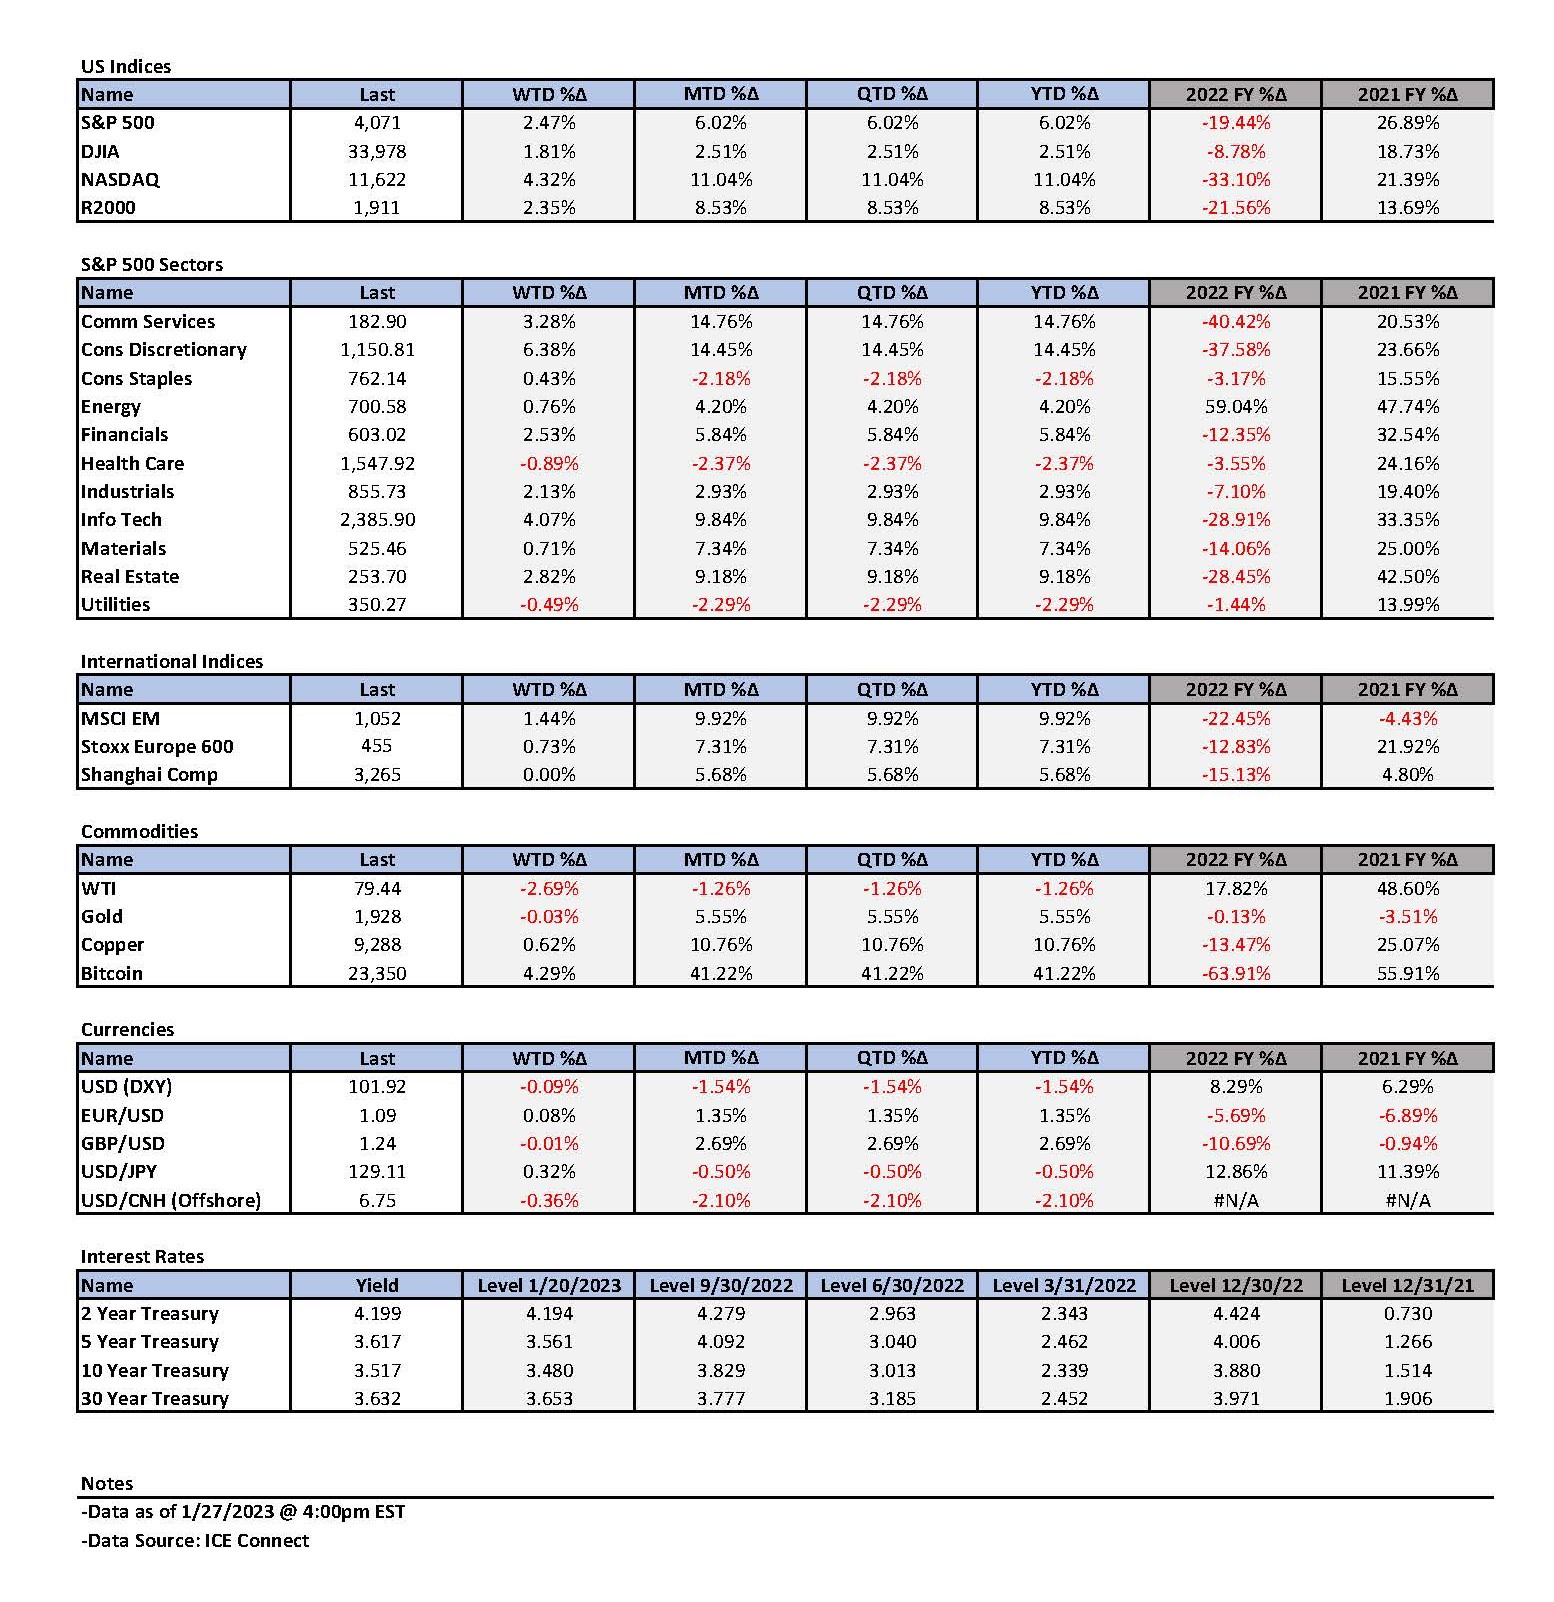
Weekly Summary: January 23 – 27
Key Observations:
- We believe that this week’s financial market movements showed the importance of stock selectivity and the benefits of maintaining a globally well-diversified portfolio for long term investors in a volatile U.S. equity environment that continues to show a great resiliency – so far. Given the assumption of many investors that U.S. stocks would begin this year in a downtrend, it was rather obvious to many that the “pain trade” would be that stocks would begin the year with a substantial rally. J.P. Morgan has written extensively this year that the rallies in some certain speculative stocks have risen due to short covering. We agree, but we also see the benefits of stock selectivity.
- The inflation data that we analyzed this week continued to show a marked decelerating pattern that we expect to continue. Some surveys included in this week’s commentary show that many business executives and consumers now expect to see such patterns as well. In our opinion, the economic growth data was more mixed. The underlying composition of some better-than-expected economic growth rates were not as robust as the headlines might indicate. We surmise that the better-than-expected Q4 U.S. GDP growth of 2.9% and the better than expected 5.6% increase in durable goods orders were two such examples.
- The S&P Global PMIs for the Eurozone, some of which increased back into expansionary territories, and the better than expected but still contractionary U.S. PMIs, seemed to confirm recent upgrades for Eurozone growth relative to the U.S. We also believe that the Eurozone, and in particular Germany, will enjoy positive “spillover effects” from China’s reopening.
- We believe that Friday’s rise in U.S. Treasury yields was at least partly driven by the higher-than-expected inflation readings from Tokyo. This is a reminder that the U.S. remains a part of a global economy. We forecast that it is only a matter of time before the Bank of Japan will finally let its sovereign rates rise. This might cause liquidity in U.S. Treasuries to further contract at some point and might put upward pressure on global interest rates. We continue to expect the Fed to raise the federal funds rate by 25 basis points at its meeting next week.
The Upshot: Our general investment approach remains the same as depicted in last week’s commentary. We maintain our preference for big cap quality stocks with good balance sheets, relatively stable cash flows with stable margins. Volatility across sectors continues to be supportive of a well-diversified global portfolio for long term investors.
This week highlighted the importance of stock selectivity. Although stocks with high Price/Earnings ratios might come with more risks generally, especially in a relatively higher interest rate environment, there might be factors that could encourage the purchase and holding of some such stocks. Low multiples are insufficient protection against disappointing earnings announcements. In general, we would tend to avoid buying once high growth/tech stocks that become value sticks. But there are always exceptions to such “rules.”
“Love the One You’re With”
Given his death last week, we wish to honor David Crosby by selecting a song from his group Crosby, Stills, Nash & Young. We chose “Love the One You’re With.” Many long-term investors might be wishing for more predictable financial markets, but to be effective investors, we must deal with the generally volatile markets that seem to be the current “reality.” We chose to “love” the markets that we’re with. “If you’re down and confused; And you don’t remember who you’re talking to; Concentration slips away … And if you can’t be with the one you love … Love the one you’re with.” We have stressed that recently financial markets have shown the importance of selectivity of stock and type of assets. We believe there were many examples this week that showed the importance of stock selectivity. We continue to favor quality, big-cap stocks with good balance sheets, relatively steady cash flows and stable margins. To meet our criteria, companies must have real earnings. Although we would prefer low-multiple stocks, this does not mean that we should necessarily avoid stocks with somewhat higher multiples so long as we can justify those higher multiples. In general, the higher the multiple, the higher the risk. We strive for a well-diversified global portfolio for long term investors. Volatility across sectors continues to be supportive of this approach. Microsoft (MSFT) has a relatively high multiple in the opinion of many investors and analysts. After trading lower on weaker-than-expected current quarter guidance, we were encouraged by the stock’s positive reversal and positive follow-through the next day. We found this encouraging for MSFT and for the overall U.S. equity market – at least in the short term. “Cheaper,“ lower-multiple stocks, such as IBM and Intel (INTC), traded lower after their respective earnings announcements this week and showed little inclination to bounce back. Many investors consider these two stocks as “value” stocks. We also have favored value stocks in a diversified portfolio for quite some time. In past years, we “learned” generally to avoid value stocks which were once considered growth stocks – this was particularly true in regard to high-tech stocks. Of course, like any other “rule,” there are exceptions. We strive to evaluate which stocks deserve a higher or lower multiples and invest accordingly. Overall, we thought that U.S. equities continued to show “resiliency” this week through Thursday. The U.S. dollar (USD) and U.S. Treasury yields were relatively stable this week – although the yield curve tended to fluctuate around a very inverted level. We thought that the economic data we analyzed this week showed a continued deceleration of U.S. inflation and a more “mixed” economic picture.
U.S. Leading Economic Indicators Weaken Further
After a November decrease of 1.1%, the Conference Board’s Leading Economic Index (LEI) declined 1.0% in December. The LEI is now 4.2% for the six months June through December. This was a much steeper contraction from the 1.9% downturn of the previous six months. Ataman Ozyildirim – the Senior Director, Economics, at the Conference Board – chose to characterize the LEI as follows: “The U.S. LEI fell sharply again in December – continuing to signal a recession for the U.S. in the near term.” Overall economic activity was considered likely to turn negative in coming quarters before picking up again in Q4 2023. Even as industrial production retreated for the third consecutive month, labor market indicators – employment and personal income – remained “robust.”
S&P Global January “Flash” U.S. PMI Indexes
The composite Purchasing Managers’ Index (PMI) rose from December’s reading of 45.0 to a three-month high of 46.6. Anything under 50 is considered contractionary. The U.S. services business activity index also rebounded to a three-month high of 46.6 from December’s reading of 44.7. U.S. manufacturing output rose from 46.2 to a two-month high of 46.7. Business activity fell by the slowest rate in three months, even as new orders across the private sector fell for the fourth consecutive month. After seven consecutive months of moderating input prices, January indicated a pickup in input cost burdens that were still “well below” the average of the last two years. “Efforts to remain competitive and other concessions to customers dampened output price hikes.” We understood this to be suggestive of a possible profit margin compression. The rate of job creation was one of the slowest since July 2020 as services employment increased slightly and manufacturing jobs decreased. The degree of optimism for the future reached a four-month high. Although the rate of decline for new business in the manufacturing sector was the second fastest in two-and-a-half years, export “demand conditions” contracted at the slowest pace since June 2022. Input buying fell at the fastest pace since May 2020 as manufacturers cut their workforces for the first time since July 2020. However, output expectations were the strongest since May 2022.
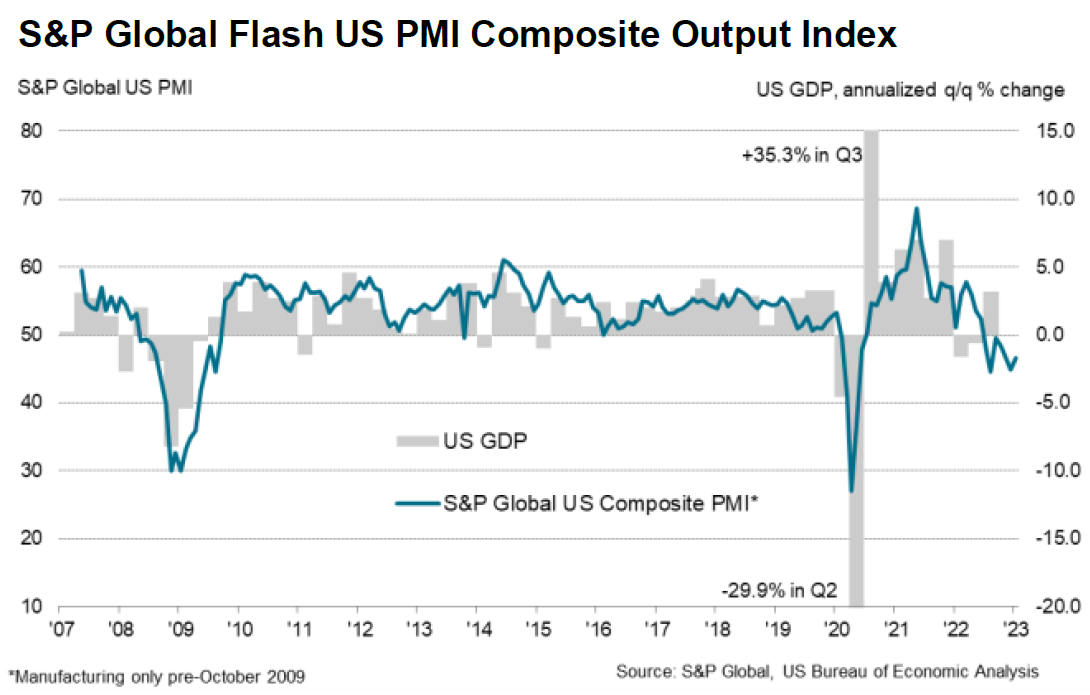
Source: S&P Global, S&P Global Flash US Composite PMI (1-24-2023)
S&P Global January “Flash” Eurozone PMI Indexes
Both the composite and services PMIs rose back into growth territory as the composite PMI increased from December’s 49.3 reading to a seven-month high of 50.2, and the services PMI activity index rose from 49.8 last month to a six-month high of 50.7. The manufacturing output index also reached a seven-month high after increasing from 47.8 in the last period to its current value of 49.0. Additionally, the manufacturing PMI came in at a five-month high of 48.8 from 47.8 last month. Eurozone business activity finally expanded after six months of contraction. Business confidence “jumped” higher to the highest level since last May as employment growth picked up. “Input cost inflation … cooled further thanks to alleviating supply chain stress, but average selling price inflation for both goods and services ticked higher, reflecting still elevated cost growth and upward wage pressures.” January reflected the largest monthly increase in Eurozone’s PMI composite business expectations index since June 2020. The S&P Global chief economist thought that this January’s survey provided evidence that the Eurozone “might” escape a recession this year and that the low point of Eurozone’s business activity might have seen the lows for this cycle in October.
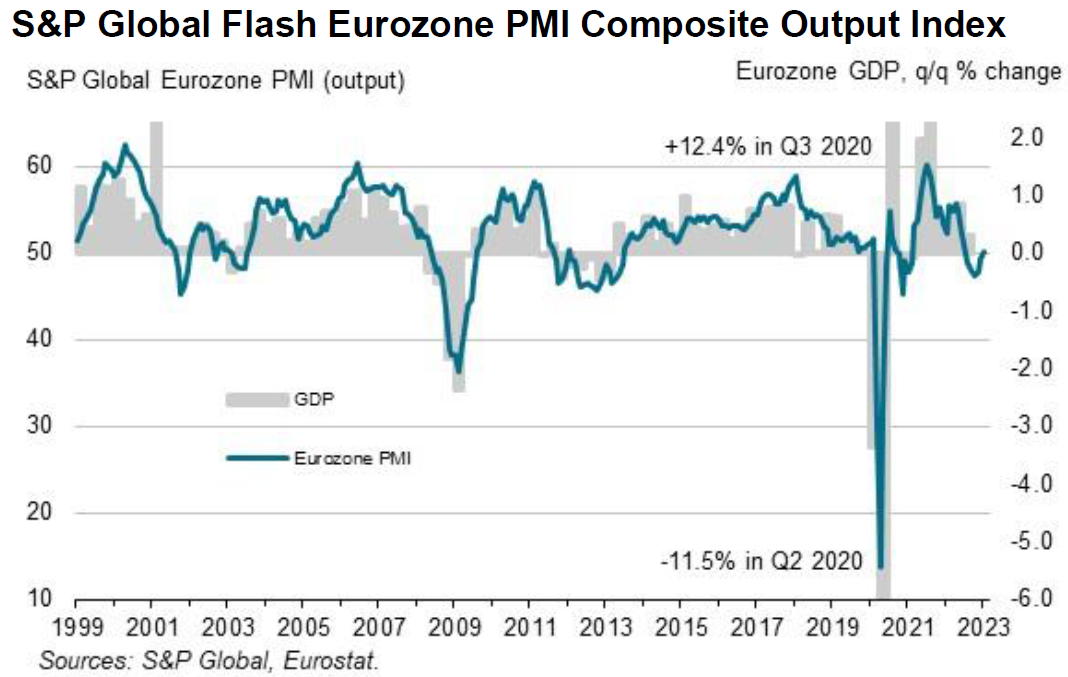
Source: S&P Global, S&P Global Flash Eurozone PMI (1-24-2023)
Germany’s January ifo Business Climate index
The ifo Institute for Economic Research’s (ifo) business climate index rose from December’s reading of 88.6 to 90.2. This index rose mostly due to “considerably less pessimistic expectations.” German business sentiment hit a seventh high in January as ifo’s gauge measuring expectations increased from 83.2 to 86.4. In contrast, the index assessing the current situation was down slightly to 94.1. Inflationary pressures were perceived to be easing as “only” 48% of companies complained about supply bottlenecks versus 50.7% in December. Many German companies’ export expectations “brightened” as well. Companies in the services sector reported lower current situation satisfaction than their manufacturing counterparts. We were not surprised that in Germany’s case manufacturers sentiment mostly exceeded that reflected in services because German manufacturers are seen generally as one of the greatest beneficiaries of China’s reopening. We view this survey as another indication that Europe most likely will not experience a recession in 2023.
U.S. Unemployment Insurance Claims
Initial claims for unemployment insurance declined 6,000 from the previous week’s downwardly revised value to 186,000 for the week that ended January 21. This was the lowest reading since April, and it was below the expectations of 205,000. The four-week moving average fell 9,259 to 197,500 – lowest since May. On a non-seasonally adjusted basis, initial claims fell 63,849 to 224,481. Continuing claims for the week that ended January 14 increased by 20,000 from the previous week’s revised level to 1.67 million, which was above consensus expectations. The previous week’s level was revised 8,000 higher. The four-week moving average fell 10,750 to 1.664 million. These claims for unemployment insurance benefits continue to reflect a very tight U.S. labor market.
U.S. Real Q4 GDP Growth
The “advance estimate” of real Q4 GDP growth was 2.9% versus an expected 2.6% increase and compared to a 3.2% growth rate for Q3. However, some of the “details” of this report disappointed. Consumer spending rose 2.1% on an annualized basis versus 2.3% in Q3, and below forecasts of 2.5%, even as nominal disposable income grew by a higher than expected 6.5%. The combination of lower spending and higher disposable income resulted in the savings rate increasing to 2.9%. This is about 0.4% above many estimates as it still remains at a relatively low level. We will monitor closely the savings rate. We believe that a gradual increase could be a good indication of a “soft landing” for the U.S. economy. Annualized equipment spending was unexpectedly 3.8% lower. Government spending surprised to the upside by increasing at a 3.7% annualized rate. Excluding government, real final sales to private domestic purchasers increased 0.2%, which was the weakest quarterly increase since the recovery began. Trade and inventories accounted for more than two thirds of GDP growth in the fourth quarter. Net exports added 0.6% as exports fell 1.3% and imports were 4.6% lower. Inventories added 1.46% to Q4 GDP growth after a drop in the previous two quarters. Inventories accounted for slightly more than half of Q4 real GDP growth. Residential construction continued to contract – negative 26.7% in Q4 versus negative 27.1% in Q3. Domestic final sales rose 0.8% after increasing 1% in the first three quarters of the year. For all of 2022 GDP grew 2.1%. The PCE price indexes came in close to expectations as they declined relative to Q3 readings. The headline PCE price increased 3.2%. The core PCE price index rose 3.9% compared to a 4.7% Q3 increase.
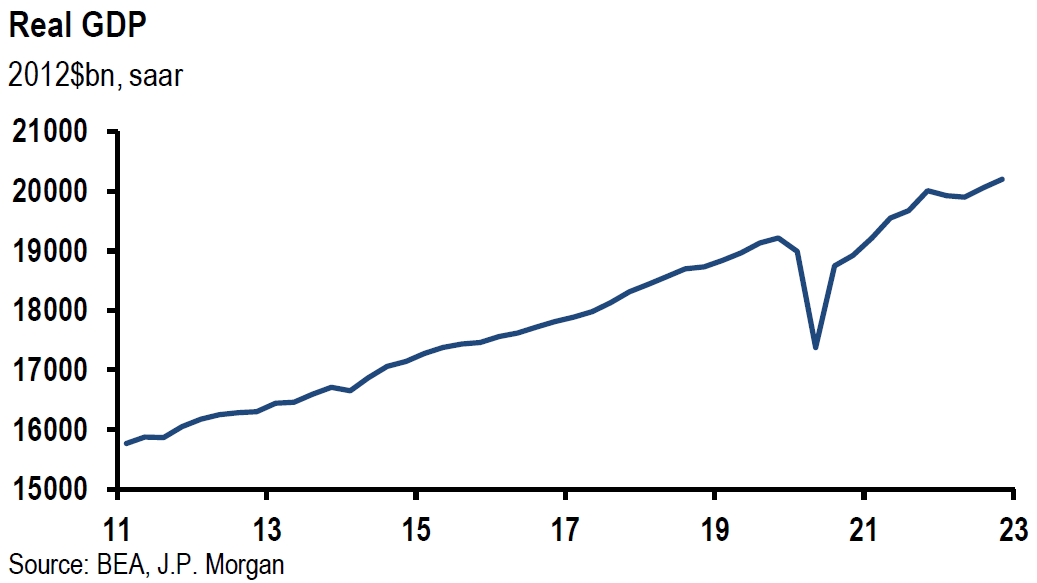
Source: US: JP Morgan, Real GDP up 2.9% in 4Q, but details disappoint (1-26-2023)
December U.S. Durable Goods Orders
Durable goods orders increased 5.6% month-over-month (m/m) in December versus an expected increase of 2.5%. This was the largest monthly gain since July 2020. The 16.7% increase m/m in the volatile transportation equipment segment – mostly aircraft orders – accounted for this surprise. Excluding transportation, new durable goods orders decreased 0.1% m/m. The median forecast for this latest figure was 0.2% lower m/m, which contrasted against a gain of 0.1% m/m in November. Illustrating the volatility in transportation orders, the headline durable goods number for November showed a 1.7% decrease m/m. The November drop in durable goods orders was the steepest decline in 2022. Durable goods orders increased 10.5% when compared to 2021.
December U.S. Trade Deficit Widens
December’s trade deficit widened by 8.8% to $90.3 billion. November’s $82.9 billion deficit was close to a two-year low. Exports shrank 1.6% m/m and imports rose 1.9% after November’s sharp decline. Wholesale inventories increased 0.1% m/m and 17.8% y/y. Retail inventories advanced 0.5% m/m and 13.9% y/y.
NABE Business Conditions Survey
The National Association for Business Economics (NABE) business conditions survey is a quarterly survey of its members. The latest survey was conducted between January 4 and 11 and presents responses from sixty of its members. Concerns of a 2023 U.S. recession remain widespread. In the latest survey, 56% of respondents believe that we are either already in a recession or that the odds are over 50% that we will enter a recession within the next year. Three months ago, this figure was 64%. For the first time since 2020, more respondents expected falling rather than increasing levels of employment at their respective firms. Continued wage growth and weaker sales were expected to put pressure on profit margins. The latest quarterly poll showed that inflation was expected to “ease” in their respective companies or industries. A forward-looking gauge for prices charged fell by 10% since the last quarterly survey to its lowest reading since October 2020.
Bank of Canada Hikes and Indicates a “Pause”
The Bank of Canada (BOC) raised its key overnight rate by 25 basis points (bps) this week and indicated its intention to “pause” any further hikes, becoming the first major central bank (CB) to so indicate. This week’s hiking of rates was the eighth consecutive hike that brought BOC’s key rate to 4.5% — its highest level since 2007. BOC’s press release was clear: “If economic developments evolve broadly in line with the (Monetary Policy Report) outlook, the Governing Council expects to hold the policy rate at its current level while it assesses the impact of cumulative rate increases.” The BOC reiterated its commitment to reining in inflation, stating that it is “prepared to increase the policy rate further if needed to return inflation to its 2% target and remains resolute in its commitment to restoring price stability for Canadians.” In its quarterly monetary report released mid-week, the BOC expects economic growth to “stall” through the middle of 2023 and expects Canada’s 2023 GDP to grow by 1%. The BOC expects the rate of inflation to fall to about 3% in mid-2023 and to reach 2% sometime in 2024. The BOC’s most recent business outlook showed that business sentiment continued to weaken as interest rates rose. Canada’s rate of inflation was 6.3% y/y in December, down from its June peak of 8.1%.
U.S. Housing Market – Possible Bottom?
New home sales of single-family homes in December increased 2.3% m/m to seasonally adjusted rate of 616,000 units – its highest value in four months. The y/y rate of new home sales fell 26.6%. The remaining inventory of new single-family homes for sale was 461,000 at the end of December, which represented nine months supply at the current sales pace. There were a total of 644,000 new homes sold in 2022. This was 16.4% below the 2021 level and was the lowest level in four years. December was the third consecutive month of increasing sales on a m/m basis.
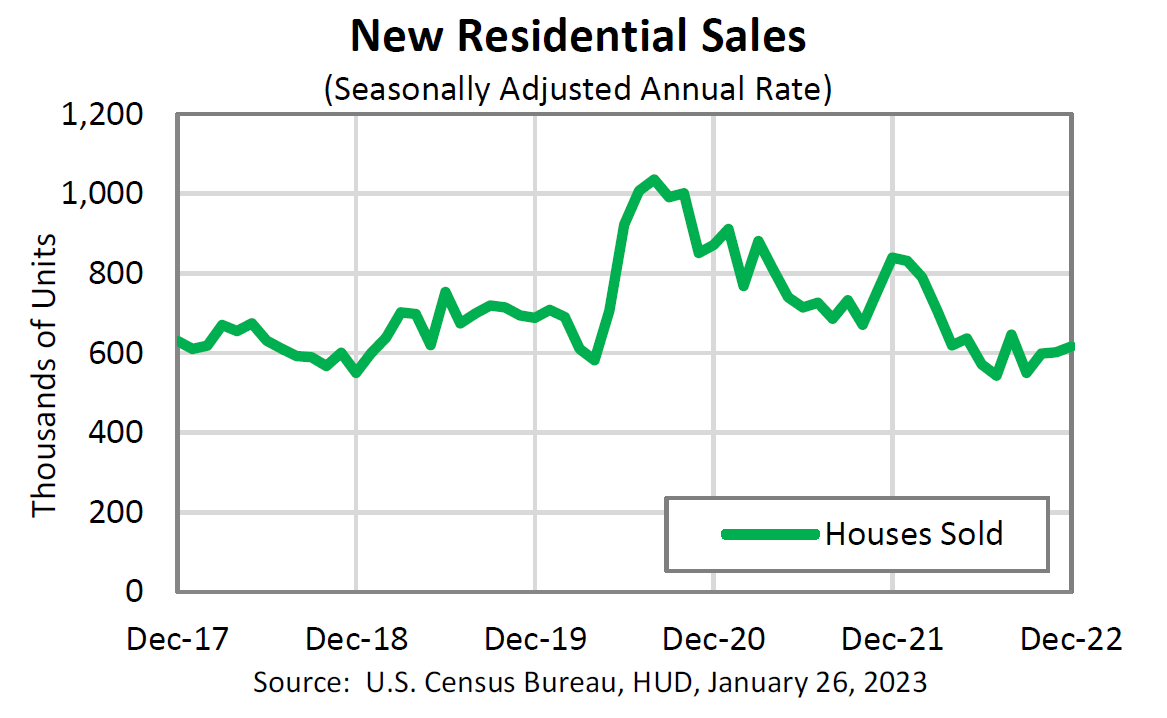
Source: U.S. Census Bureau, Monthly New Residential Sales, December 2022 (1-26-2023)
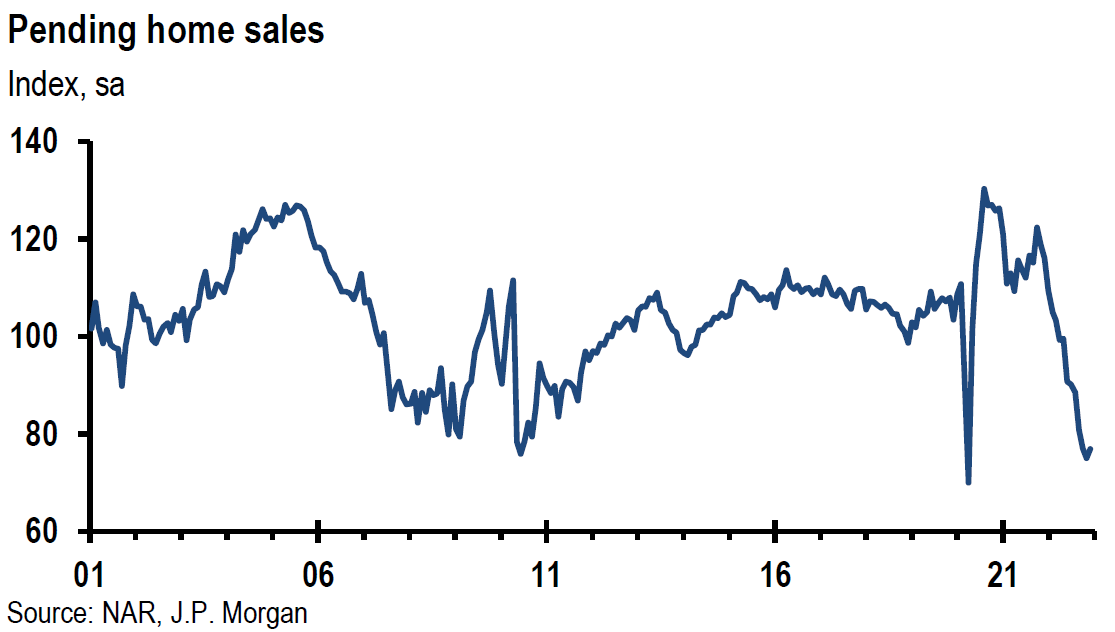
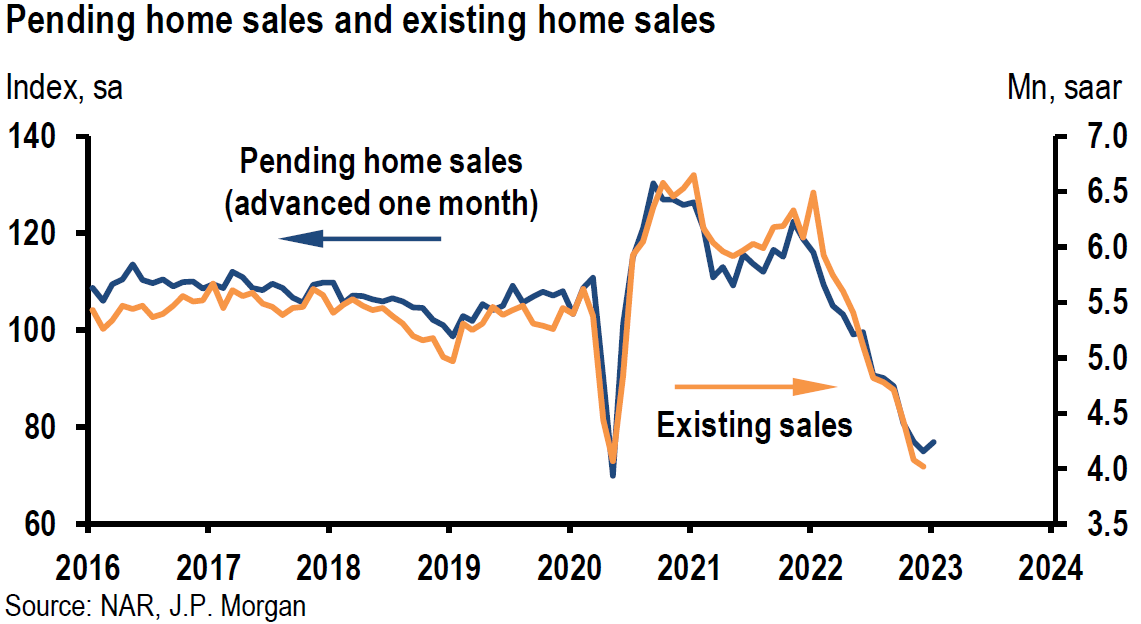
Source: JP Morgan, US: Pending home sales rise, consumer sentiment revised up (1-27-2023)
Pending home sales for December increased 2.5% in contrast to an expected decrease. November’s sales figures were revised higher.
Regional Fed Surveys
Philadelphia NonManufacturing Survey
Responses were compiled from January 9 to 19. The current general activity index increased to 12.7 from a revised 8 in December. New orders rose 13 points to 10.3, the first positive reading since July 2021. The sales/revenues index rose 23 points to a positive 20.3. Both prices paid and received were higher, but prices paid increases were less widespread indicating a possible increase in profit margins. Prices paid irate of increase dropped 6 points to 46.1, the lowest reading since June 2021. The full-time employment index increased eleven points to 16.5. Most respondents expected growth over the next six months.
Richmond Fed Manufacturing Survey
The Richmond Fed manufacturing survey fell further and more than expected into contractionary territory in January. The shipments, new orders and employment components of the report all decreased. The manufacturing index decreased by twelve points to a negative -11 (lowest since May 2020) versus an expected reading of -5. Shipments dropped 8 points to -4, new orders fell 0 points to -24 and employment dropped 6 points to -3. The prices paid index fell 1.2 points to 7.91% as prices paid continued to climb. The prices received index was unchanged, suggesting a possible margin compression.
Kansas City Fed Manufacturing Survey
Regional factory activity was “basically flat” in January. Many firms expected business conditions to improve over the next six months as they expected to see slowing of prices increase over the next six months. Many indexes remained negative but the pace of decline slowed versus December. New orders for exports and finished goods inventories both moved into negative territory this month.
U.S. December Personal Income, Outlays and PCE Inflation
Personal income rose 0.2% m/m in December, versus a downwardly revised monthly increase of 0.3% in November. December’s increase was the smallest increase since April. Personal consumption expenditures (PCE) decreased 0.2% m/m. Spending for November was revised lower from an increase of 0.1% m/m to a decrease of 0.1%. The PCE price index rose 0.1% m/m. The core PCE price index (excluding food and energy) rose 0.3% m/m after increasing 0.2% in November. Prices for goods decreased 0.7% while prices for services were 0.5% higher m/m. Food prices increased 0.2% and energy prices decreased 5.1% m/m. The headline PCE price index was 5.0% higher y/y versus November’s y/y increase of 5.5% and was the third consecutive monthly decline. Prices for goods rose 4.6% y/y and were 5.2% higher y/y for services. Food prices increased 11.2% y/y and energy prices increased 6.9% y/y. The core PCE price index was 4.4% higher y/y compared to November’s 4.7% y/y increase. The PCE price indexes are the Fed’s preferred measures of inflation. Most of this data was close to expectations.
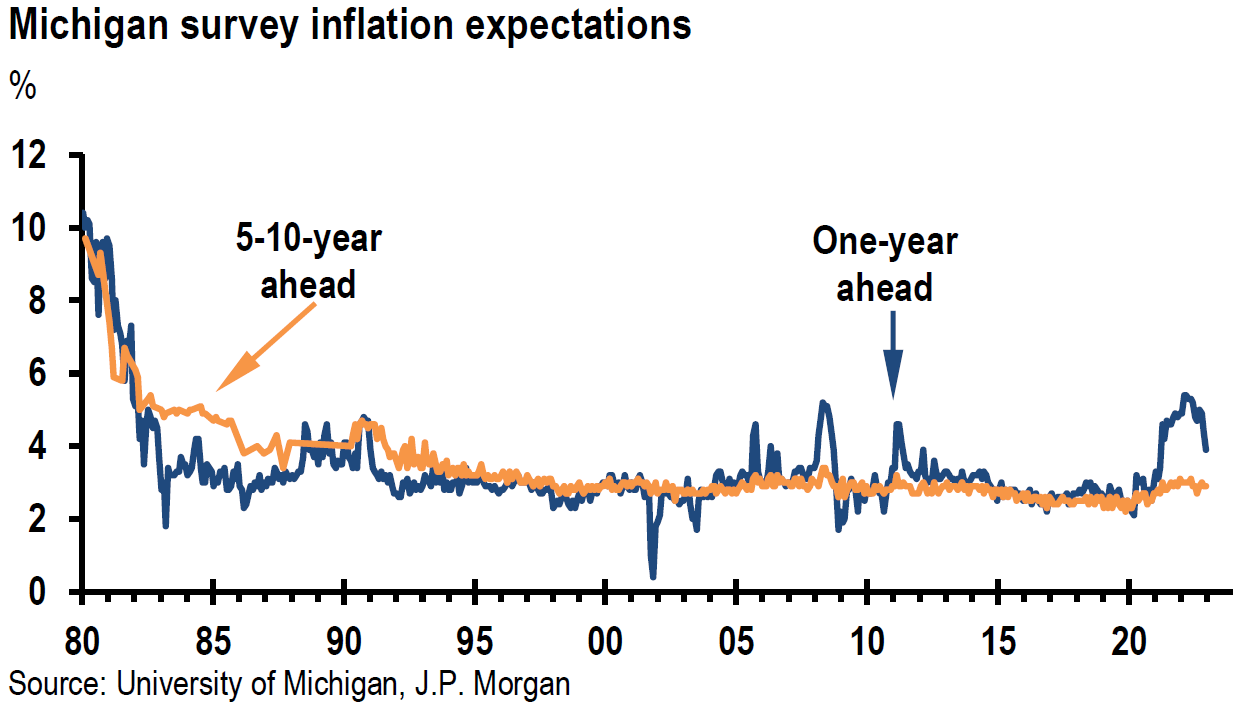
University of Michigan Consumer Sentiment
The final results for many of the components of the preliminary strong sentiment figures were even higher in the final results for January. Inflation expectations for the year ahead were revised lower to 3.9% from the preliminary reading of 4.0% and from December’s 4.4% reading. The current reading is the lowest since April 2021. The five-year inflation outlook was revised lower to 2.9% from 3.0%. Two-thirds of consumers surveyed expect an economic downturn during the next year.
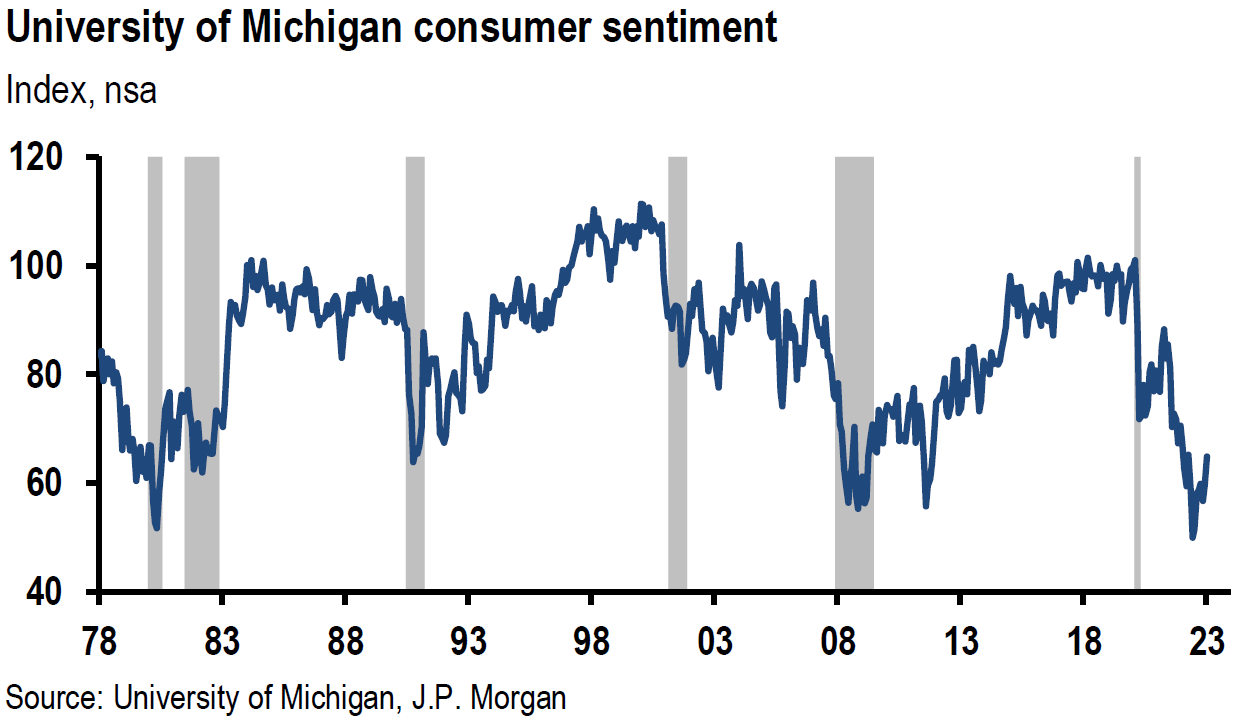
Source: JP Morgan, US: Pending home sales rise, consumer sentiment revised up (1-27-2023)
January Tokyo Inflation Hits 42-Year High
Tokyo’s Consumer Price Index (CPI) rose to 4.4% y/y versus an expected increase of 4.0% which would have matched December’s increase. CPI excluding Fresh Food increased 4.3% y/y versus 4.2% expected and 4.0% for December. The 4.3% increase is the largest since May 1981. Core CPI (excluding food and energy) was 3.0% higher y/y versus an expected increase of 2.9% and December’s reading of 2.7%. The January readings of inflation showed a broadening of price pressures on core goods and services. Core goods prices rose 0.7% m/m and services prices gained 0.5% m/m after a 0.1% increase in December. We expect that these strong inflation readings will keep pressure on the Bank of Japan (BOJ) to modify its yield control policy (YCC). For the time being, we expect the YCC policy to remain in place. Japan’s sovereign 10-year bond yield continued its march back towards 0.5%. We believe that these inflation figures released at week’s end can partly explain the rise in U.S. Treasury yields on Friday.
Bottom Line
For the time being, we are maintaining our basic investment approach as expressed in last week’s commentary. We continue to prefer high quality big cap stocks that offer good balance sheets, as well as relatively stable cash flows and profit margins. We prefer a very diversified global portfolio for long term investors.
This week highlighted the importance of stock selectivity in addition to maintaining a well-diversified portfolio. The information we analyzed this week confirms that Europe should avoid a recession this year. China’s reopening is expected be beneficial for Europe, and especially for Germany. Many other countries should benefit as well, which might cause their economic growth rates to gain relative to the U.S.
Higher inflation rates in Japan should eventually lead to a modification of BOJ’s yield control policy. We expect that could put upward pressure on global interest rates and perhaps result in a less liquid market for U.S. Treasuries. The BOC became the first major CB to indicate a “pause” in its rate hikes. The U.S. is not immune from developments in foreign countries.
Definitions
Manufacturing Purchasing Managers’ Index PMI – A manufacturing Purchasing Managers’ Index (PMI) is a survey-based economic indicator designed to provide a timely insight into changing business conditions in the goods-producing sector.
Services Purchasing Managers’ Index PMI – A services Purchasing Managers’ Index (PMI) is a survey designed to better understand changing business conditions in the wider economy. Coverage includes financial services, consumer services and all other business services.
Composite Purchasing Managers’ Index PMI – A composite Purchasing Managers’ Index (PMI) is the weighted average of manufacturing and service sector PMIs for a given geography or economy.
Headline Consumer Price Index (Headline CPI) – Headline inflation is the raw inflation figure reported through the Consumer Price Index (CPI) that is released monthly by the Bureau of Labor Statistics (BLS). The CPI calculates the cost to purchase a fixed basket of goods to determine how much inflation is occurring in the broad economy. The CPI uses a base year and indexes the current year’s prices, according to the base year’s values.
Core Consumer Price Index (Core CPI) – Core inflation removes the CPI components that can exhibit large amounts of volatility from month to month, which can cause unwanted distortion to the headline figure. The most commonly removed factors are those relating to the costs of food and energy. Food prices can be affected by factors outside of those attributed to the economy, such as environmental shifts that cause issues in the growth of crops. Energy costs, such as oil production, can be affected by forces outside of traditional supply and demand, such as political dissent.
Ifo Business Climate Survey – The Ifo Business Climate Survey is a leading indicator of German economic activity, compiled by the Munich-based Ifo Institute for Economic Research.
Eurozone – The eurozone, officially known as the euro area, is a geographic and economic region that consists of all the European Union countries that have fully incorporated the euro as their national currency.
Basis Points (bps) – A basis point is one hundredth of one percent, used chiefly in expressing differences of interest rates.
Durable Goods – Durable goods derive their name from the fact that they last in value for a relatively long time. An individual’s wealth is preserved by spending a high proportion of their income on durable, investment, or capital goods, because the goods retain their economic value for longer periods of time.
Initial Unemployment Insurance Claims – Initial claims are new jobless claims filed by U.S. workers seeking unemployment compensation, included in the unemployment insurance weekly claims report.
Continuing Claims – Continuing claims track the number of U.S. residents filing for ongoing unemployment benefits in a given week. Continuing claims measure ongoing unemployment benefits, which is in contrast to initial claims, which track new filings for benefits.
Pain Trade – “Pain trade” is the tendency of markets to deliver the maximum amount of punishment to as many investors as possible from time to time. A pain trade occurs when a popular asset class or widely followed investing strategy takes an unexpected turn that catches most investors flat-footed.
Price/Earnings Ratio – The price-to-earnings ratio is the ratio for valuing a company that measures its current share price relative to its earnings per share (EPS). The price-to-earnings ratio is also sometimes known as the price multiple or the earnings multiple.
Flash Composite PMI – The flash Composite Purchasing Managers’ Index (PMI) provides an early estimate of current private sector business activity by combining information obtained from surveys of the manufacturing and service sectors of the economy.
Real GDP – Real gross domestic product (GDP) is an inflation-adjusted measure that reflects the value of all goods and services produced by an economy in a given year. Real GDP is expressed in base-year prices. It is often referred to as constant-price GDP, inflation-corrected GDP, or constant dollar GDP. Put simply, real GDP measures the total economic output of a country and is adjusted for changes in price.
Headline PCE Inflation – A measure of the prices that people living in the United States, or those buying on their behalf, pay for goods and services. The PCE price index is known for capturing inflation (or deflation) across a wide range of consumer expenses and reflecting changes in consumer behavior.
Core PCE Inflation – A measure of the prices that people living in the United States, or those buying on their behalf, pay for goods and services that excludes food and energy prices. The core PCE gives a more accurate reading of inflation because food and energy are very volatile parts of the economy.
Growth Stock – A growth stock is any share in a company that is anticipated to grow at a rate significantly above the average growth for the market. These companies generally do not pay dividends, instead growth stocks tend to reinvest any earnings they accrue in order to accelerate growth in the short term.
Leading Economic Indicators Conference Board (LEI) – The components of The Conference Board Leading Economic Index for the U.S. include:
- Average weekly hours in manufacturing – The average hours worked per week by production workers in manufacturing industries tend to lead the business cycle because employers usually adjust work hours before increasing or decreasing their workforce.
- Average weekly initial claims for unemployment insurance – The number of new claims filed for unemployment insurance are typically more sensitive than either total employment or unemployment to overall business conditions, and this series tends to lead the business cycle.
- Manufacturers’ new orders for consumer goods and materials – These goods are primarily used by consumers. The inflation-adjusted value of new orders leads actual production because new orders directly affect the level of both unfilled orders and inventories that firms monitor when making production decisions.
- ISM Index of New Orders – This index reflects the levels of new orders from customers. As a diffusion index, its value reflects the number of participants reporting increased orders during the previous month compared to the number reporting decreased orders, and this series tends to lead the business cycle.
- Manufacturers’ new orders for nondefense capital goods excluding aircraft orders – This index, combing with orders from aircraft (in inflation-adjusted dollars) are the producers’ counterpart to consumer goods and materials.
- Building permits for new private housing units – The number of residential building permits issued is an indicator of construction activity, which typically leads most other types of economic production.
- S&P 500 Index of Stock Prices – The Standard & Poor’s 500 stock index reflects the price movements of a broad selection of common stocks traded on the New York Stock Exchange.
- Leading Credit Index – This index is consisted of six financial indicators: 2-years Swap Spread (real time), LIBOR 3 month less 3 month Treasury-Bill yield spread (real time), Debit balances at margin account at broker dealer (monthly), AAII Investors Sentiment Bullish (%) less Bearish (%) (weekly), and Senior Loan Officers C&I loan survey
- Interest rate spread (10-year Treasury bonds less federal funds rate) – The spread or difference between long and short rates is often called the yield curve.
- Average consumer expectations for business condition – This index reflects changes in consumer attitudes concerning future economic conditions.
IMPORTANT DISCLOSURES
The views and opinions included in these materials belong to their author and do not necessarily reflect the views and opinions of NewEdge Capital Group, LLC.
This information is general in nature and has been prepared solely for informational and educational purposes and does not constitute an offer or a recommendation to buy or sell any particular security or to adopt any specific investment strategy.
NewEdge and its affiliates do not render advice on legal, tax and/or tax accounting matters. You should consult your personal tax and/or legal advisor to learn about any potential tax or other implications that may result from acting on a particular recommendation.
The trademarks and service marks contained herein are the property of their respective owners. Unless otherwise specifically indicated, all information with respect to any third party not affiliated with NewEdge has been provided by, and is the sole responsibility of, such third party and has not been independently verified by NewEdge, its affiliates or any other independent third party. No representation is given with respect to its accuracy or completeness, and such information and opinions may change without notice.
Investing involves risk, including possible loss of principal. Past performance is no guarantee of future results.
Any forward-looking statements or forecasts are based on assumptions and actual results are expected to vary from any such statements or forecasts. No assurance can be given that investment objectives or target returns will be achieved. Future returns may be higher or lower than the estimates presented herein.
An investment cannot be made directly in an index. Indices are unmanaged and have no fees or expenses. You can obtain information about many indices online at a variety of sources including: https://www.sec.gov/fast-answers/answersindiceshtm.html or http://www.nasdaq.com/reference/index-descriptions.aspx.
All data is subject to change without notice.
© 2024 NewEdge Capital Group, LLC


