
Key Takeaways on Recent Market Activity:
- We expected heightened volatility this year and have been prioritizing active stock selection, focusing on companies with strong balance sheets, moderate valuations, and pricing power that can help sustain margins.
- Market corrections are more common than investors realize and have occurred roughly once every two years dated back to 1928. Additionally, corrections are an even more common occurrence during the current business cycle.
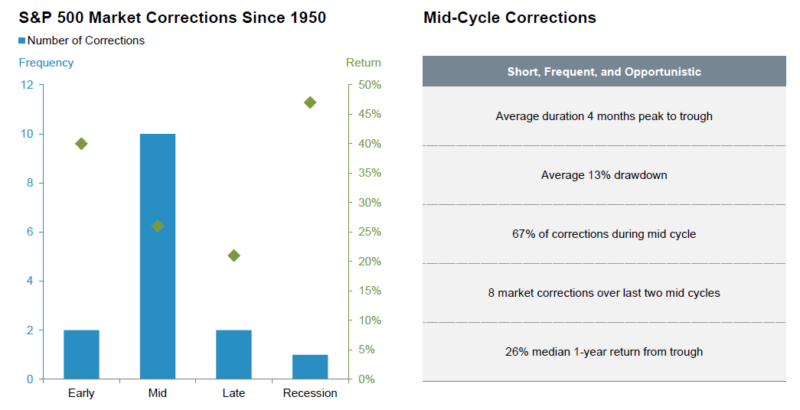
- Since 1950, the average mid-cycle correction has been a drawdown of 13% from peak to trough, however, the subsequent 12-month median market return from trough is 26%.
- Investors can apply simple rules to help manage the emotional aspect of a market correction, which are outlined below.
- While we expect continued volatility in the near-term, we view this recent selloff as an opportunity to modestly average in to targeted risk assets for clients who own cash.
Views From the NewEdge Investment Team:
As discussed in our 2022 year ahead outlook “Get Your Lies Straight,” we anticipate elevated market volatility throughout this year as policy makers navigate the trade-off between inflation and growth. Thus far, our expectations are playing out and the velocity of the recent downturn in global equity markets has certainly grabbed the attention of investors. In light of this volatility, we wanted to share a few key market statistics that may help put in context where we stand today and where we think markets may be going.
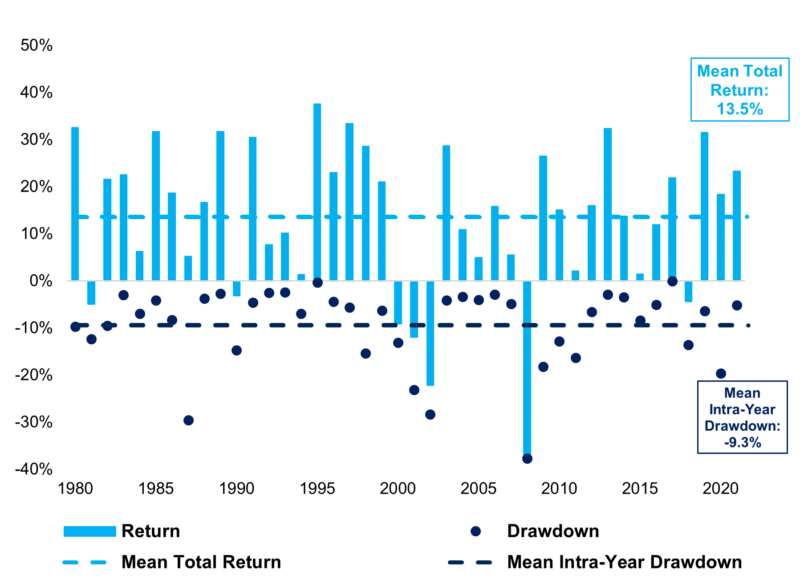
Heightened volatility is not always a recipe for lower market returns, and surprisingly equity market corrections, defined as drawdowns of 10-20% from prior peaks, are more common than many investors realize, occurring in over 60% of the years since 1928[1]. In fact, since 1983, the S&P 500 has a seen mean intra-year drawdown of 9.3%, however, the mean calendar year return over that same period is 13.5%[2].
Taking an even more granular approach, corrections are most common during the mid-cycle phase of the business cycle, exactly where we are today. Since 1950, two-thirds of all corrections have occurred during the mid-cycle phase, with an average drawdown of 13%, yet the subsequent 12-month performance is quite strong with a median return of 26% from trough[3].
Lastly, we believe it is important to consider the variance in market returns, which rarely align with long-term averages. While over the last 50 years the S&P 500 has produced annualized returns of 10.9%, returns of 0-10% have only occurred about 18% of the time and returns of 10-20% have only occurred about 26% of the time[4]. Said another way, returns of greater than 20% or less than 0% occur more than half of the time! Return variance and volatility are the cost of doing business as an equity investor and it is important to not let corrections drive emotional decisions that can be detrimental to long-term success.
Rules to Help Manage the Emotion of a Market Correction:
1. Tune out the noise.
Our brains are hard-wired to direct more attention towards threats in our environment. Paying too much attention towards untimely news comes at the direct expense of retaining valuable information[5].
2. Stay the course.
To evacuate during a hurricane is generally unwise. In most cases, you either leave before, or you ride out the storm. Bull markets have corrections and markets can’t always go up. When corrections do occur, it is unpleasant, but in the long run, they are healthy, and they present opportunity.
3. Trust the pilot.
Turbulence is uncomfortable, but it’s often best to stay in your seat and buckled up. We’ve been through this before and we’ll get through it again.
Sources
- “How Often Should You Expect a Stock Market Correction” – A Wealth of Common Sense ↑
- Morningstar, as of December 20, 2021. Returns represented by S&P 500 Index. Use of Indices and Benchmark Return Indices cannot be invested in directly. Index performance is reported gross of fees and expenses and assumes the reinvest dividends and capital gains. Past performance does not indicate future performance and there is a possibility of a loss. See disclosure page for indices representing each asset class. ↑
- Fidelity Quarterly Market Update ↑
- Average Stock Market Return – The Motley Fool ↑
- “Organize Your Brain for Success: Reducing Excess and Negative Noise” – Wharton Work ↑
IMPORTANT DISCLOSURES
The views and opinions included in these materials belong to their author and do not necessarily reflect the views and opinions of NewEdge Capital Group, LLC.
This information is general in nature and has been prepared solely for informational and educational purposes and does not constitute an offer or a recommendation to buy or sell any particular security or to adopt any specific investment strategy.
NewEdge and its affiliates do not render advice on legal, tax and/or tax accounting matters. You should consult your personal tax and/or legal advisor to learn about any potential tax or other implications that may result from acting on a particular recommendation.
The trademarks and service marks contained herein are the property of their respective owners. Unless otherwise specifically indicated, all information with respect to any third party not affiliated with NewEdge has been provided by, and is the sole responsibility of, such third party and has not been independently verified by NewEdge, its affiliates or any other independent third party. No representation is given with respect to its accuracy or completeness, and such information and opinions may change without notice.
Investing involves risk, including possible loss of principal. Past performance is no guarantee of future results.
Any forward-looking statements or forecasts are based on assumptions and actual results are expected to vary from any such statements or forecasts. No assurance can be given that investment objectives or target returns will be achieved. Future returns may be higher or lower than the estimates presented herein.
An investment cannot be made directly in an index. Indices are unmanaged and have no fees or expenses. You can obtain information about many indices online at a variety of sources including: https://www.sec.gov/fast-answers/answersindiceshtm.html or http://www.nasdaq.com/reference/index-descriptions.aspx.
All data is subject to change without notice.
© 2024 NewEdge Capital Group, LLC


