

Weekly Summary: February 13 – February 17
Key Observations:
- It is our contention that perhaps part of the explanation for the rise in U.S. equities this year and their continued resilience in the face of rising interest rates is that, as described in last week’s commentary, the “lags” between tighter financial conditions and tightening monetary policy on the one hand, and their effects on economic growth on the other, are much shorter than many investors and analysts expect. Their impact on economic growth may already be fading. The impact on inflation is expected to take somewhat longer. Many investors and analysts continue to assume that the “lagging” effects will take much longer before they will be reflected in slowing economic growth. A shortened lag time would mean a postponement of further decreasing sales and earnings. This would be supportive of stock prices. But the downside would be a more than anticipated Fed tightening with a federal funds rate that would be “higher for longer.” This latter scenario could have bullish implications for stocks if wage growth and inflation rates would decrease more quickly than anticipated. The Federal Reserve’s (Fed) recently stated “data dependent” approach could make implementing its monetary policies seem like they were navigating through “minefields.” Fed chair Powell has admitted that these lag times remain an uncertain variable. This makes any investment approach more uncertain as well. We will continue to have an “open mind.” Given these many uncertainties, we maintain that a global, well-diversified portfolio could be the best investment strategy for many long-term investors.
- There are a myriad of other reasons that might at least partially explain the powerful equity rally in general this year and the resilience of equity prices. We stated last year that the “pain” trade would be a stock rally to begin 2023, given the bearishness of many investors and traders and “light” or even “short” positions. The very favorable seasonal patterns for this time of year and as further amplified by the third year of a Presidential cycle most likely were also contributing factors. Many investors also became convinced that the U.S. economy, as well as many other foreign economies appeared stronger than anticipated and that the inflation trajectory could be more of a quickened disinflationary and somewhat sustainable pace.
- J.P. Morgan (JPM) has commented often on extensive short covering this year by many hedge funds. This has been true especially with technology stocks. Goldman Sachs (Goldman) has also noticed. A February 16 Reuters report quotes Goldman. “The short covering in U.S. tech stocks from January 31st to February 15th is the second largest in magnitude over any 12-dayperiod in the past decade.” According to this Reuters report, JPM “said multi-strategy and equity quantitative hedge funds had led the short covering, while equity long-short funds had been ahead in bets against stocks.” Retail investors have also been unusually large buyers of stocks this year as well.
- Given the rapidity of change in the U.S. economy and the many possible “distortions” of economic data from seasonal adjustments we remain reluctant to draw many conclusions from only the latest month’s economic data. This is particularly the case for data in regard to starting a new year. We expect the Fed to hike the federal funds rate by 25 basis points (bps) at its next two meetings. We will wait to review more incoming economic data before we forecast the Fed’s actions at its June meeting. We maintain our view that the Fed will not cut rates this year and that the U.S. will most likely avoid a recession this year or that it might only be a mild recession. However, we are concerned about the increasing debt burdens of the U.S, consumer.
The Upshot: Our general investment approach remains the same as depicted in last week’s commentary. We maintain our preference for quality stocks with good balance sheets, relatively stable cash flows with stable margins. Volatility across sectors continues to be supportive of a diversified global portfolio for long term investors. We expect volatility to continue across asset classes.
As we stated last week, we believe that we have seen the lows in USD and the 10-year Treasury yield — at least in the short term. We suppose that a risk/reward analysis would no longer support “full” positions in selected equity positions. We would look to buy on downturns. We continue to stress that stock selectivity in this current financial market environment is of paramount importance. Many U.S. equities continue to show a remarkable resiliency.
Selected Observations from Last Week
In our most recent commentary, we referred to last week’s interview in which Fed Chair Powell stated that he expected to see “significant” progress on getting inflation down this year. But he thought that this “process” would be “bumpy.” We agreed. As we stated last week, “we don’t expect inflation to drop in a straight line.” Additionally, we also surmised last week, that a risk-reward analysis would no longer support “full” positions in selected equity positions. We recommended that investors looking to take advantage of the volatility in financial markets should trim long positions after substantial gains and buy on substantial downturns.
Navigating “Minefields” in Financial Markets
This week showcased the vicissitudes of both the financial markets and incoming economic data. Many companies readjust their prices at the beginning of each year. This “January effect” could be rather unpredictable. The weather was also much warmer than normal in many parts of the country this January. As we indicated in last week’s commentary, seasonal adjustments can be rather unpredictable as well. Furthermore, this week also exemplified many crosscurrents in regard to U.S. economic growth and inflation trends. It could have felt like a “minefield” to circumvent financial markets. Some of the lyrics from John Legend’s and Faouzia’s song ”Minefields” might help crystallize these feelings. As they navigate financial markets, to many investors and analysts it must feel like “these minefields that I walk through; … what I risk to be” a successful investor. Each individual must decide what risk tolerance will be appropriate for their own particular circumstance. Unfortunately, given the nature of minefields, the right path can be very difficult to spot ahead of time. But with the proper “equipment,” – knowledge and analysis – a long-term investor should be able to navigate successfully in these markets. As we stated last week, “we continue to stress that stock selectivity in this current financial market environment is of paramount importance.”
Most Anticipated Economic Data this Week
Perhaps the two most anticipated economic data released this week were the U.S. consumer price index (CPI) and the retail sales data for January. The January producer price index (PPI) was also scrutinized carefully. These three “bits” of data all exceeded expectations – stronger than expected. Taken together, this data showed a stronger-than-expected U.S. economy, a resilient consumer and generally more “sticky” inflation. Other economic data analyzed this week, reflected a more “mixed” picture.
Stronger-than-Expected U.S. January CPI
The Bureau of Labor Statistics (BLS) released U.S. January CPI on Tuesday. Headline CPI increased 0.5% month-over-month (m/m) as expected, and December was revised from a negative 0.1% to a positive 0.1%. January’s monthly gain was the firmest reading since last June. The core CPI – excluding food and energy – rose 0.4% m/m as expected and was the biggest monthly increase in four months. On a year-over-year (y/y) basis, headline CPI rose 6.4% in January – down from 6.5% y/y in December – and was the smallest twelve-month increase since the period that ended October 2021. January’s core rate was 5.6% y/y – down from December’s 5.7% rate – and was the smallest twelve month gain since the period that ended December 2021. The food index increased 0.5% m/m in January and 10.1% y/y. Energy was 2.0% higher m/m, as gasoline increased 2.4% m/m. Energy was 8.7% higher y/y. Shelter costs accounted for nearly half of the monthly headline gain, even though they account for about a third of the overall CPI index. Included in shelter are rent and owners’ equivalent rent (OER). While rent increased 0.74% m/m in January versus 0.79% in December, OER rose 0.67% versus 0.79% in December. The category of Powell’s focus – core ex-housing – rose 0.3% m/m, which was a slight easing from December’s reading. This latter category is the segment that Powell postulates could be the most “sticky” part of inflation, as he seems confident that shelter costs should decelerate by the second half of 2023.
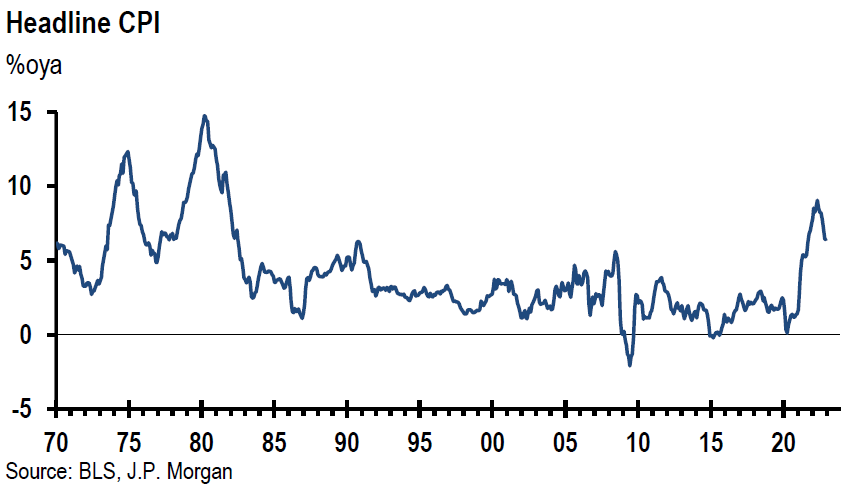
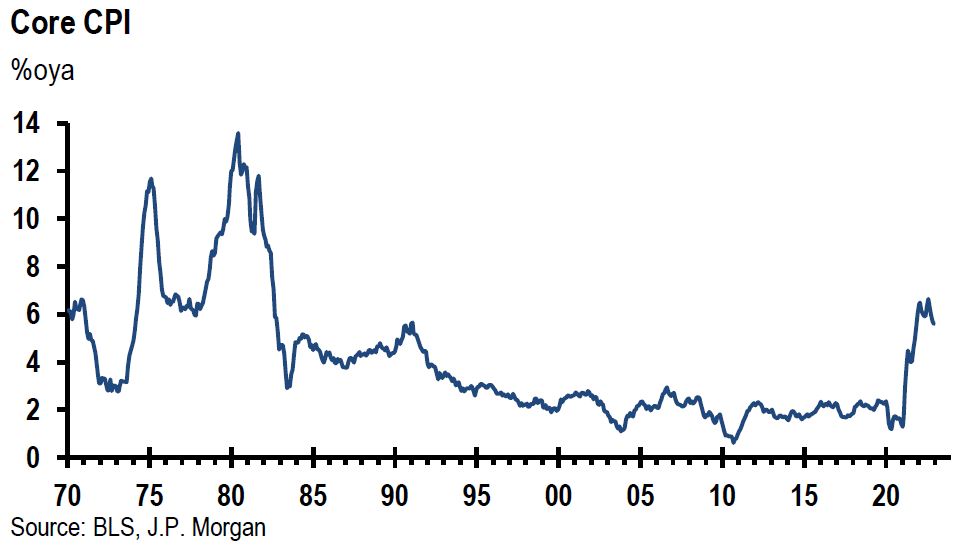
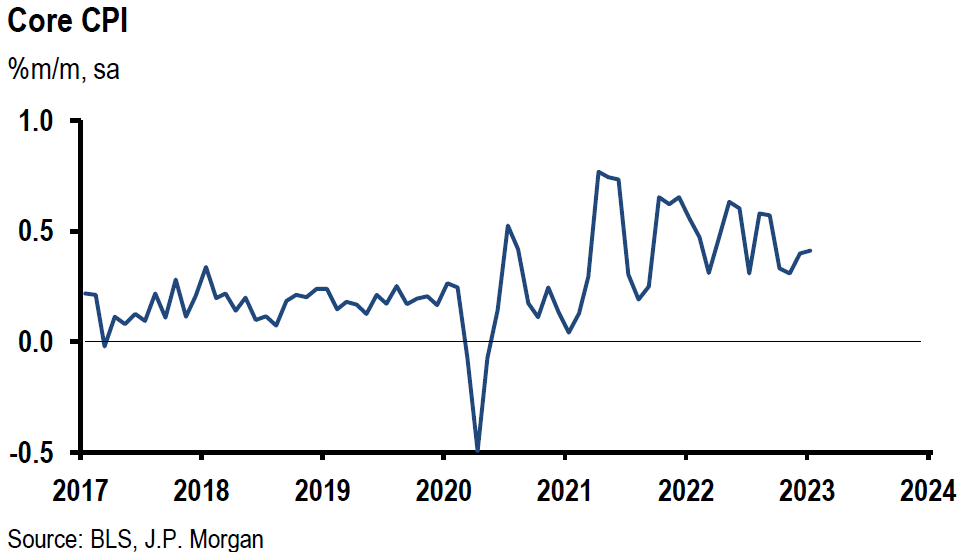
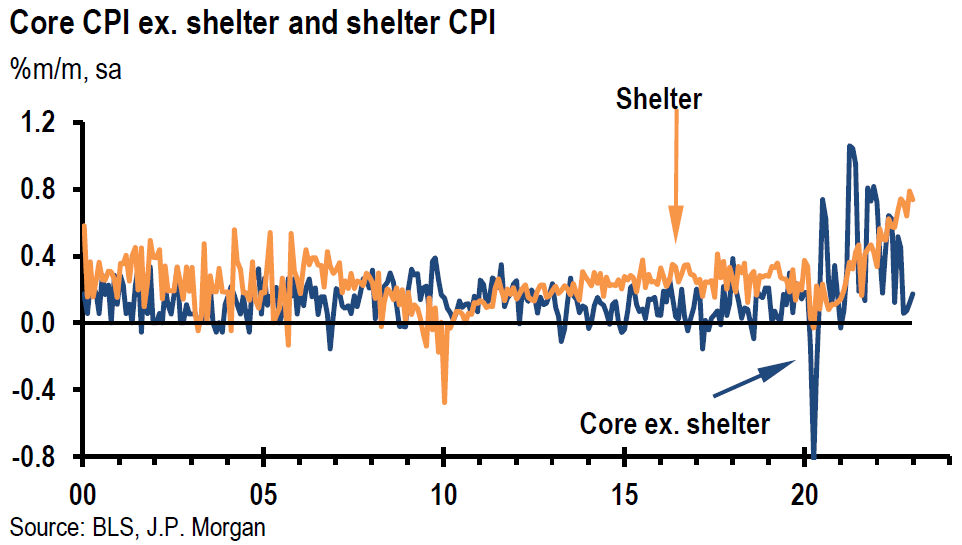
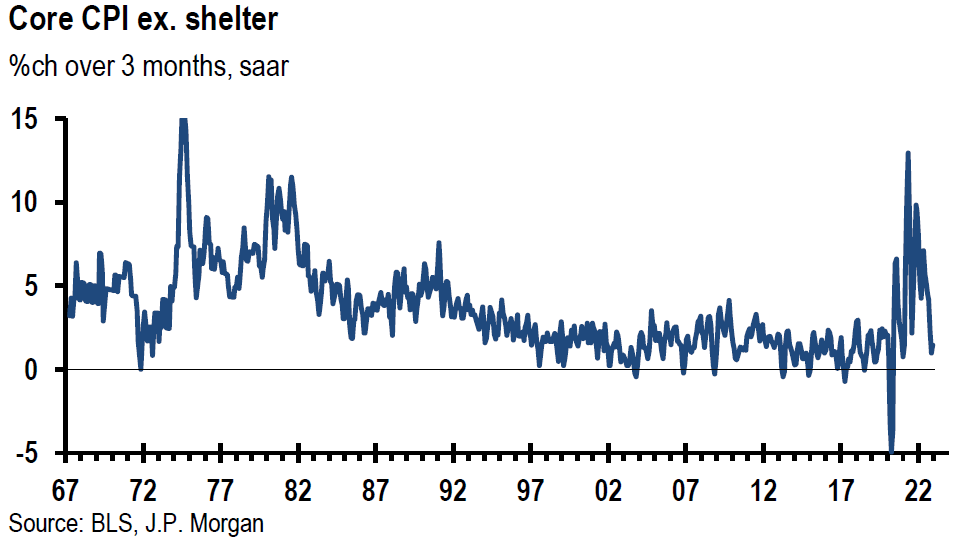
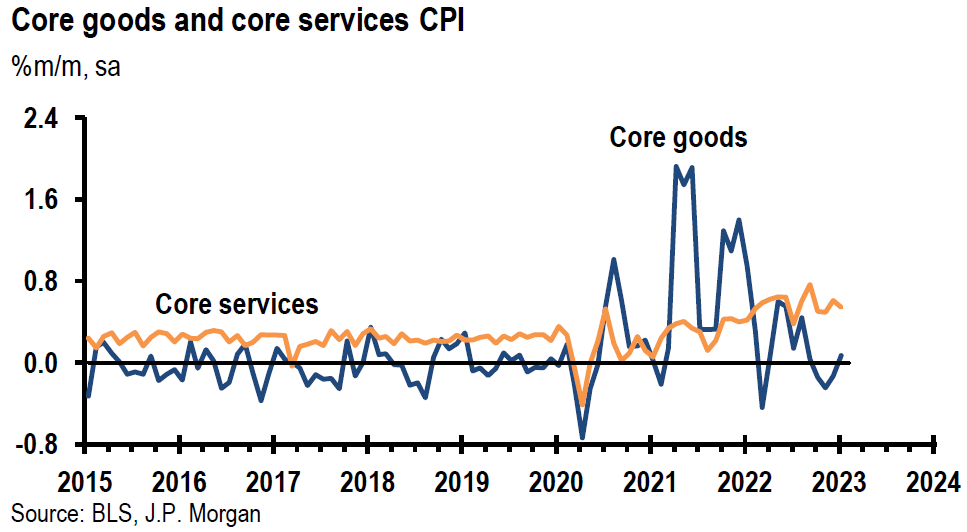
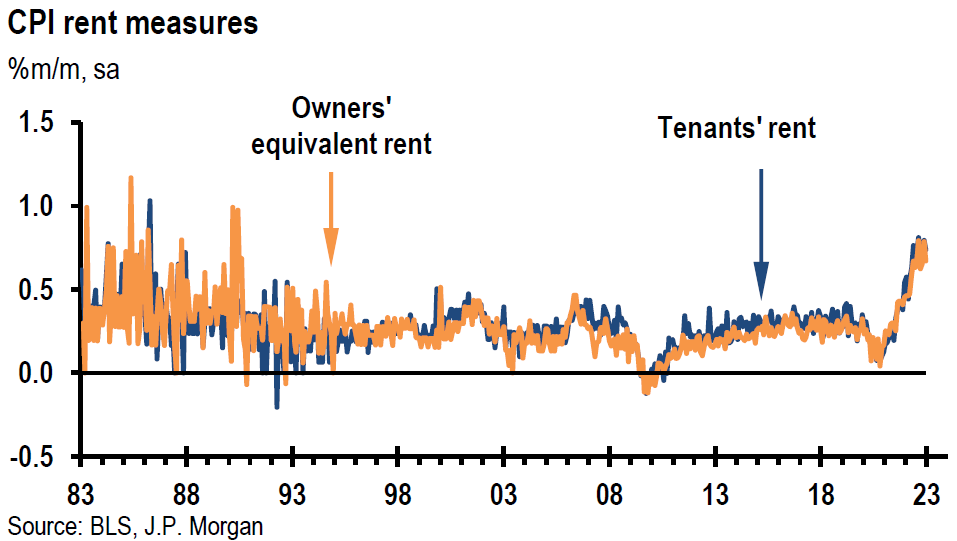
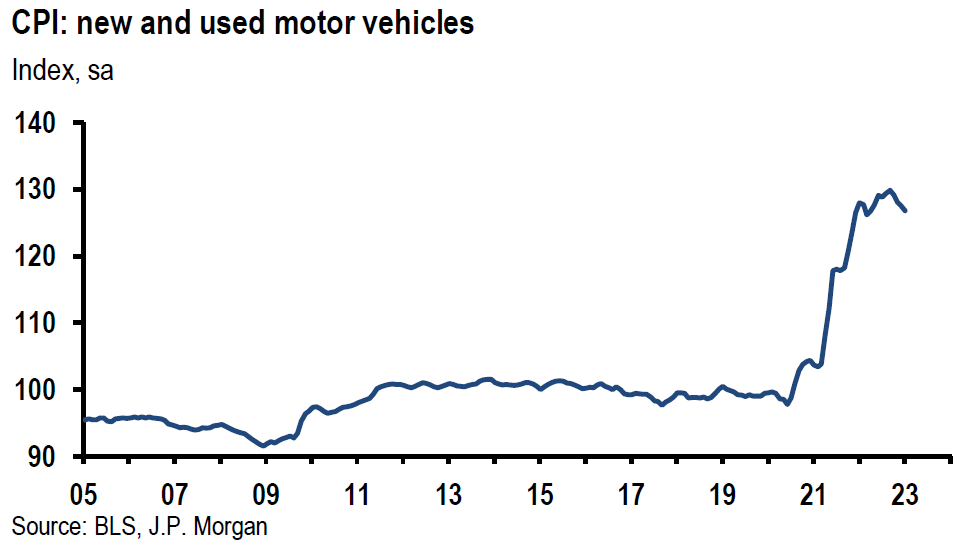
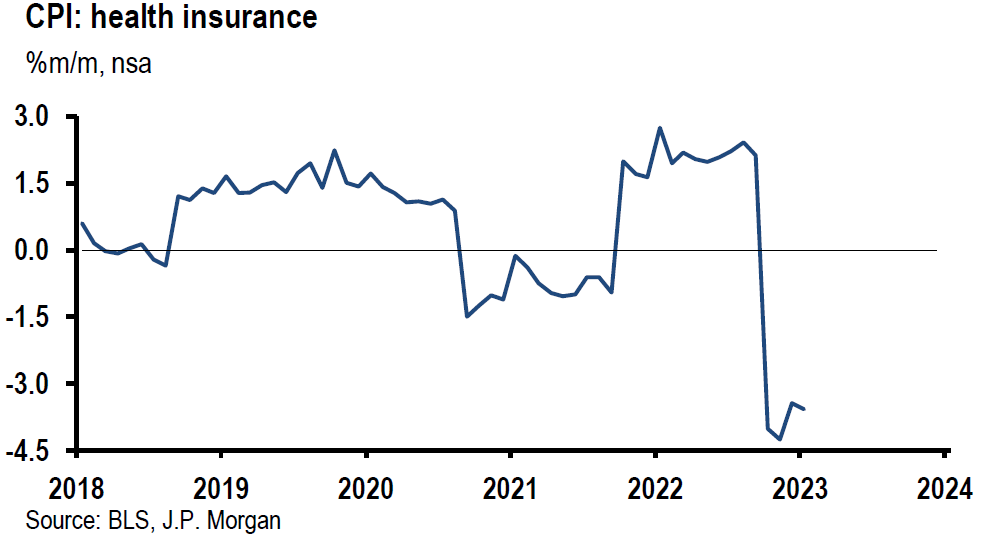
Source: JP Morgan, US: Solid monthly CPI gains, but year-ago rates move lower (2-14-2023)
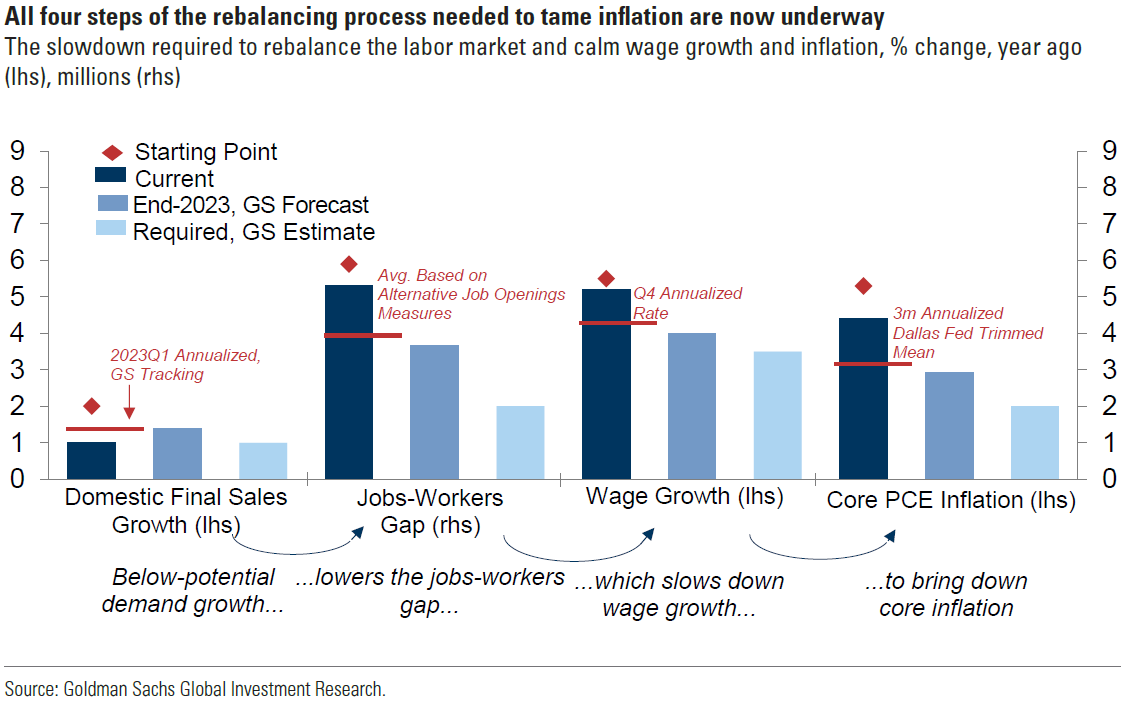
Source: Goldman Sachs, What’s Top of Mind in Macro Research: US inflation progress, more neutral asset allocation, BoJ governor nomination (2-15-2023)
Stronger than Expected U.S. January PPI
The BLS released January PPI on Thursday. On a seasonally adjusted basis, headline PPI rose 0.7% m/m, compared to a 0.2% decline in December, a 0.3% rise in November and a median forecast increase of 0.4%. The monthly increase incorporated a 5.0% gain in energy prices and a 1.0% decline in food prices. On an unadjusted basis, headline PPI was 6.0% higher m/m in January. Goods prices rose 1.2% m/m – largest increase since a since a 2.1% gain in June 2022 – and services increased 0.4% m/m. A major factor in the monthly services increase was a 1.4% gain m/m for hospital outpatient care. Excluding foods, energy and trade services, PPI was 0.6% higher m/m in January, which was the biggest gain since a 0.9% increase in March 2022, and was 4.5% higher y/y. PPI less food and energy rose 0.5% m/m versus an expected gain of 0.3% and was 5.4% higher y/y. Although the y/y increases for the headline and core moderated between December and January, the monthly increases were the largest since mid-2022.
Stronger-than-Expected U.S. January Retail Sales
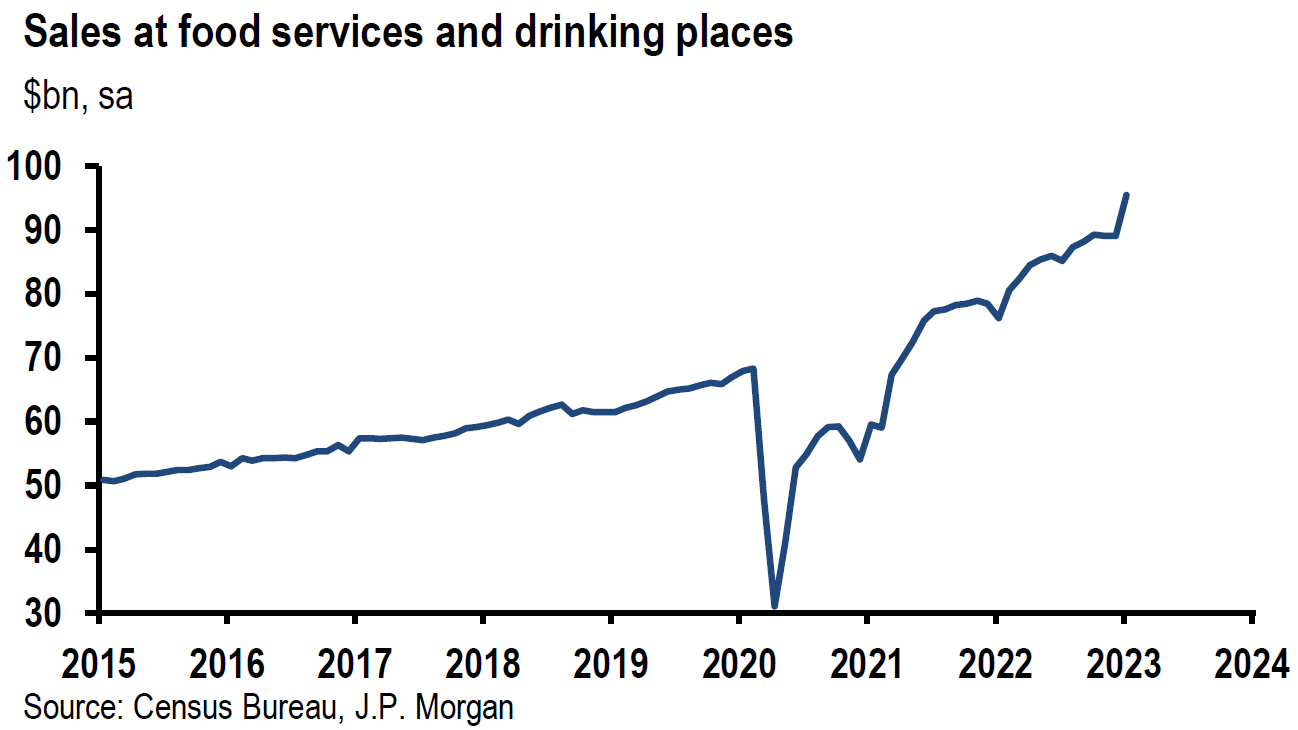
Retail sales increased 3.0% m/m versus an expected 1.8% increase and in contrast to a 1.1% decline in December. This was the largest monthly gain since March 2021. Biggest increases were in department stores, (17.5%), food services and drinking places (7.2%) and motor vehicles and parts (5.9%). Sales at gasoline stations were flat. Excluding only the automotive sector, sales rose 2.3% m/m, and increased 2.6% excluding autos and gasoline. We suspect that seasonal adjustments distorted the January figures due to the pandemic. Goldman calculated that the cost-of-living adjustments to Social Security benefits increased personal income by about 0.5%. Warm weather in parts of the U.S., and discounted post-holiday merchandise most likely also helped boost sales. Subsequent to Wednesday’s economic data releases and including retail sales, Goldman boosted its Q1 2023 tracking estimate by 0.6% to 1.4% quarter-over-quarter (q/q) on an annualized basis. JPM boosted its estimate by 1% to 2.0%. During the late afternoon of February 16 and due to the “stronger growth and firmer inflation news,” Goldman added a third 25 bps hike in June for a peak federal funds rate of 5.25% to 5.5% – up from the current 4.5% to 4.75% range. Bank of America’s Global Research team on February 16, joined Goldman’s forecast of an additional third 25 bps hike. Their research report stated that “resurgent inflation and solid employment gains mean the risks to this (only two interest rate hikes) outlook are too one-sided for our liking.” The report also noted the importance of seasonal adjustments. “While some of the strength may be due in part to seasonal adjustments, it is ‘hard to ignore’ employment data that point to stronger labor market momentum.”
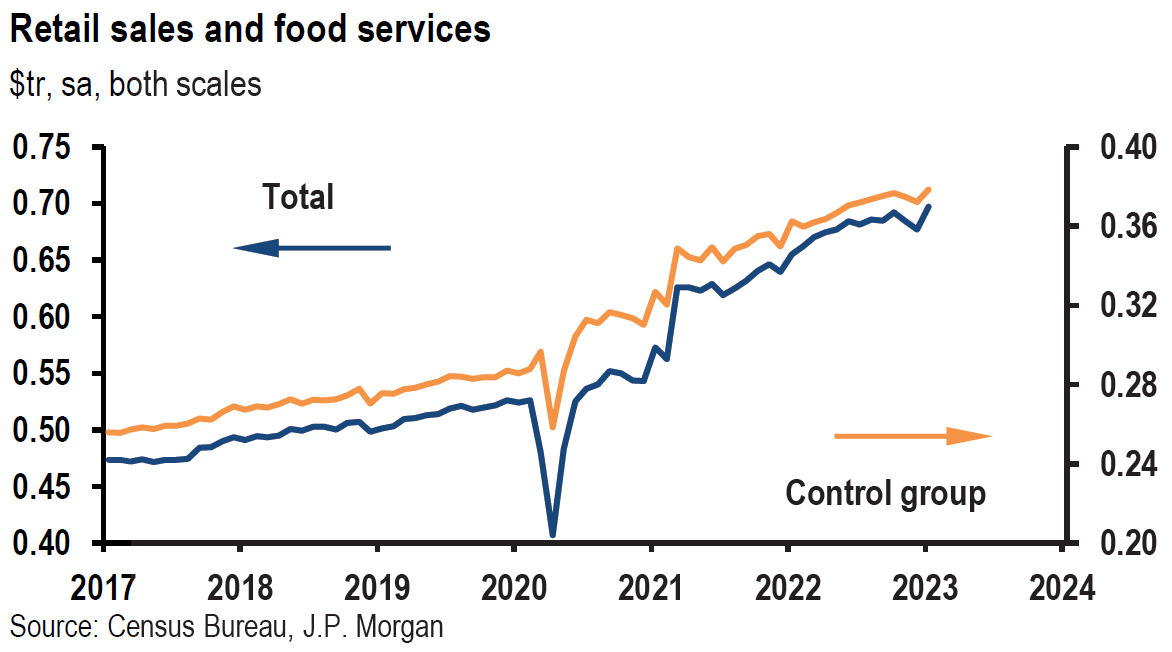
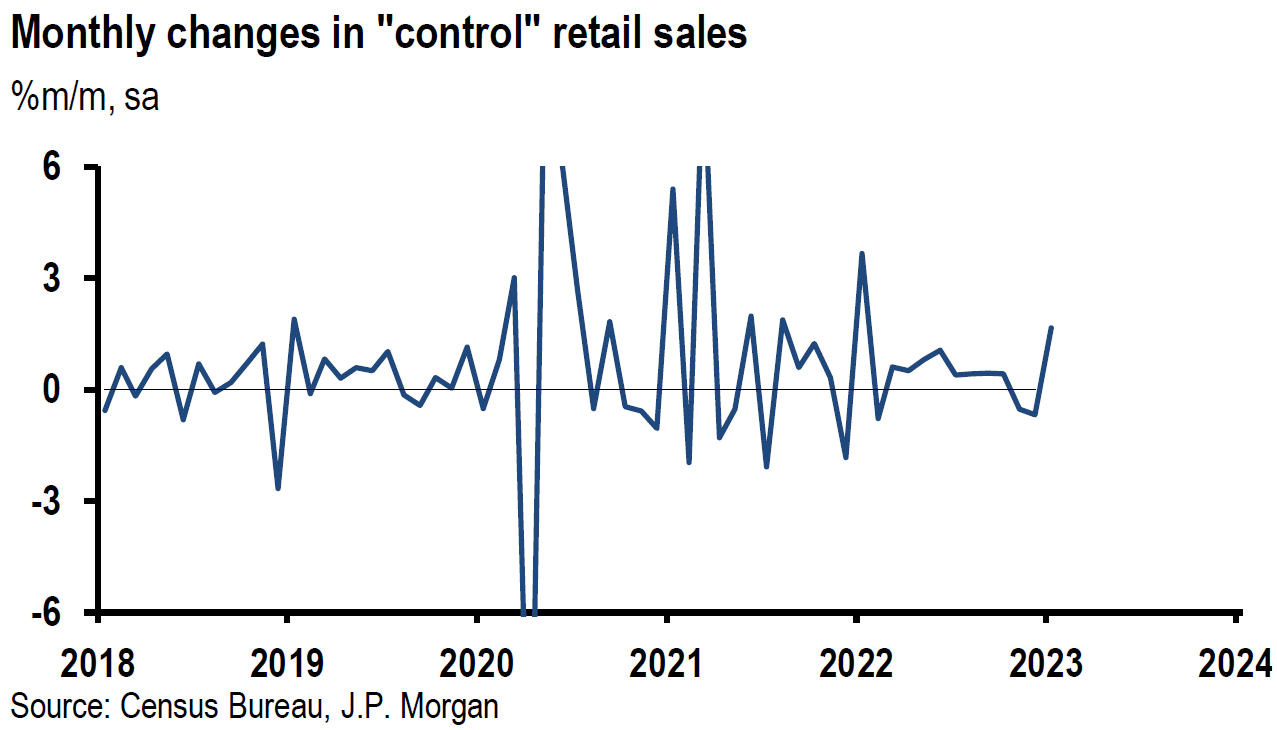
Source: JP Morgan, US: Jump in January retail sales boosts 1Q GDP estimate (2-15-2023)
New York Fed Survey of Inflation Expectations Versus University of Michigan Survey
Preliminary results for February’s Survey data from University of Michigan’s consumer sentiment index released last Friday showed that year-ahead inflation expectations increased from 3.9% to 4.2% in January and was only marginally below the 4.4% figure in December. Long-run inflation expectations remained at 2.9% for the third consecutive month. Uncertainty over short-term inflation has increased recently as uncertainty over the more long-term inflation expectations has diminished. The New York Fed’s latest survey of inflation expectations and household income expectations was released early this week. One-year-ahead inflation expectations were unchanged at 5.0%, increased 0.3% to 2.7% over the next three years, and increased 0.1% to 2.5% over a five-year period. The median expected drop of 1.3% to 3.3% in January’s household income growth was the steepest one-month drop in the survey’s nearly-ten-year history, but was only slightly lower than the twelve-month trailing average of 3.5%.
U.S. Mortgage Applications
Mortgage Bankers’ Association data for the week that ended February 10 revealed that total mortgage applications dropped 7.7% week-over-week (w/w) compared to a weekly increase of 7.4% the week before. Refinancing applications were 12.5% lower. Furthermore, mortgages to purchase a home dropped 5.5% m/m, and were about 43% lower y/y. Average contract interest rates for mortgages with a conforming loan balance – $726,200 or less – increased 21 bps from the prior week to 6.39%, which was the highest rate in five weeks. Mortgage rates were 4.05% just one year ago. There were reports of an abnormally high level of cash buyers in the past few weeks.
Weak U.S. January Housing Starts and Building Permits
Housing starts dropped 4.5% m/m in January, while residential building permits increased 0.1%. Starts for single family homes were 4.3% lower and multifamily units were 4.9% lower. Single family permits dropped 1.8% and multifamily permits increased 2.5%.
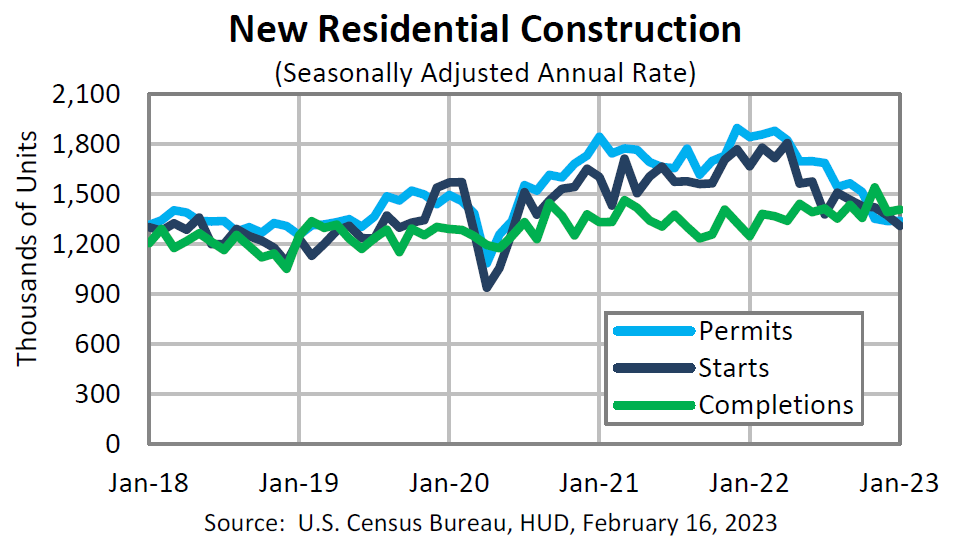
Source: U.S. Census Bureau, Monthly New Residential Construction, January 2023 (2-16-2023)
NAHB Housing Market Index Rises More than Expected
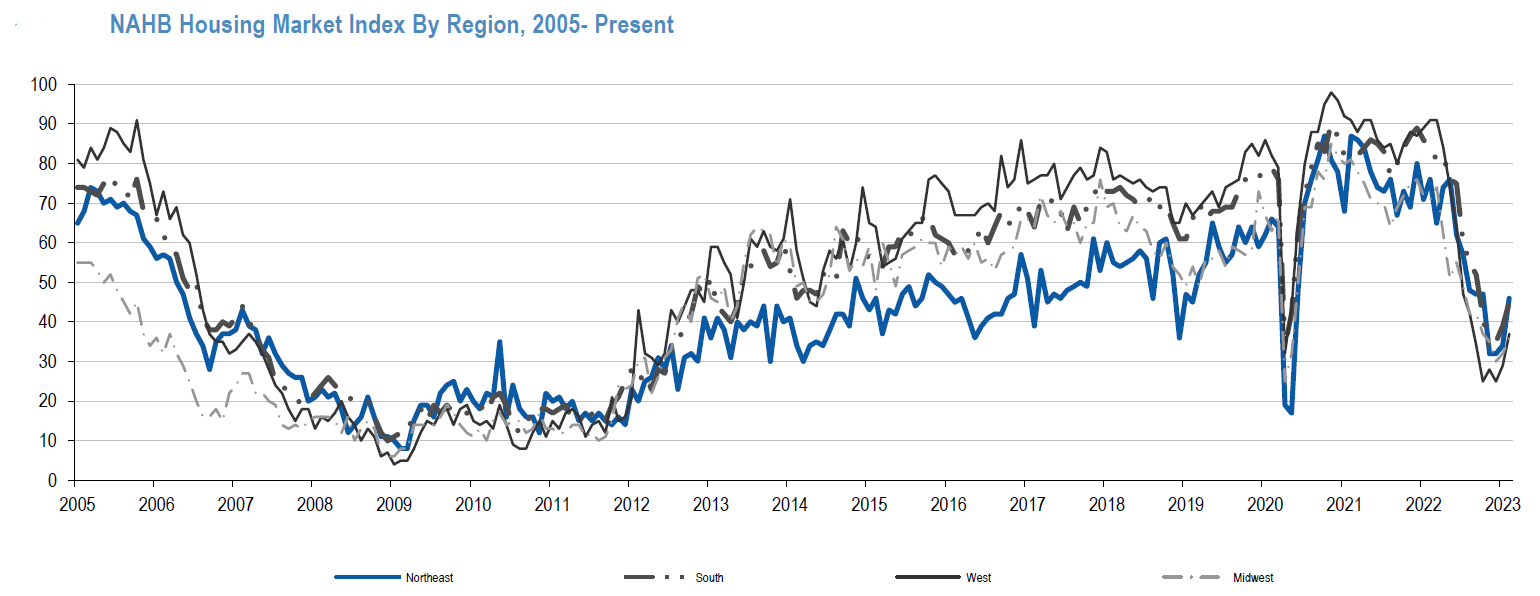
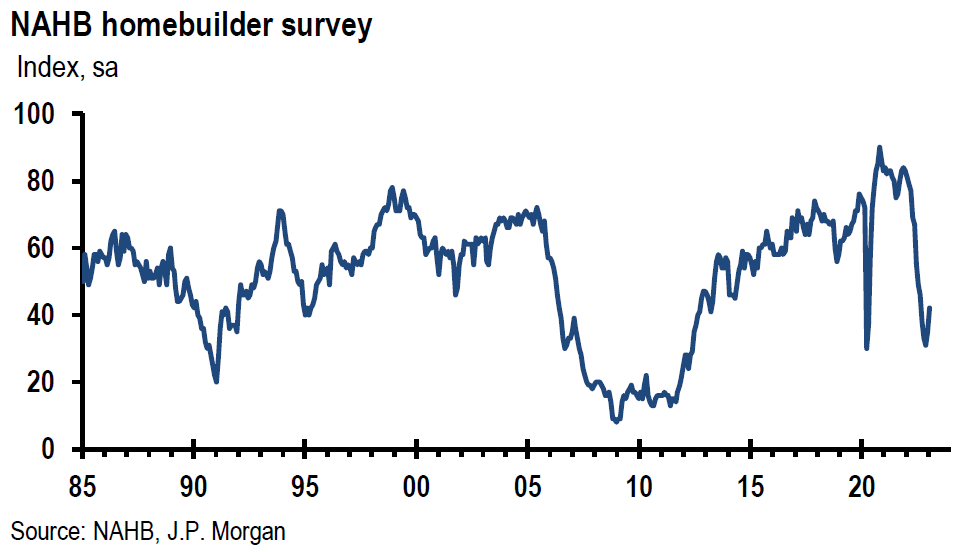
After declining for twelve consecutive months, the National Association of Home Builders (NAHB) index increased for the second consecutive month in February, the index rose seven points to 42 versus an expected two points increase. This was the biggest monthly gain in almost a decade. The gauge for current sales conditions rose from 40 to 46, sales expectations over the next six months increased from 37 to 48. Additionally, the traffic of prospective buyers rose six points to 29. Robert Dietz, the NAHB chief economist was encouraged: “forecasts indicate that the housing market has passed peak mortgage rates for this cycle. And while we expect ongoing volatility for mortgage rates and housing costs, the building market should be able to achieve stability in coming months, followed by a rebound back to trend home construction levels later in 2023 and beginning of 2024.”
Source: JP Morgan, Homebuilding (2-15-2023)
Source: JP Morgan, US: Wednesday’s economic data mostly moving higher (2-15-2023)
New York Fed Q4 Report on U.S. Total Household Debt and Credit
Total U.S. household debt increased $394 billion (+2.4%) to $16.9 trillion, which is $2.75 trillion more than it was at the end of 2019. This was the largest quarterly increase in twenty years. Mortgage balances increased $254 billion in Q4 to $11.92 trillion at the end of December. Credit card balances grew $61 billion to reach $986 billion – $59 billion more than the pre-pandemic high. The $130 billion y/y increase in credit card debt was the highest annual increase on record. Auto loan balances increased $28 billion in Q4. According to Bloomberg News on February 16, “delinquencies picked up, with borrowers reaching 90 days or more of delinquency at a higher rate than they did before the pandemic.”
New York Fed’s February Empire State Manufacturing Survey Better than Expected
Responses were collected between February 2 and 9. Manufacturing activity in New York State contracted at a much softer pace than anticipated. The headline general business conditions manufacturing index rose 27.1 points to -5.8 versus an expected negative reading of -18.0. New orders declined modestly at a -7.8 reading, rebounding from -31.1 in January. Shipments were unchanged at a positive 0.1 versus -22.4 in January. Delivery times shortened (-9.2 versus 0.9) and inventories edged higher (6.4 versus 4.5). The index for number of employees declined for the first time in over two years (-6.6 vs 2.8). The average workweek shrank for the third consecutive month. The prices paid index rose twelve points to 45.0 and prices received increased ten points to 28.4. The index for future business conditions rose seven points to 14.7, suggesting improvement over the next six months. But employment was not expected to increase in the months ahead.
Philadelphia Fed’s February Manufacturing Business Outlook Survey Worse than Expected
Responses were collected from February 6 to 13. The manufacturing activity index plunged to -24.3 in February, down from -8.9 last month and compared to expectations of -7.4. this was the lowest reading since May 2020 as the index recorded its sixth consecutive month in negative territory. The index for current new orders declined three points to -13.6 for its ninth consecutive negative month and the current shipment index slipped two points lower to 8.7. The current employment index decreased to 5.1 from 10.9 in January as the average workweek fell to -3.2 from 4.0. The prices paid index rose two points to 26.5 from a two-and-a-half-year low last month. The current prices received index fell fifteen points to 14.9, its lowest reading since February 2021. These price trends reflected profit margin compressions that could lead to lower company earnings. Most of the survey’s future indicators remained positive but low, suggesting “tempered” expectations for growth.
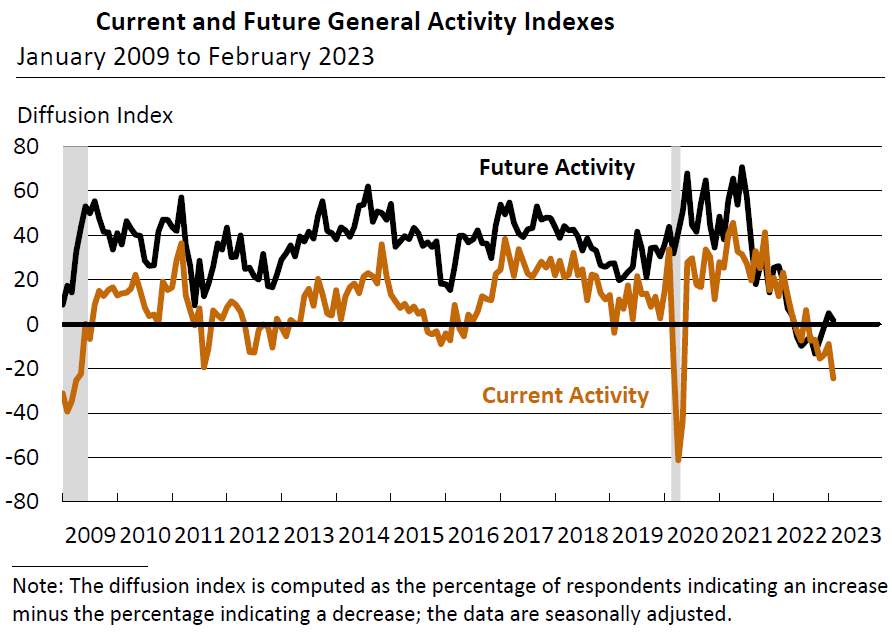
Source: Federal Reserve Bank of Philadelphia, Manufacturing Business Outlook Survey (survey collected from 2/6/2023-2/13/2023)
New York Fed’s February Business Leaders Survey of Service Firms Improves but Stays Depressed
Responses were collected between February 2 and 9. The headline business activity index for service firms in the New York area climbed nine points but remained in negative territory at -12.8 for a fifth consecutive month. The business climate index rose seven points to -34.9, suggesting a much worse than normal business climate. There was a small increase in employment along with wage growth that “steepened” ten points to 56.7. The pace of increases for both prices paid and received “picked up somewhat.” The index for future business activity rose to 8.2, its first positive reading since last September. The index for future business climate rose twenty-three points to -4.1.
Hawkish Fedspeak
It should come as no surprise that many Fed officials expressed hawkish views in regard to the Fed’s future monetary policies after the strong CPI and PPI readings on January inflation and the stronger than expected January retail sales. Many Fed officials this week expressed the opinion that interest rates may need to move to a higher level than anticipated previously to ensure that the rate of inflation continues to fall. Richmond Fed president Thomas Barkin: “If inflation persists at levels well above target maybe we’ll have to do more.” Dallas Fed president Lorie Logan: “We must remain prepared to continue rate increases for a longer period than previously anticipated if such a path is necessary to respond to changes in the economic outlook or to offset any undesired easing in conditions.” Logan added that the most important risk is doing too little. Philadelphia Fed president Patrick Harker acknowledged that the Fed still has more work to do. “At some point this year I expect that the policy rate will be restrictive enough that we will hold rates in place and let monetary policy do its work.” He added that the Fed is “likely close” to that point. New York Fed president John Williams on Tuesday said that it appeared “reasonable” to him for the federal funds rate should be between 5.0% and 5.5% by year end.
But perhaps the most outspoken hawkish Fed officials this week were Cleveland Fed president Loretta Mester and St. Louis Fed president James Bullard, who are both non-voting Fed members this year. Both favored a 50 bps hike in the federal funds rate at the Fed’s last meeting, when the Fed announced it was “downshifting” to a 25 bps hike from a 50 bps pace. Bullard said he could not rule out a 50 bps hike at the Fed’s next meeting in March. Bullard confirmed that he “pushed” for a 50 bps hike at the Fed’s last meeting. Mester said that she saw a “compelling case” for a 50 bps hike at that meeting as well. But after her remarks, Mester told reporters that she was not ready to say what size rate hike that the Fed should deliver at its next meeting in late March. However, she did say that “given the risks and costs, we need to be prepared to move the federal funds rate higher if the upside risks to inflation are realized and inflation fails to moderate as expected or if the imbalances between demand and supply in product and labor markets persist longer than anticipated.” Mester still does not expect a U.S. recession in 2023.
U.S. January Industrial Production Disappoints but Manufacturing Output Better than Expected
Industrial production was flat in January m/m versus an expected increase of 0.5% and rose 0.8% y/y – the smallest increase since March 2021. December’s monthly reading was revised down to a negative -1.0% from a negative -0.7%. The monthly headline reading was pulled down by a 9.9% drop in utilities output as heating demand was lower due to an unseasonably warm January after an unseasonably cold December. Utilities output was 5.1% higher m/m in December. Manufacturing production increased above expectations at 1.0% after a sharp drop of 1.8% m/m in December and mining production increased 2.0% m/m. Manufacturing and mining recovered in January after two months of sharp declines. Capacity utilization measured 78.3%in January versus 78.4% in December and versus an expected reading of 79%. January’s capacity utilization rate was at the lowest level since September 2021.
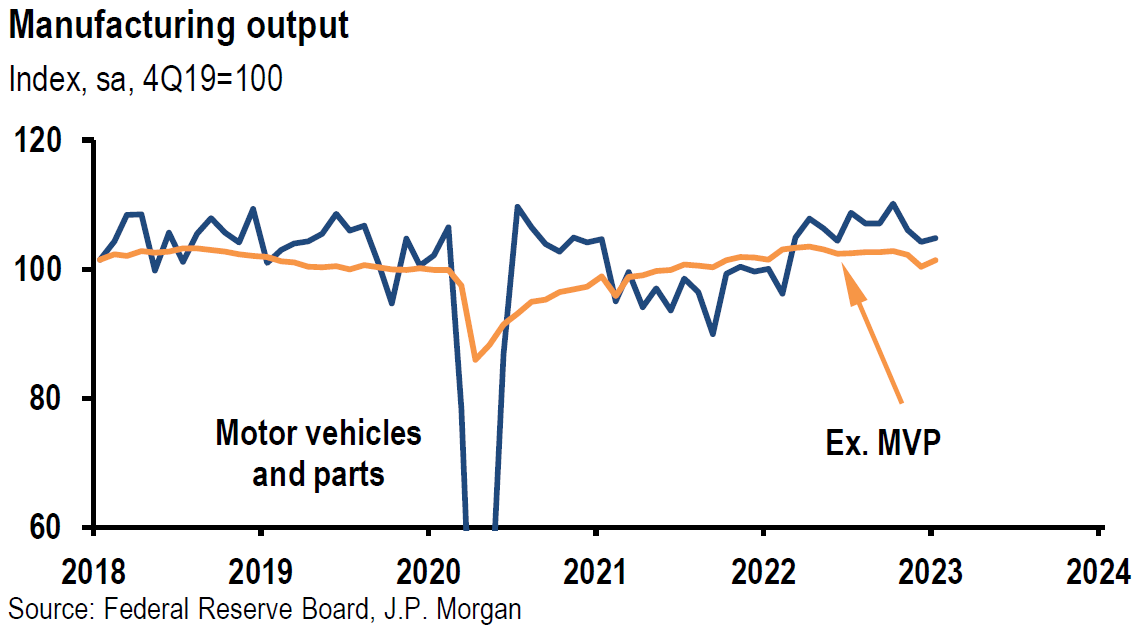
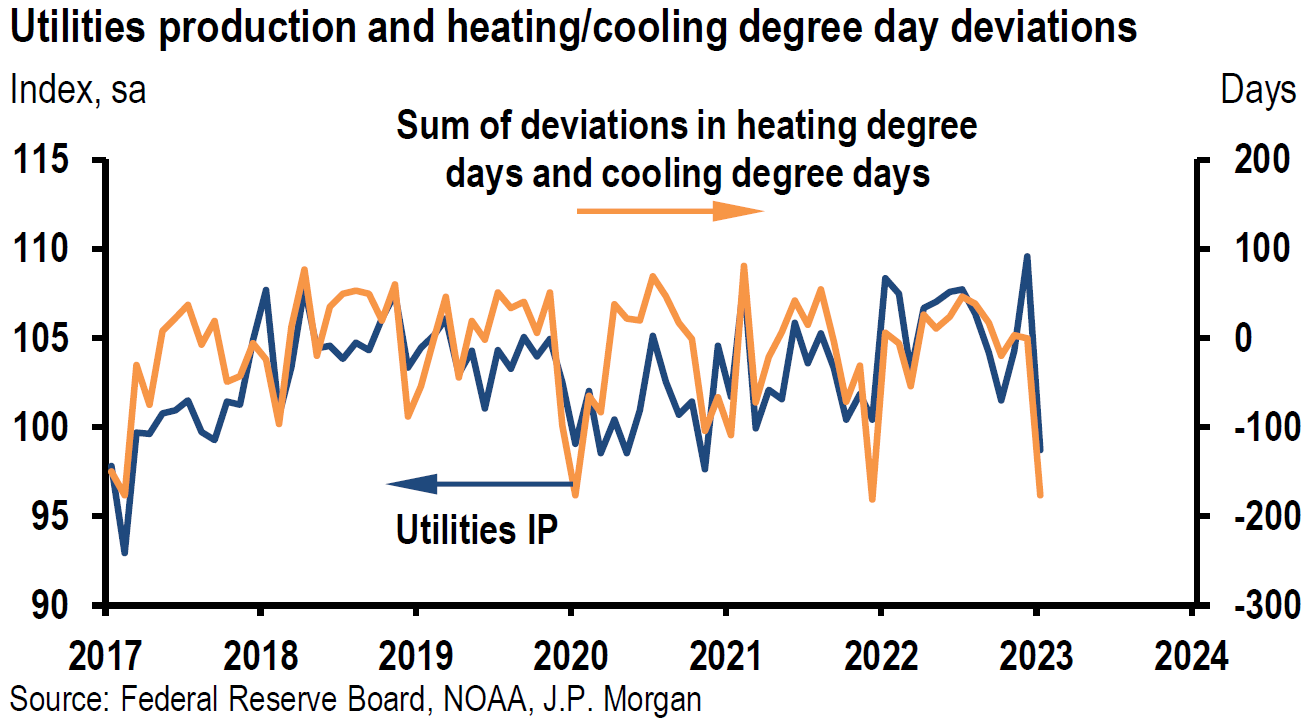
Source: JP Morgan, US: Wednesday’s economic data mostly moving higher (2-15-2023)
The Conference Board’s January Leading Economic Index (LEI)
The LEI fell by 0.3% to 110.3, after a decline of 0.8% in December. This index has declined 3.6% over the past six ninths after a 2.4% decline in the prior six months. According to the Senior Director, Economics, at The Conference Board: “Among the leading indicators, deteriorating manufacturing new orders, consumers’ expectations of business conditions, and credit conditions more than offset strengths in labor markets and stock prices to drive the index lower in the month … While the LEI continues to signal recession in the near term, indicators related to the labor market – including employment and personal income – remain robust so far, Nonetheless, The Conference Board still expects high inflation, rising interest rates, and contracting consumer spending to tip the U.S. economy into recession in 2023.”
Bottom Line
For the time being we are maintaining our basic investment approach as expressed in last week’s commentary. We continue to prefer high quality stocks that offer good balance sheets, as well as relatively stable cash flows and profit margins. We prefer a very diversified global portfolio for long term investors.
Given the myriad of possible explanations to account for financial markets’ reactions this year, we view the investment process this year as navigating through a landscape of “minefields.” We feel “equipped” to embrace this task. We believe that maintaining an “open mind” could be the key to a successful “navigation.” Many U.S. equities continue to show a remarkable resiliency.
Definitions
Headline Consumer Price Index (Headline CPI) – Headline inflation is the raw inflation figure reported through the Consumer Price Index (CPI) that is released monthly by the Bureau of Labor Statistics (BLS). The CPI calculates the cost to purchase a fixed basket of goods to determine how much inflation is occurring in the broad economy. The CPI uses a base year and indexes the current year’s prices, according to the base year’s values.
Core Consumer Price Index (Core CPI) – Core inflation removes the CPI components that can exhibit large amounts of volatility from month to month, which can cause unwanted distortion to the headline figure. The most commonly removed factors are those relating to the costs of food and energy. Food prices can be affected by factors outside of those attributed to the economy, such as environmental shifts that cause issues in the growth of crops. Energy costs, such as oil production, can be affected by forces outside of traditional supply and demand, such as political dissent.
Retail Sales – Retail sales represent a key macroeconomic metric that tracks consumer demand for finished goods. It acts as a key economic barometer and whether inflationary pressures exist. Retail sales are measured by durable and non-durable goods purchased over a defined period of time.
Fedspeak – Fedspeak refers to speeches about monetary policy given by members of the U.S. Federal Reserve Bord of Governors.
Basis Points (bps) – A basis point is one hundredth of one percent, used chiefly in expressing differences of interest rates.
Housing Starts – Housing starts are a measure of new residential construction and are considered a key economic indicator.
Short Covering – Short covering refers to buying back borrowed securities in order to close out an open short position at a profit or loss.
The NAHB/Wells Fargo Housing Market Index (HMI) – The NAHB/Wells Fargo Housing Market Index is a monthly sentiment survey of members of the National Association of Home Builders. The index measures sentiment among builders of U.S. single-family homes and is a widely watched gauge of the U.S. housing sector.
Philadelphia Fed’s Manufacturing Survey – The Philadelphia Fed’s Manufacturing Business Outlook Survey is a monthly survey of manufacturers in the Third Federal Reserve District. Participants indicate the direction of change in overall business activity and in the various measures of activity at their plants.
Leading Economic Indicators Conference Board – The components of The Conference Board Leading Economic Index for the U.S. include:
- Average weekly hours in manufacturing – The average hours worked per week by production workers in manufacturing industries tend to lead the business cycle because employers usually adjust work hours before increasing or decreasing their workforce.
- Average weekly initial claims for unemployment insurance – The number of new claims filed for unemployment insurance are typically more sensitive than either total employment or unemployment to overall business conditions, and this series tends to lead the business cycle.
- Manufacturers’ new orders for consumer goods and materials – These goods are primarily used by consumers. The inflation-adjusted value of new orders leads actual production because new orders directly affect the level of both unfilled orders and inventories that firms monitor when making production decisions.
- ISM Index of New Orders – This index reflects the levels of new orders from customers. As a diffusion index, its value reflects the number of participants reporting increased orders during the previous month compared to the number reporting decreased orders, and this series tends to lead the business cycle.
- Manufacturers’ new orders for nondefense capital goods excluding aircraft orders – This index, combing with orders from aircraft (in inflation-adjusted dollars) are the producers’ counterpart to consumer goods and materials.
- Building permits for new private housing units – The number of residential building permits issued is an indicator of construction activity, which typically leads most other types of economic production.
- S&P 500 Index of Stock Prices – The Standard & Poor’s 500 stock index reflects the price movements of a broad selection of common stocks traded on the New York Stock Exchange.
- Leading Credit Index – This index is consisted of six financial indicators: 2-years Swap Spread (real time), LIBOR 3 month less 3 month Treasury-Bill yield spread (real time), Debit balances at margin account at broker dealer (monthly), AAII Investors Sentiment Bullish (%) less Bearish (%) (weekly), and Senior Loan Officers C&I loan survey
- Interest rate spread (10-year Treasury bonds less federal funds rate) – The spread or difference between long and short rates is often called the yield curve.
- Average consumer expectations for business condition – This index reflects changes in consumer attitudes concerning future economic conditions.
IMPORTANT DISCLOSURES
The views and opinions included in these materials belong to their author and do not necessarily reflect the views and opinions of NewEdge Capital Group, LLC.
This information is general in nature and has been prepared solely for informational and educational purposes and does not constitute an offer or a recommendation to buy or sell any particular security or to adopt any specific investment strategy.
NewEdge and its affiliates do not render advice on legal, tax and/or tax accounting matters. You should consult your personal tax and/or legal advisor to learn about any potential tax or other implications that may result from acting on a particular recommendation.
The trademarks and service marks contained herein are the property of their respective owners. Unless otherwise specifically indicated, all information with respect to any third party not affiliated with NewEdge has been provided by, and is the sole responsibility of, such third party and has not been independently verified by NewEdge, its affiliates or any other independent third party. No representation is given with respect to its accuracy or completeness, and such information and opinions may change without notice.
Investing involves risk, including possible loss of principal. Past performance is no guarantee of future results.
Any forward-looking statements or forecasts are based on assumptions and actual results are expected to vary from any such statements or forecasts. No assurance can be given that investment objectives or target returns will be achieved. Future returns may be higher or lower than the estimates presented herein.
An investment cannot be made directly in an index. Indices are unmanaged and have no fees or expenses. You can obtain information about many indices online at a variety of sources including: https://www.sec.gov/fast-answers/answersindiceshtm.html or http://www.nasdaq.com/reference/index-descriptions.aspx.
All data is subject to change without notice.
© 2024 NewEdge Capital Group, LLC


