

Weekly Summary – May 29 – June 2
Key Observations:
- The economic and market narratives continue to change very abruptly. Although we found most of this week’s economic data “mixed,” we thought that the U.S. consumer has shown resiliency. On Friday, Bloomberg News reported that China was “working on a new basket of measures to support the property market after existing policies failed to sustain a rebound in the ailing sector.” We surmise that this new change in policy might help close the underperformance gap of China’s manufacturing sector compared to the stronger services sector. This could also boost many commodities as well. Although Friday’s U.S. nonfarm payrolls greatly exceeded expectations, the unemployment rate rose more than expected and average hourly earnings appeared to be somewhat contained. We postulate that the higher-than-expected U.S. unemployment rate may indicate a less problematic labor market. The U.S. unemployment rate is based on a separate household survey.
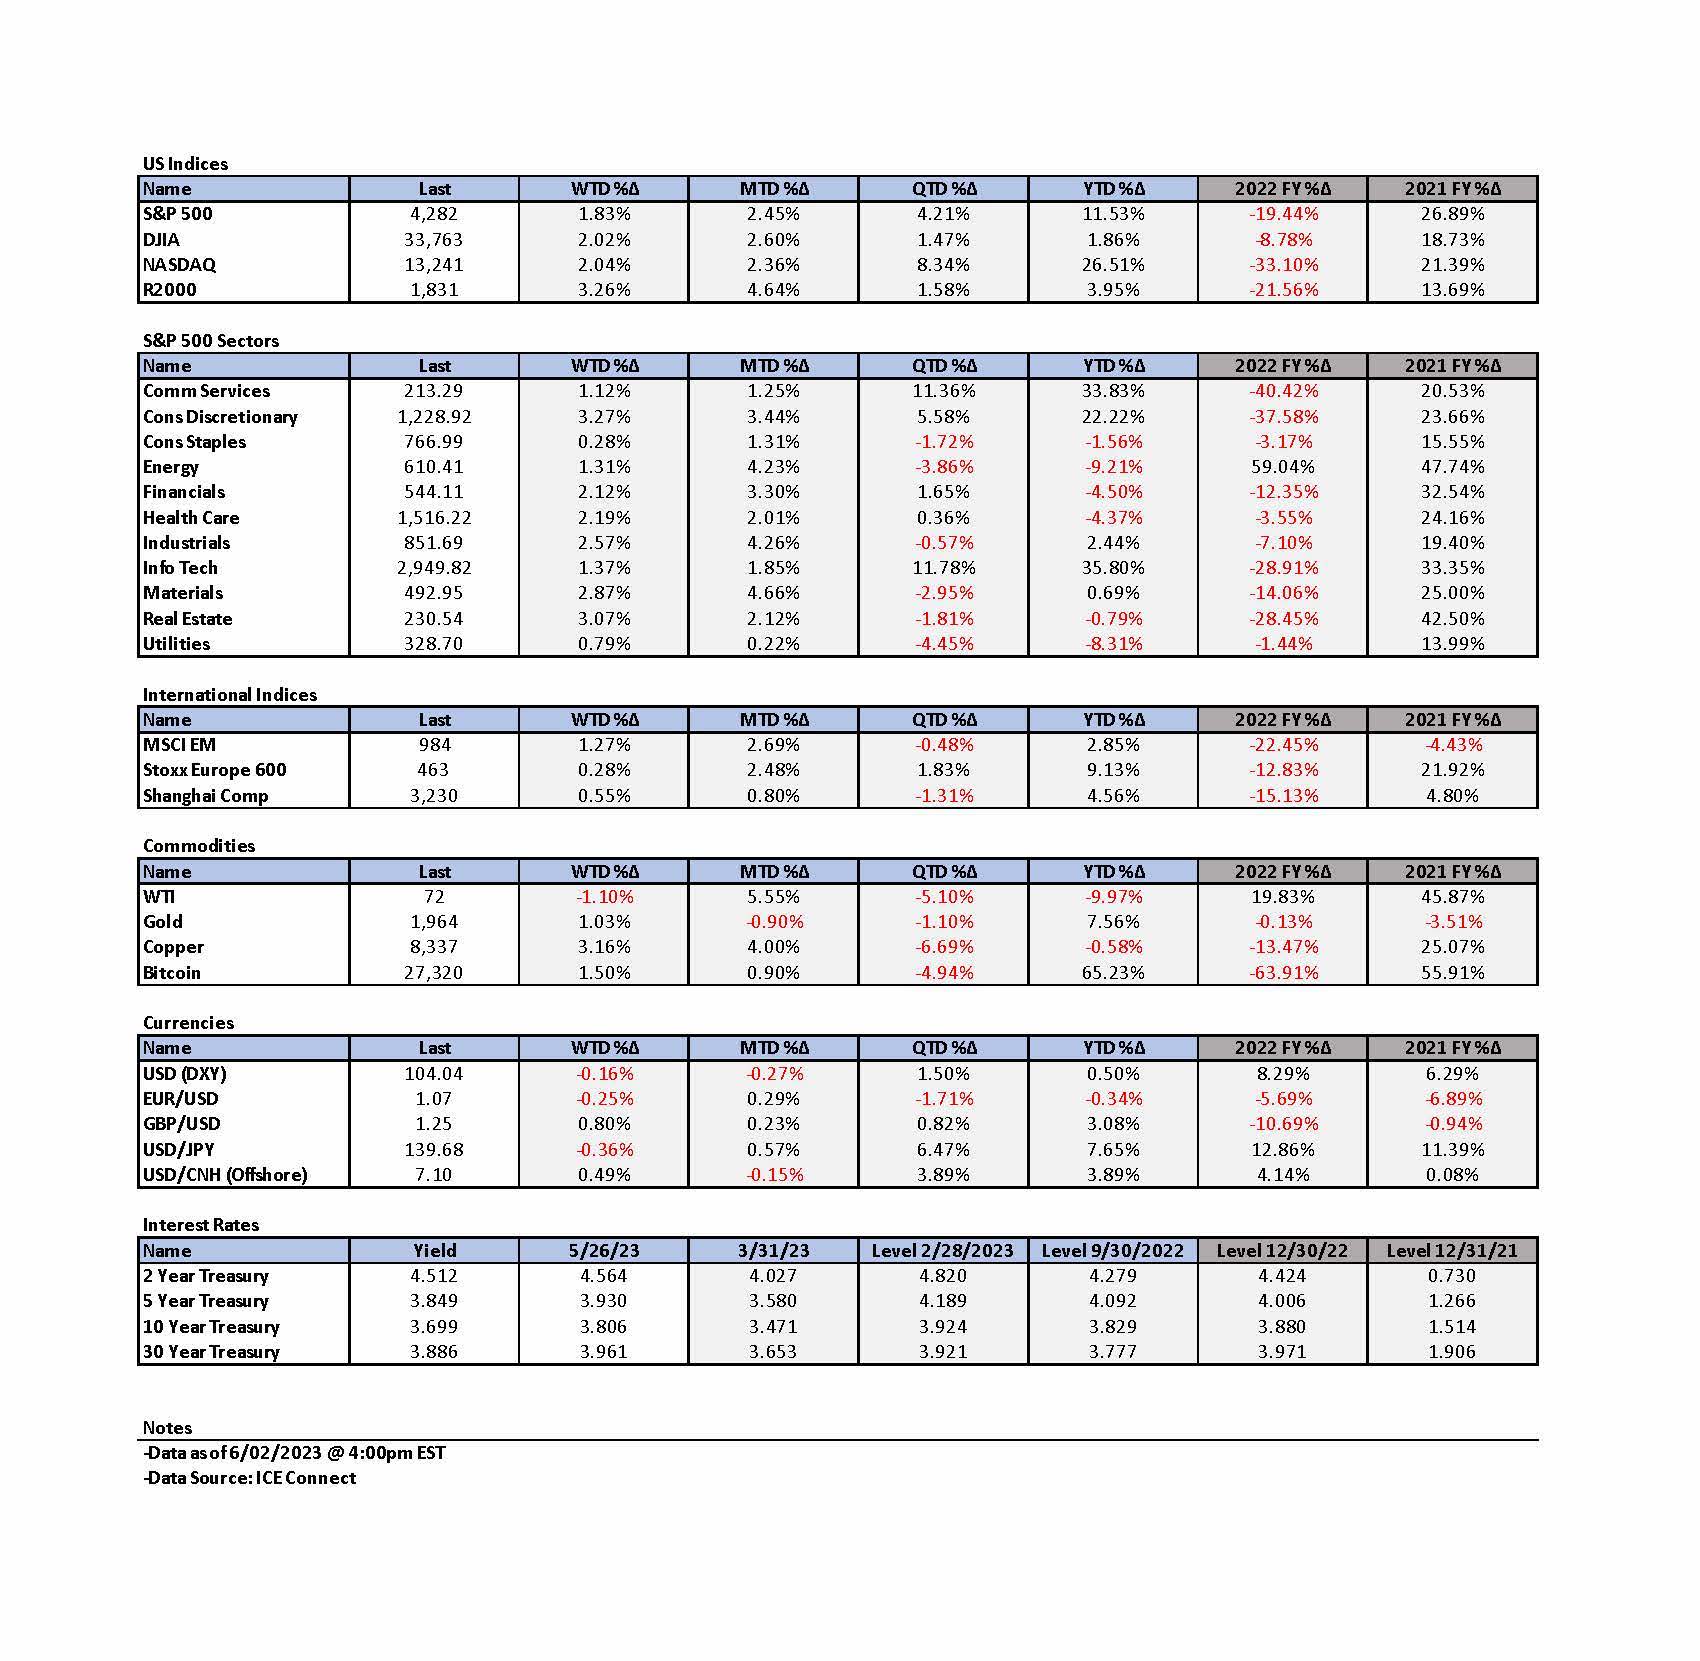
- Friday’s U.S. equity markets saw a dramatic broadening of the recent U.S. stock rally that was typified by very narrow “breadth,” with only a few stocks driving gains. We assume that there was low “positioning” in many U.S. stocks – especially “value” and commodity related securities. In early Friday afternoon trading in U.S. stocks, the materials, energy and industrial sectors were the leaders with financials part of a group of three sectors also showing gains of well over 2%. USD was also trading higher, along with interest rates. Rising interest rates are often associated with rising “value” stocks, provided we are not heading into a recession. The two worst performing S&P 500 sectors were info tech and communication services. The two-to-10-year Treasury yield curve also became more inverted as it exceeded 80 basis points. Such inversions are typically a precursor to increased recession risks.
- The Fed’s Beige Book, released this week, continued to show a resilient U.S. economy and consumer. Nevertheless, the Beige Book showed some “cracks” as expectations for future growth deteriorated “a little.” The increase in U.S. job openings and the low level of unemployment insurance claims were indicative of a tight U.S. labor market. But the apparent containment of wage growth indicated in Friday’s nonfarm payrolls data was encouraging.
- Although many growth stocks were the “laggards” on early Friday afternoon, they were still positive in the face of higher interest rates, showing that AI related securities might be somewhat impervious to higher rates. This resilience might also be attributable to financial markets mostly assuming only one more hike in the federal funds rate at either of the Fed’s next two meetings. The next U.S. CPI data will be revealed on the first day of the Fed’s meeting in June. This could very well be determinative as to whether the Fed hikes in June.
The Upshot: Our general investment approach remains the same as depicted in last week’s commentary. We maintain our preference for quality stocks with good balance sheets, relatively stable cash flows with stable margins. Volatility across sectors continues to be supportive of a diversified portfolio for long term investors. We continue to stress that stock selectivity is of paramount importance.
We will monitor financial markets very closely so that we might be able to better discern the sustainability of the broadening out of sectors and stocks that might now be ready to participate in further gains. For the time being, we are inclined to give the benefit of the doubt to Friday’s dramatic moves.
Dramatic Swings in Probabilities of Future Fed Hikes
The financial markets’ pricing in whether or not the Federal Reserve (Fed) would hike the federal funds rate at its mid-June meeting fluctuated wildly on Wednesday depending on the latest available information. Reuters reported on May 31 that according to CME Group’s FedWatch Tool fed funds futures showed at Wednesday’s close a 76.2% probability that the Fed would not hike rates at its June 13-14 meeting. The presumed catalyst for the increased probability of a “pause” or “skip” at the June meeting were comments from Fed Governor vice chair nominee Philip Jefferson and Philadelphia Fed president Patrick Harker. Jefferson said about the Federal Open Market Committee’s (FOMC or Committee) potential decision: “skipping a rate hike at a coming meeting would allow the Committee to see more data before making decisions about the extent of additional policy firming.” Harker made similar comments: “I am in the camp increasingly coming into this meeting thinking that we really should skip.” Additionally, Harker emphasized that the economic outlook is uncertain. Financial markets were pricing in about a 60% chance of a June hike in the morning, that increased to about a 71% chance of a hike shortly after the release of the April Job Openings and Labor Turnover Survey (JOLTS) data that showed a much larger-than-expected job openings figure. These figures were mostly reversed after the comments by Jefferson and Harker. In many of our recent commentaries, we have highlighted that uncertainty permeates financial markets and economic forecasts and that lack of conviction mostly follows great uncertainty closely. Wednesday’s market fluctuations of probabilities were a tangible example of this. We thought that Queens of the Stone Age song “No One Knows,” encapsulates partly the notion that no one really knows in the face of many uncertainties. “We get some rules to follow; That and this, these and those; No one knows.”
U.S. Default Averted
Like most investors and analysts, we “assumed” that a compromise would be reached on the U.S. debt ceiling in a “timely manner,” so that the U.S. would not default on its debt obligations. The Republican controlled House of Representatives (House) approved on Wednesday night by a vote of 314-117 a bill that would suspend the U.S. debt ceiling for nearly two years – through January 1, 2025. The Republicans voted 149-71 in favor, while the Democrats voted in favor by a 165-46 margin. On Thursday evening, Senate Majority Leader Chuck Schumer made assurances that the Senate would vote on the same night on the debt suspension bill and then send the bill to President Biden for his signature. The bill needs 60 votes to pass. It appeared then highly certain that a U.S. default will be avoided along with the many uncertainties that would then be avoided as well. Indeed, the Senate voted 63-36 on Thursday night to approve the bill that passed the House on Wednesday. With this legislation, the statutory limit on federal borrowing will be suspended until January 1, 2025.
The Conference Board’s May Consumer Confidence Index Continued Lower
The release of economic data this week continued to show a “mixed” set of data marked by divergences, most notably between manufacturing and services sectors. The Conference Board’s May consumer confidence index fell from a 2.4 points upwardly revised level of 103.7 in April to a six-month low of 102.3 in May. The present situation component of consumer confidence decreased 3.2 points to 148.6 and the expectations component weakened modestly only 0.2 points to 71.5. An expectations reading under 80 is often seen as a precursor to a recession beginning over the next year. However, since February 2022, this figure has been under 80 for every month except one. A ”cooling” of the labor market was suggested by the drop in the labor market differential. This is the difference between “plentiful” jobs and those that are “hard to get.” The labor market differential dropped from 36.9% in April to 31.0% in May. This was the lowest level since April 2021. Another possible sign of a less-tight labor market was that the share of respondents expecting more employment opportunities over the next six months fell to its lowest level since 2016. The Conference Board also observed that consumers’ current assessment of employment conditions saw a “significant” deterioration.
U.S. Home Prices Generally Increased Sequentially in March
The FHFA House Price Index (FHFA HPI®) rose 0.6% month-over-month (m/m) versus an expected advance of 0.2%. A spokesman for the Federal Housing Finance Agency (FHFA) commented that “U.S. house prices generally increased modestly in the first quarter. However, year-over-year (y/y) prices in many western states have started to decline for the first time in over ten years.” Prices were 0.5% higher in Q1 2023 than in Q4 2022, and Q1 2023 was 4.3% higher than the same period in 2022. The S&P CoreLogic Case-Shiller 20-city home price index rose 0.5% versus an expected flat m/m reading. But this index was 1.1% lower y/y in March for the first annual decrease since May 2012 – versus an expected 1.6% y/y decline. An S&P spokesman observed “that the decline that began in June 2022 may have come to an end. That said, challenges posed by current mortgage rates and the continuing possibility of economic weakness are likely to remain a headwind for housing prices for at least he next several months.” The seasonally adjusted Case-Shiller national HPI is now just 2.3% below its June 2022 peak.
Fed’s Beige Book Showed Relative Economic Stability with Some Cracks Beginning to Occur
“Economic activity was little changed overall in April and early May.” But “expectations for future growth deteriorated a little, though contacts still largely expected a further expansion in activity.” Consumer expenditures were steady or higher in most of the Fed’s twelve Districts, with many reporting increased spending in leisure and hospitality. Improved supply chains helped manufacturing activity to be flat-to-improved. Residential real estate “picked up” even as overall real estate decreased. Contacts in several Districts reported increases in consumer loan delinquencies, which were closer to pre-pandemic levels. Although employment increased in most Districts, contacts across Districts noted that the labor market had “cooled” somewhat. Many contacts acknowledged their uncertainty about the economic outlook. Financial conditions were “stable or somewhat tighter.” Prices rose moderately but the rate of increase slowed in many Districts.
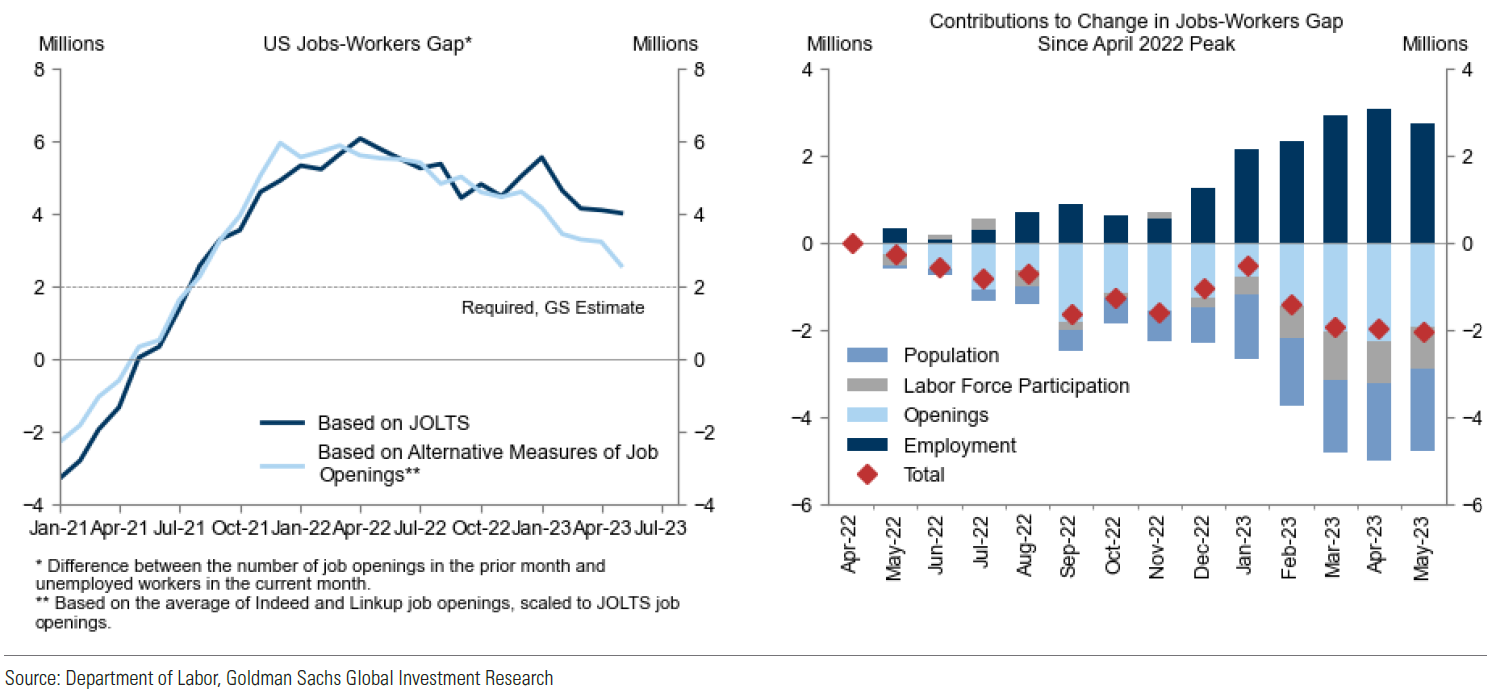
April JOLTS – Job Openings Much More than Expected Suggests a Tighter Labor Market
The number of job openings increased unexpectedly 358,000 to reach 10.1 million versus an expected 9.375 million and March’s near two-year low of 9.745 million. April ended three consecutive months of declining job openings. The ratio of vacancies to unemployed people moved up from 1.7 to 1.8. A ratio in the 1.0-1.2 range is considered consistent with a labor market in better balance. However, the quits rate dropped from 2.5% to 2.4% – the lowest since February 2021. A decrease in the quits rate might indicate that new jobs are more difficult to attain. In our last commentary on JOLTS, we noted that a historically-low response rate to this survey and the composition of those not responding might tend to inflate the number of job vacancies – more uncertainty.
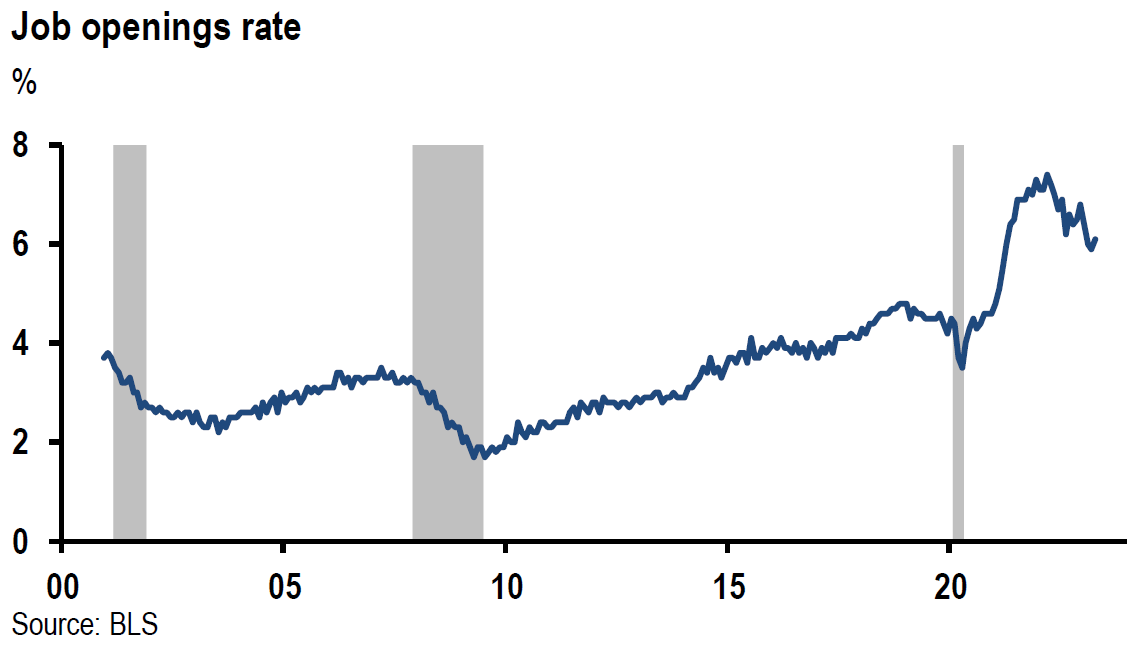
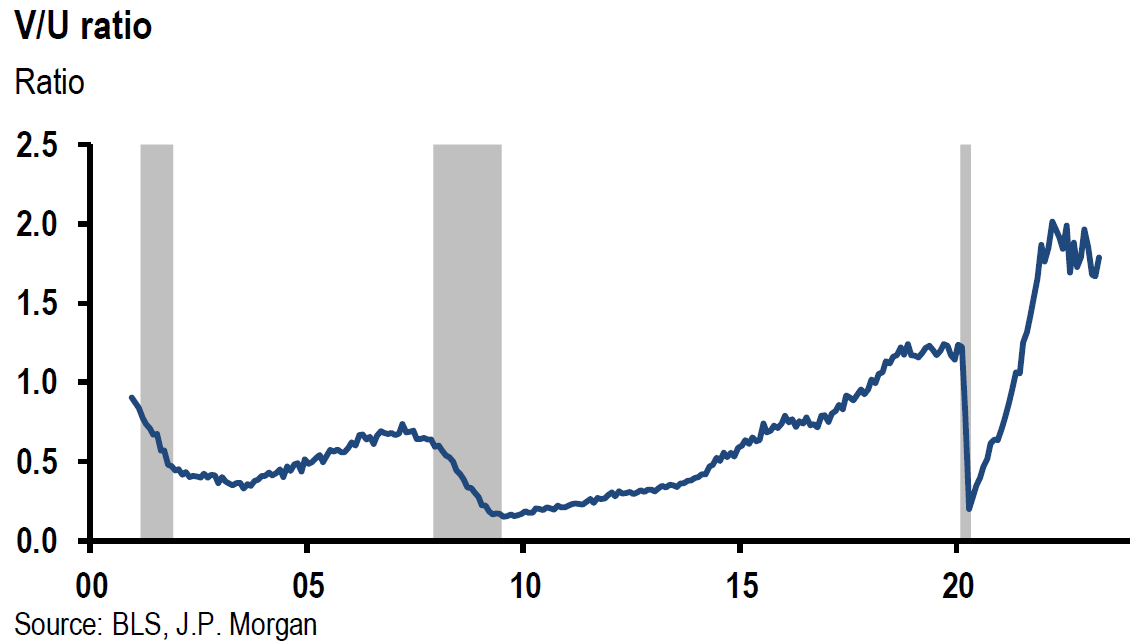
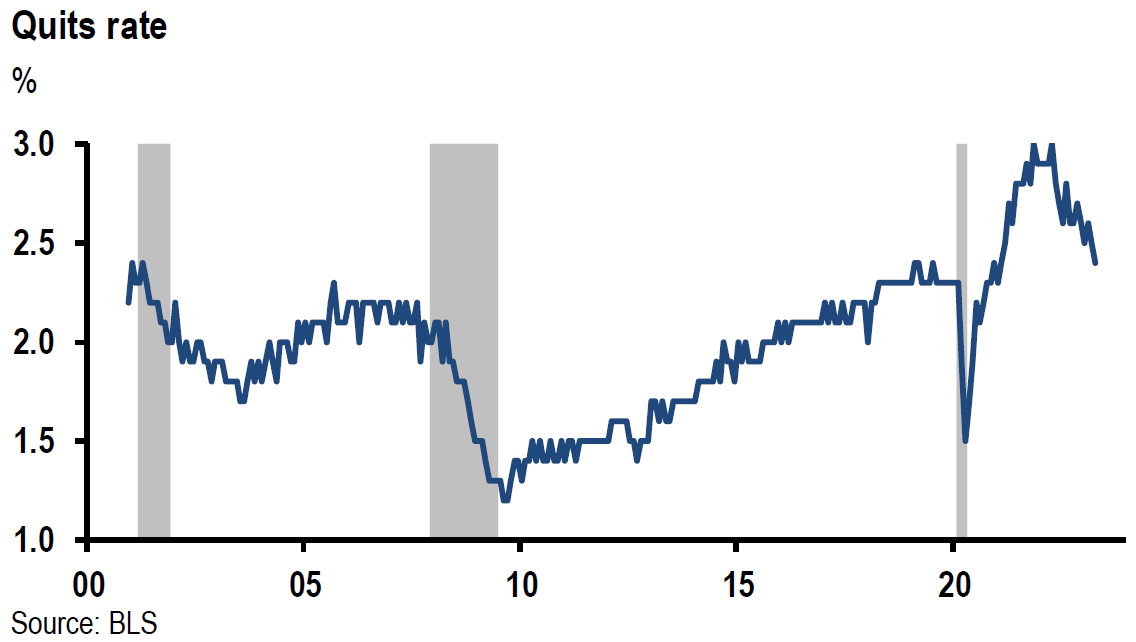
Source: JP Morgan, April openings up (5-31-2023)
Initial Jobless Claims Remain Relatively Low
Initial claims for unemployment insurance benefits for the week ending May 27 increased 2,000 from the previous week to 232,000 – versus an expected 235,000. Continuing jobless claims increased 6,000 to 1.795 million for the week that ended May 20 – versus an expected 1.78 million. We interpret this data as consistent with a still-tight U.S. labor market. But we have analyzed also other surveys in this week’s commentary that suggest the labor market may be beginning to “cool.”
Institute for Supply Management (ISM) U.S. Manufacturing Purchasing Managers’ Index (PMI) for May Declined Roughly as Expected, but Chicago PMI Disappointed
The ISM Manufacturing PMI declined from 47.1 in April to 46.9 for May, which was just short of an expected 47reading. This was the seventh consecutive month of contraction for this index. New orders fell 3.1 percentage points to 42.6%, even as new export orders rose 0.2 points to 50.0. Imports were 2.6 points lower at 47.3%. Production increased 2.2 points to 51.1, but backlog of orders declined 5.6 points to 37.5%. Employment increased 1.2 points to 51.4%. The prices index notably fell nine points to 44.2%. Although May’s performance was “clearly weaker” than that of April, we view this report as “mixed”. Chair of ISM manufacturing business survey committee Timothy Fiore made the following comments: “The May composite index reading reflects companies continuing to manage outputs to better match demand for the first half of 2023 and prepare for growth in the late summer/early fall period. However, there is clearly more business uncertainty in May.” The Chicago PMI is reflective of business conditions across Illinois, Indiana and Michigan, and is widely used to indicate overall U.S. economic conditions. It is also “interrelated” with ISM manufacturing PMI. May’s Chicago PMI fell from an eight-month high of 48.6 in April to 40.4 in May and versus an expected 47.0 reading. April’s figure surpassed the expected level of 43.5. May was the ninth consecutive month of contraction and was also the weakest since last November. On May 31, Goldman Sachs (Goldman) lowered its May ISM manufacturing forecast for the next day by 0.5 points to 46.7 due to the disappointing Chicago PMI figure.
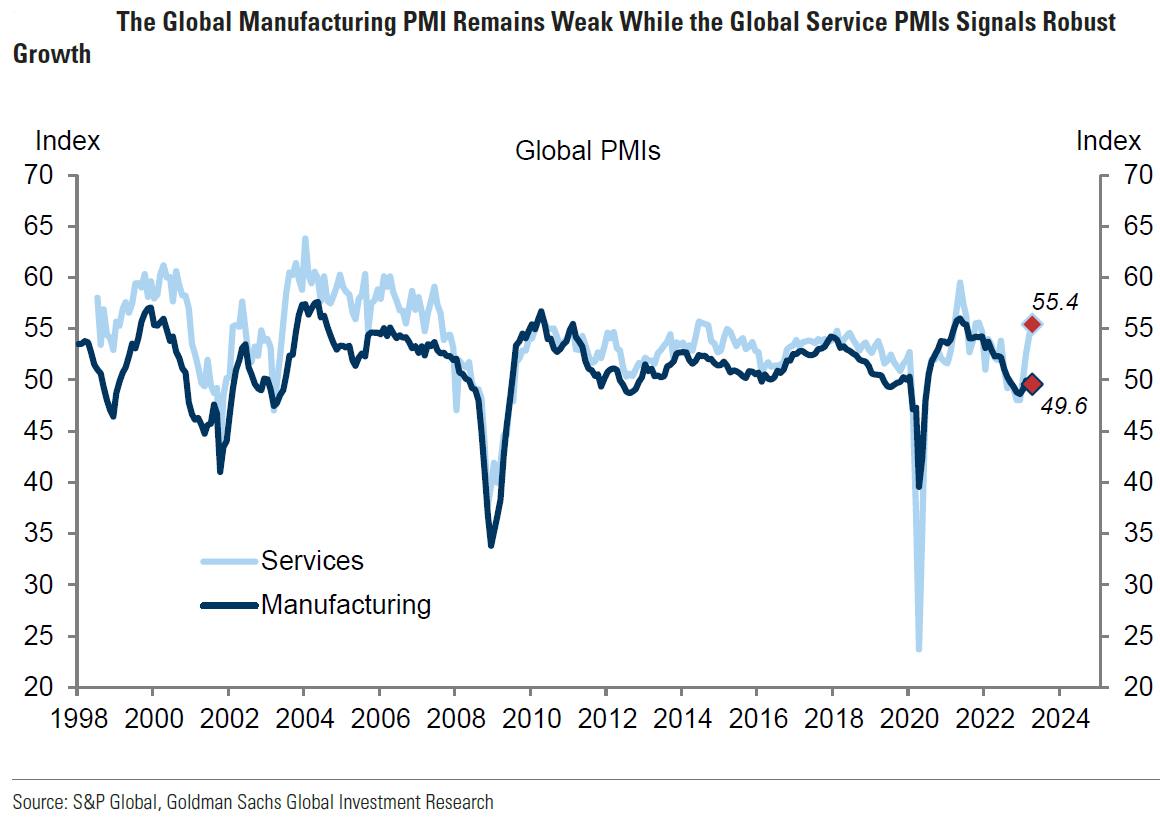
Explaining Divergent Trends of Manufacturing and Services PMIs
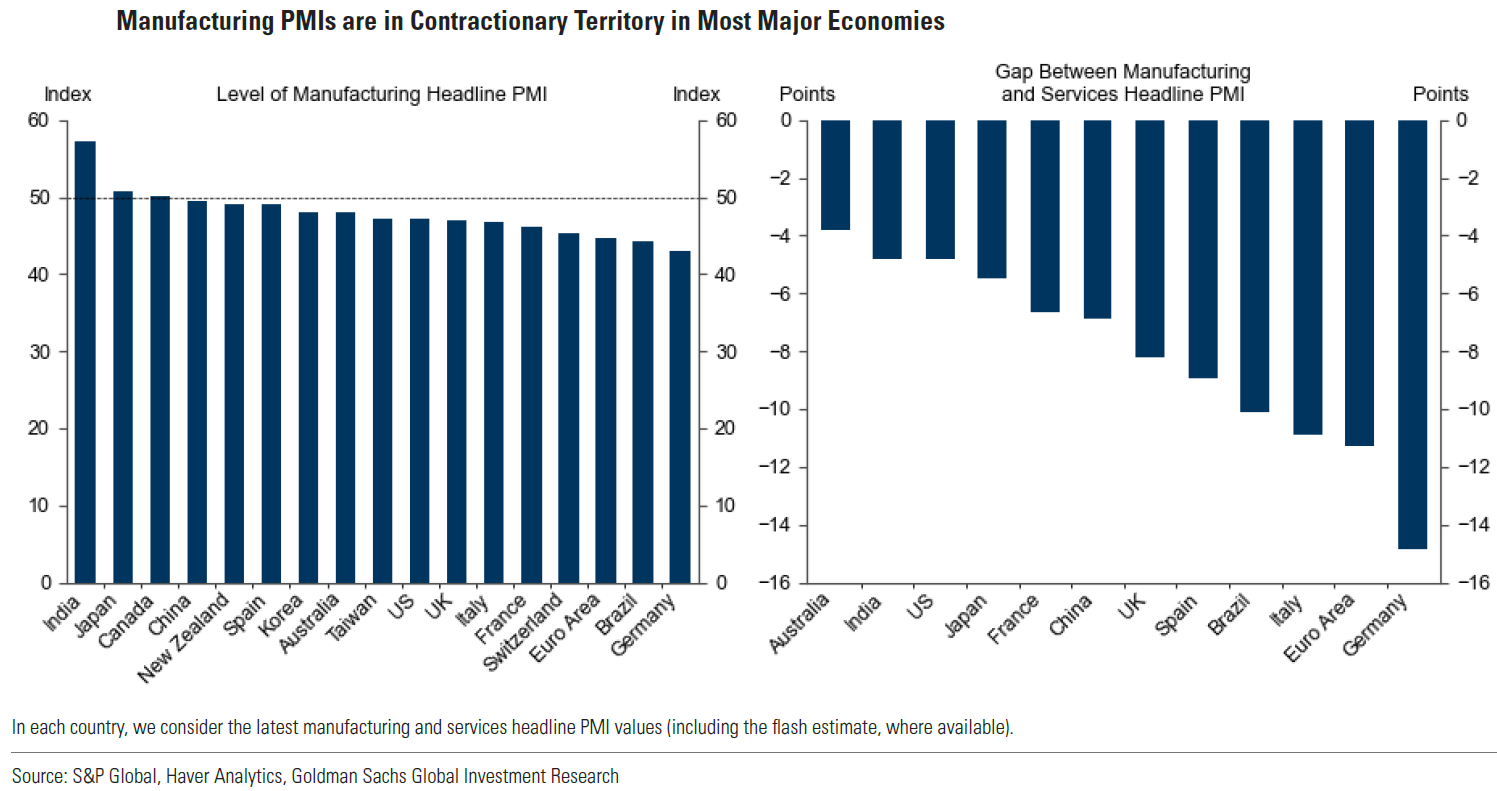
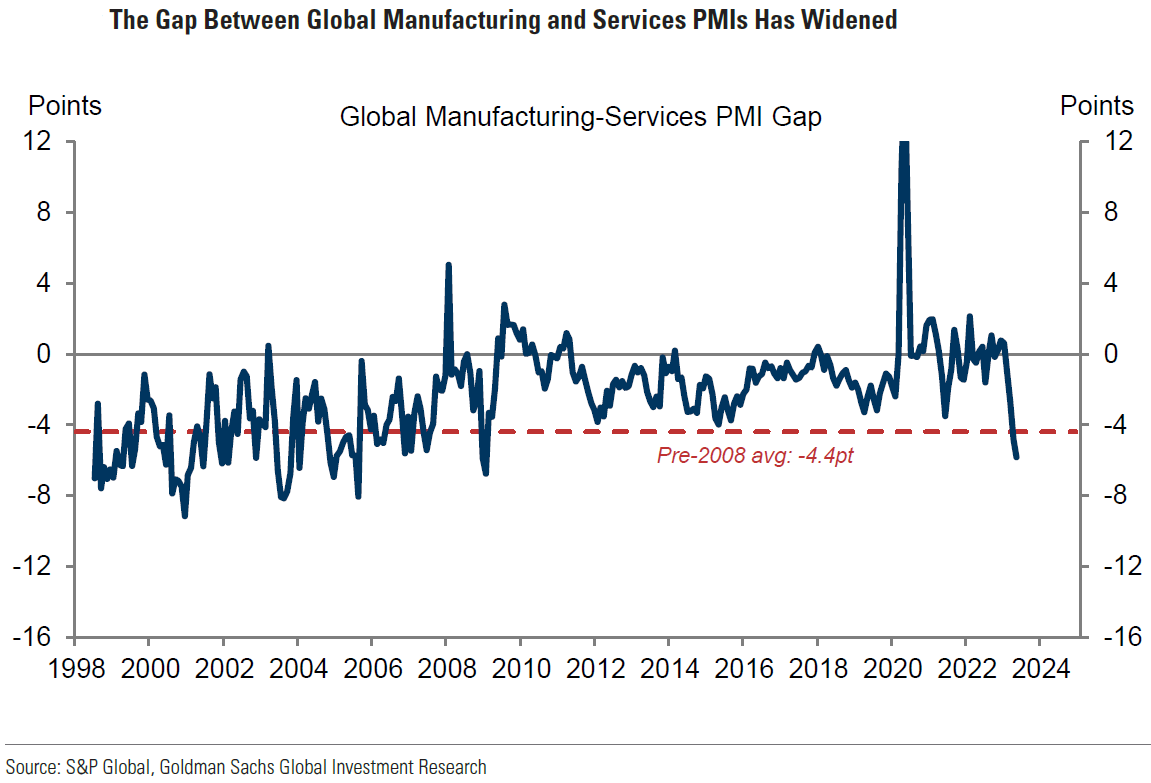
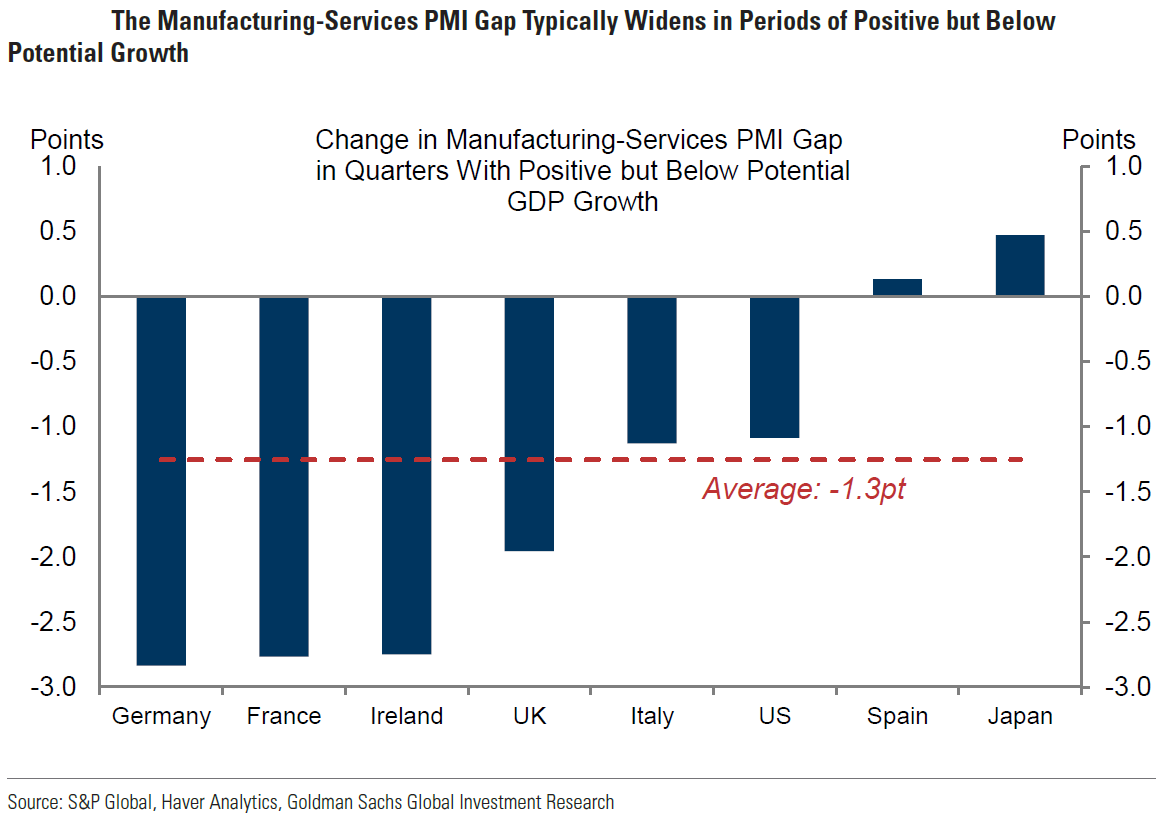
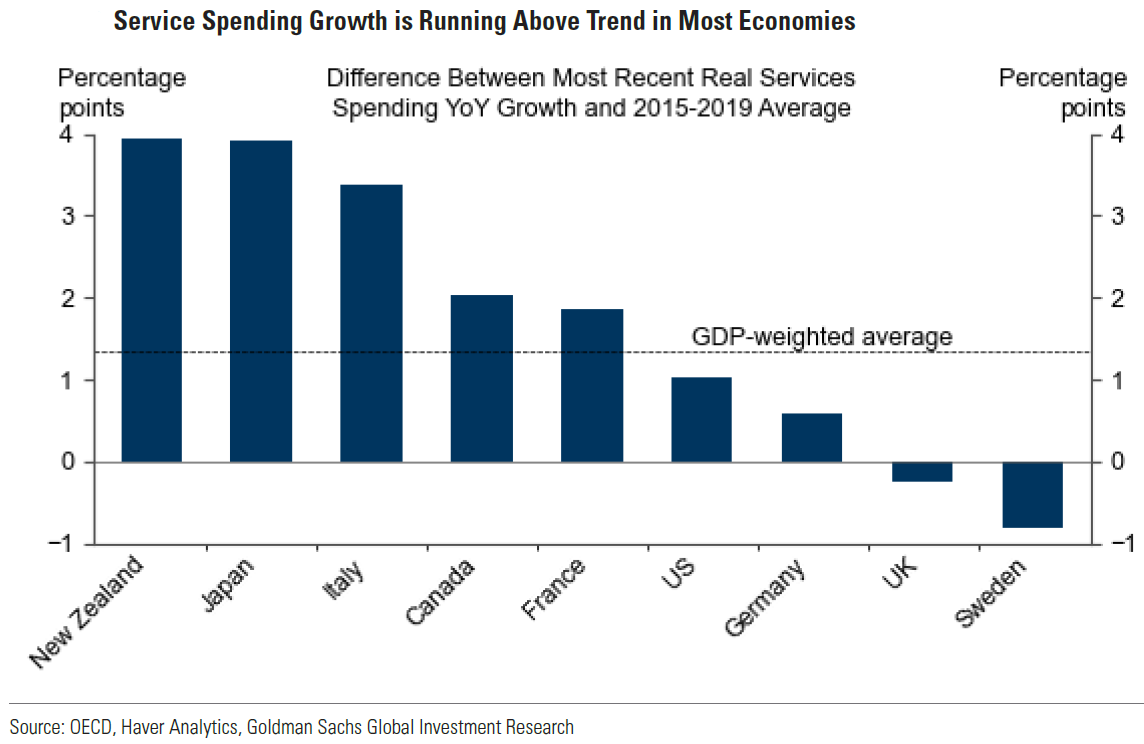
In last week’s commentary, we analyzed Eurozone flash PMIs for May and highlighted the divergence between manufacturing and services PMIs. This week’s final Eurozone PMIs were substantially similar to the flash data. These divergences have been noteworthy in the PMI data from the U.S. as well as China. We mostly agree with most of the June 1 Goldman Sachs analysis on this topic. Goldman recognized that global manufacturing PMIs have been contracting since last October, while services PMIs have “signaled” robust growth. The underperformance of manufacturing PMIs has been evident across all major economies. Goldman offered three reasons. In general, manufacturing and goods production are more sensitive to tighter financial conditions and higher interest rates and are more cyclical in nature. Slowing but still growing economies could produce the type of economic growth that could exacerbate these trends. Second, as we have highlighted many times in our past commentary, many service sector types of activities were mostly prohibited or made very difficult to enjoy “properly.” Consumers turned their focus on to the purchase of goods instead. Normalizing these pandemic trend benefits many services types of activities to the detriment of goods and manufacturing. As supply chains have normalized, inventory levels have been reduced, which has also weighed on manufacturing activities. Third, softening import demand from countries tied to the disappointing reopening of China in terms of manufacturing activities has probably contributed to lackluster manufacturing activities. Goldman has calculated that these three reasons account for roughly 75% of the gap between services and manufacturing PMIs. These divergences could persist for quite some time. Although this gap has widened to its largest level since 2009, it’s not unusually large prior to the Global Financial Crisis.
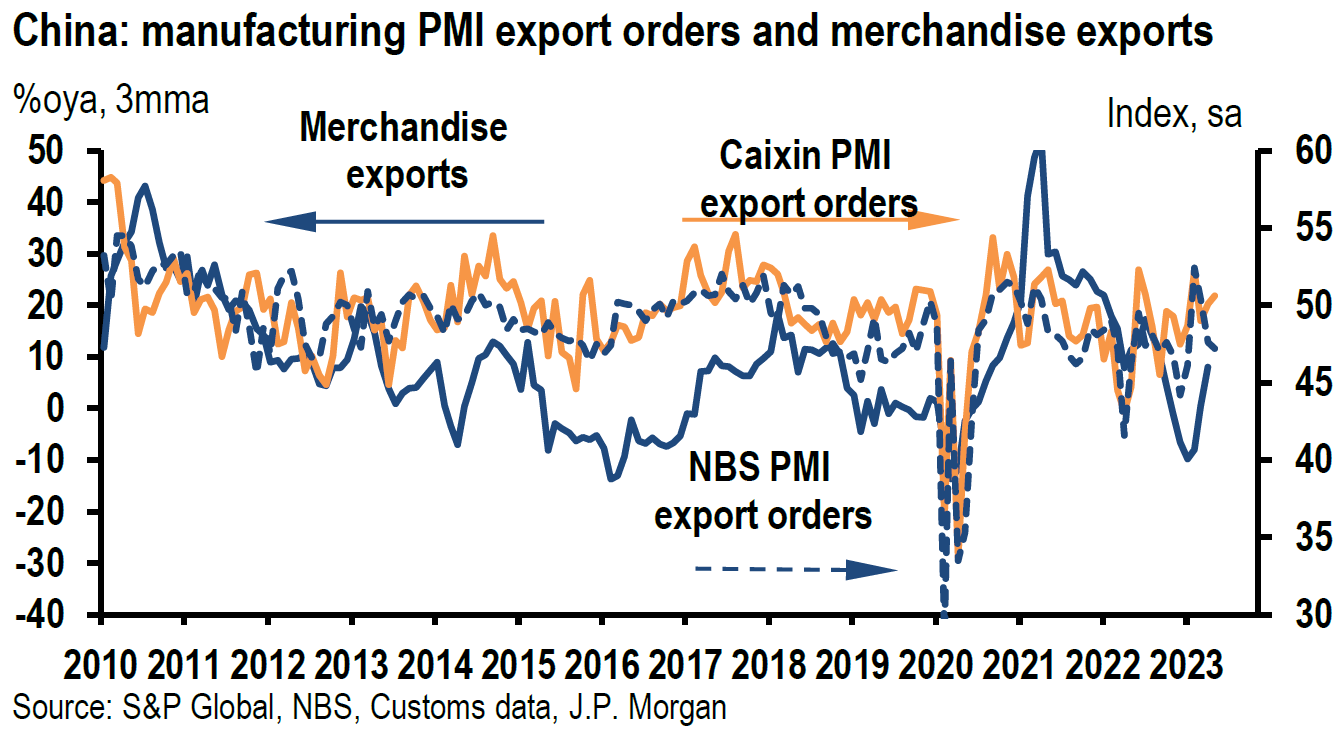
China May NBS PMIs for Manufacturing and Non-Manufacturing Confirm Divergent Trends
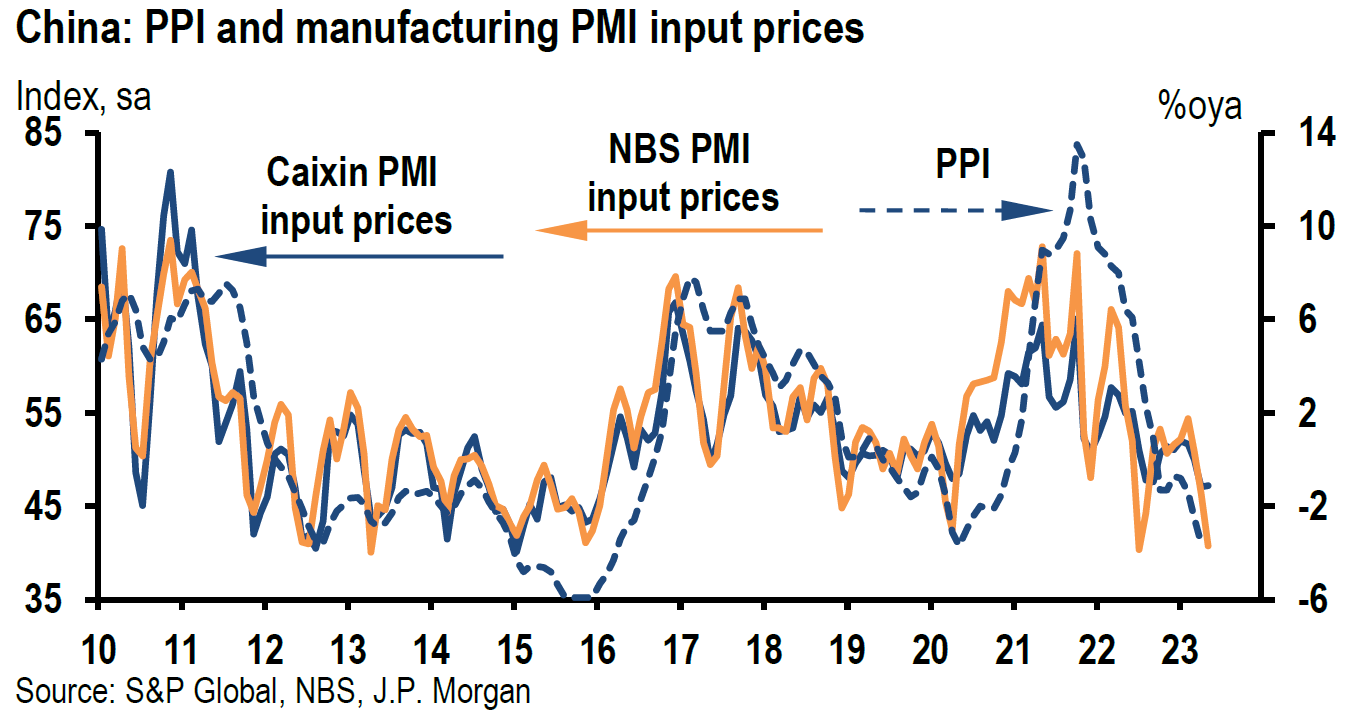
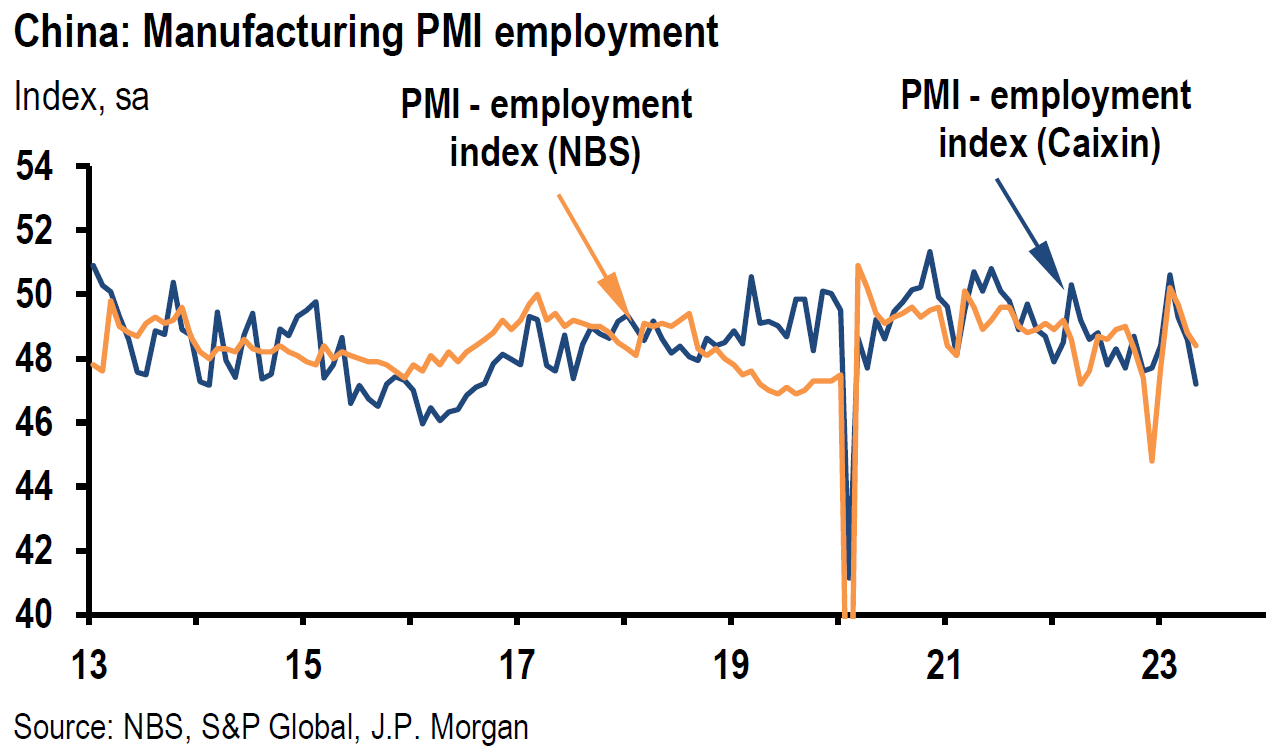
The official China PMI data are released by China’s National Bureau of Statistics (NBS). The NBS manufacturing PMI decreased to a lower than expected 48.8 in May from 49.2 in April and lower than the expected level of 49.5. May’s level was the weakest in five months. A rebound was expected from April’s more dramatic drop of 2.7 points. The output sub-index, the new orders sub-index and the employment sub-index all declined and were all in contractionary territory. the NBS commented that the drop in May’s PMI reading was due to insufficient demand. The input cost sub-index decreased sharply from 46.4 in April to 40.8. selling prices also showed a notable decline to 41.6 from 44.9 in April. These price drops were at least partly due falling commodity prices and muted demand. The NBS non-manufacturing PMI also decreased in May but remained solidly in positive territory as it continued to expand, but at a slower rate. This index includes both the services and construction sectors. Non-manufacturing PMI fell to 54.5 in May from 56.4 in April and was lower than the consensus forecast of 55.2. The underperformance of the services sector relative to manufacturing, confirms our belief that China’s “reopening” continues to be led by services.
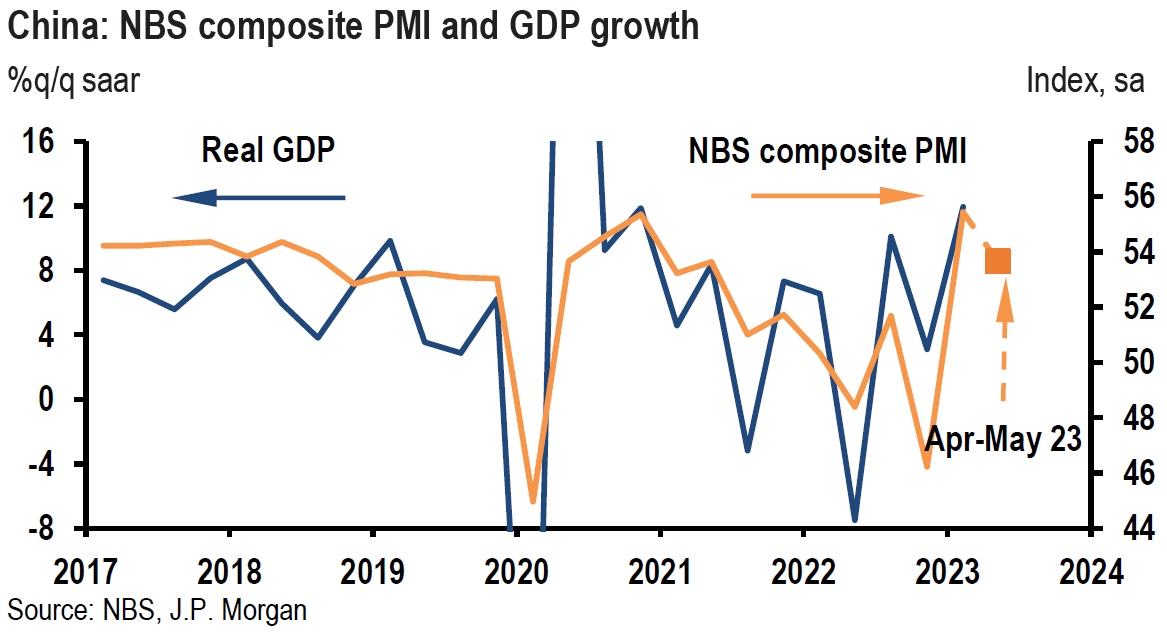
Source: JP Morgan, China (6-1-2023)
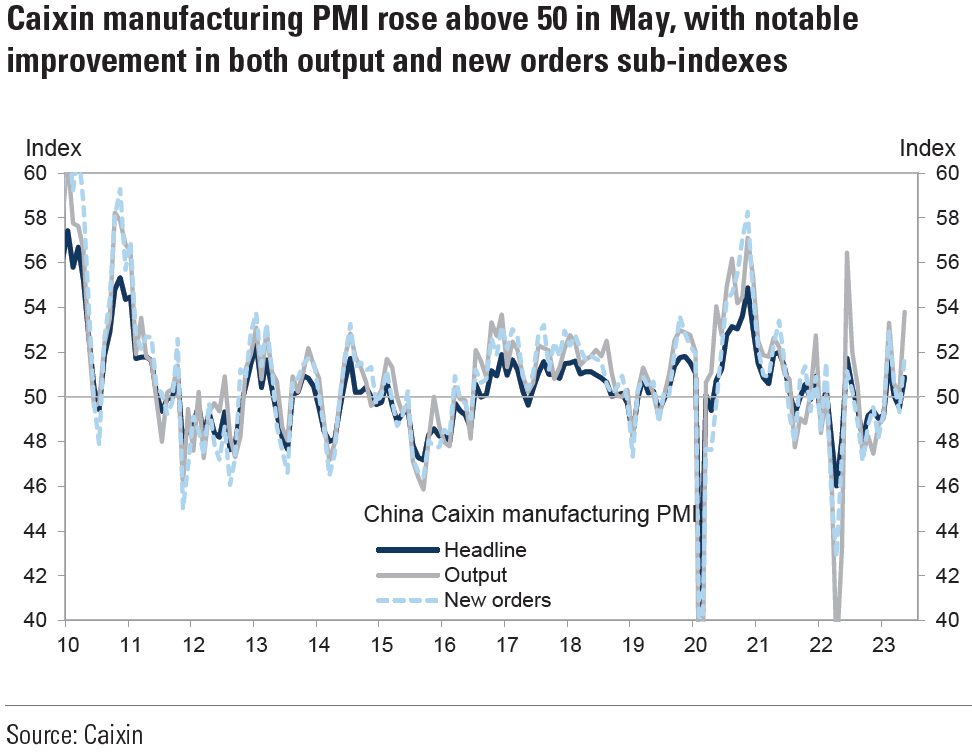
China May Caixin/S&P Global Manufacturing PMI Unexpectedly Expands
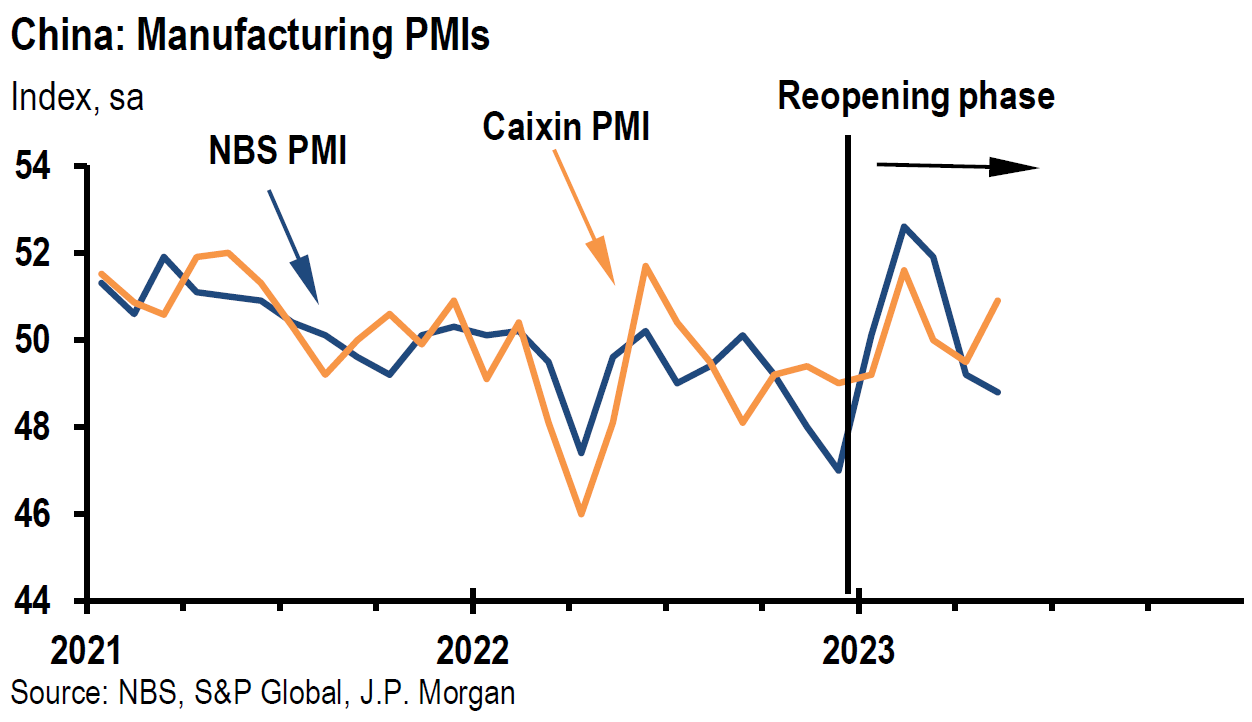
Caixin manufacturing PMI increased to 50.9 in May from 49.5 in April and above the expected level of 49.5. Companies comprising the Caixin PMIs are typically smaller and more export-oriented companies that are focused more on machinery inputs. In contrast, companies that comprise the NBS PMIs are typically SOE’s (state-owned enterprises) that are larger and whose inputs are more oriented to materials. Geographic differences and the timing of the two surveys may be other factors accounting for the differences between the official NBS and private Caixin surveys. In marked contrast to the NBS surveys, the Caixin output sub-index rose to from 50.2 to 53.8, the highest reading since June 2022. The Caixin new orders sub-index also rose into expansionary territory at 51.8 from 49.3 in April. We found it notable that the employment sub-index declined from 48.6 to 47.2, the lowest reading since February 2020.
Source: Goldman Sachs, China: Caixin manufacturing PMI notably above consensus in May (6-1-2023)
U.S. May Nonfarm Payrolls Exceed Expectations by Wide Margin, Unemployment Rate Higher Than Expected
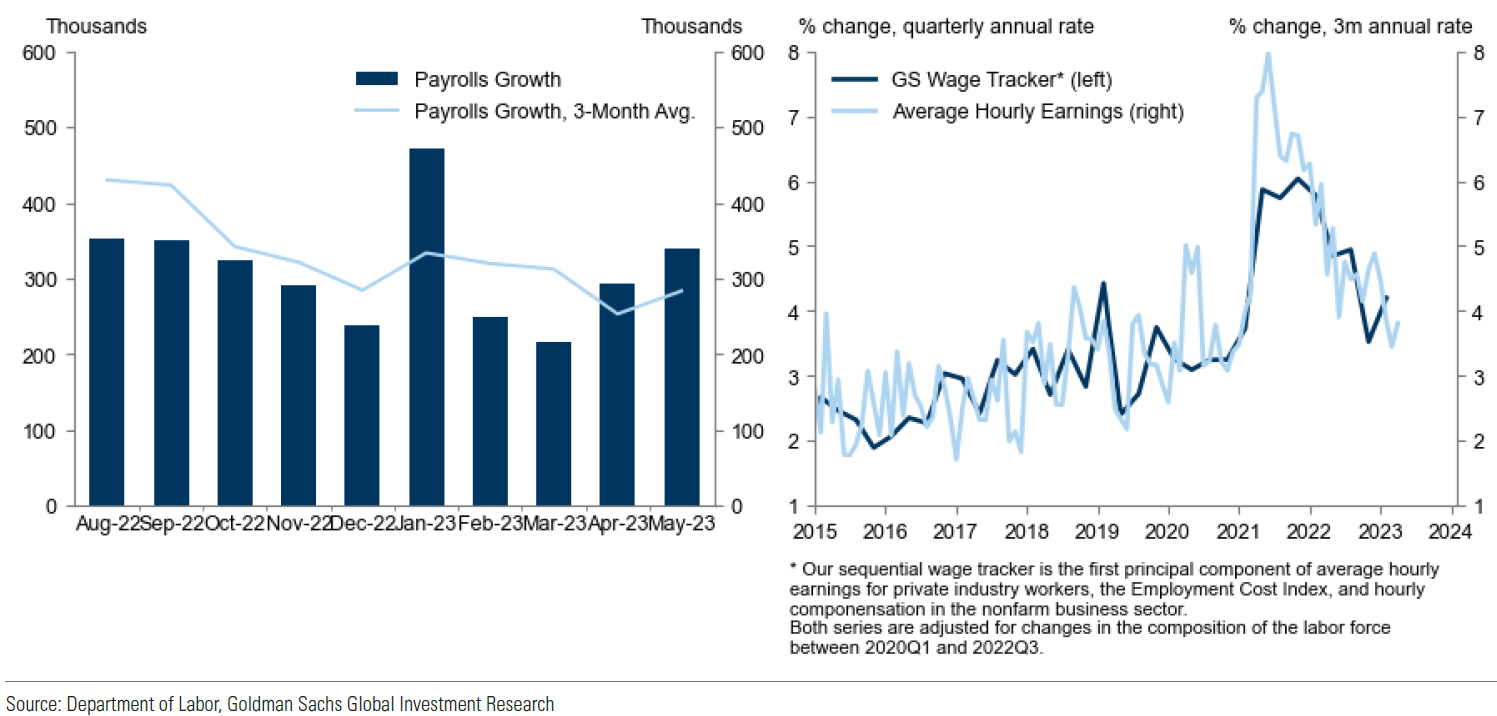
Total nonfarm payroll employment increased by 339,000 (including 283,000 private sector jobs) and the unemployment rate rose by 0.3 percentage points to 3.7% against expectations of 190,000 and 3.5%, respectively. This was the highest jobless rate since last October. The 283,000 increase in private sector jobs included 26,000 jobs in the goods producing sector and 257,000 in the service-providing sector. The labor force participation rate of 62.6% in May was unchanged from April. Average hourly earnings for employees on private nonfarm payrolls rose 0.33% m/m and 4.3% y/y. The m/m increase in hourly earnings fell from April’s revised 0.39% m/m increase. April’s increase was revised lower by 9 basis points. The y/y increase in average hourly earnings was 0.1% lower than that of April. Average weekly hours fell 0.1 to 34.3 and aggregate hours declined 0.1% despite the increase on payrolls. Nonfarm payroll employment for March was revised higher by 52,000 and for April was revised higher by 41,000 for a combined total for those two months of 93,000. The odds for a June Fed hike increased to 38% according to CME group data after the release of this report. We view the increased unemployment rate, which is based on a household survey as a possible indication that this employment report might not have been as robust as first appears. We were also encouraged by the downward trajectory of wage growth metrics.
Source: Goldman Sachs, USA: Nonfarm Payrolls Jump but Unemployment Rebounds; Average Hourly Earnings Growth Slows (6-2-2023)
Bottom Line
For the time being we are maintaining our basic investment approach as expressed in last week’s commentary. We continue to prefer high quality stocks that offer good balance sheets, as well as relatively stable cash flows and profit margins. We prefer a global diversified portfolio for long term investors. We continue to stress that stock selectivity in this current environment is of paramount importance. We foresee continued financial market volatility.
We are inclined to give the benefit of the doubt as to the sustainability of the broadening out of the U.S. stock rally as shown on Friday. We will continue to monitor financial markets very closely for more “clues.” The “true” bottom line is that “No One Knows.”
Definitions:
Fed’s Beige Book – The Beige Book is a qualitative review of economic conditions drawing on reports from 12 district banks. It is published eight times annually before meetings of the Federal Open Market Committee, which uses the results in its planning and decision-making processes.
CME FedWatch Tool – This tool acts as a barometer for the market’s expectation of potential changes to the fed funds target rate while assessing potential Fed movements around FOMC meetings.
Job Openings and Labor Turnover Survey (JOLTS) – The job openings and labor turnover survey are a monthly report by the Bureau of Labor Statistics (BLS) of the U.S. Department of Labor counting job vacancies and separations, including the number of workers voluntarily quitting employment.
Job Openings – JOLTS defines Job Openings as all positions that are open (not filled) on the last business day of the month.
Initial Unemployment Insurance Claims – Initial claims are new jobless claims filed by U.S. workers seeking unemployment compensation, included in the unemployment insurance weekly claims report.
Continuing Claims – Continuing claims track the number of U.S. residents filing for ongoing unemployment benefits in a given week. Continuing claims measure ongoing unemployment benefits, which is in contrast to initial claims, which track new filings for benefits.
ISM Manufacturing PMI – The ISM manufacturing index, also known as the purchasing managers’ index (PMI), is a monthly indicator of U.S. economic activity based on a survey of purchasing managers at more than 300 manufacturing firms. It is considered to be a key indicator of the state of the U.S. economy.
China National Bureau of Statistics (NBS) Manufacturing PMI – In China, the NBS Manufacturing Purchasing Manager Index measures the performance of the manufacturing sector and is derived from a survey of more large-scale, state-owned companies.
China National Bureau of Statistics (NBS) Nonmanufacturing PMI – China Non-Manufacturing Purchasing Managers Index provides an early indication each month of economic activities in the Chinese Non-manufacturing sector.
China Caixin Manufacturing Purchasing Managers Index – The Caixin PMI is a composite indicator designed to provide an overall view of activity in the manufacturing sector and acts as a leading indicator for the whole economy.


