")

Weekly Summary: February 27 – March 3
Key Observations:
- The combination of slowing rates of disinflation that have been reflected in some of the economic data of the past few weeks along with some indication of increasing rates of global growth have contributed to an environment where many U.S. stocks have shown a resiliency in the face of rising interest rates. Better than expected economic growth in China and Europe recently have contributed to this scenario. As we have highlighted previously, last year was all about the Federal Reserve’s (Fed), policies, interest rates and inflation. This year has become more complex with the added focus of economic growth as a concern – too “hot” or too “cold” and how will the Fed react as it is now “data dependent.” We believe that it could be “critical” that the Fed maintain its pace of 25 basis points (bps) hikes in the federal funds rate. We surmise that U.S. stocks would be put at much greater risks of severe downturns if the Fed were to revert to 50 bps or higher rates of increases. We have maintained that the current environment remains favorable for stock-pickers.
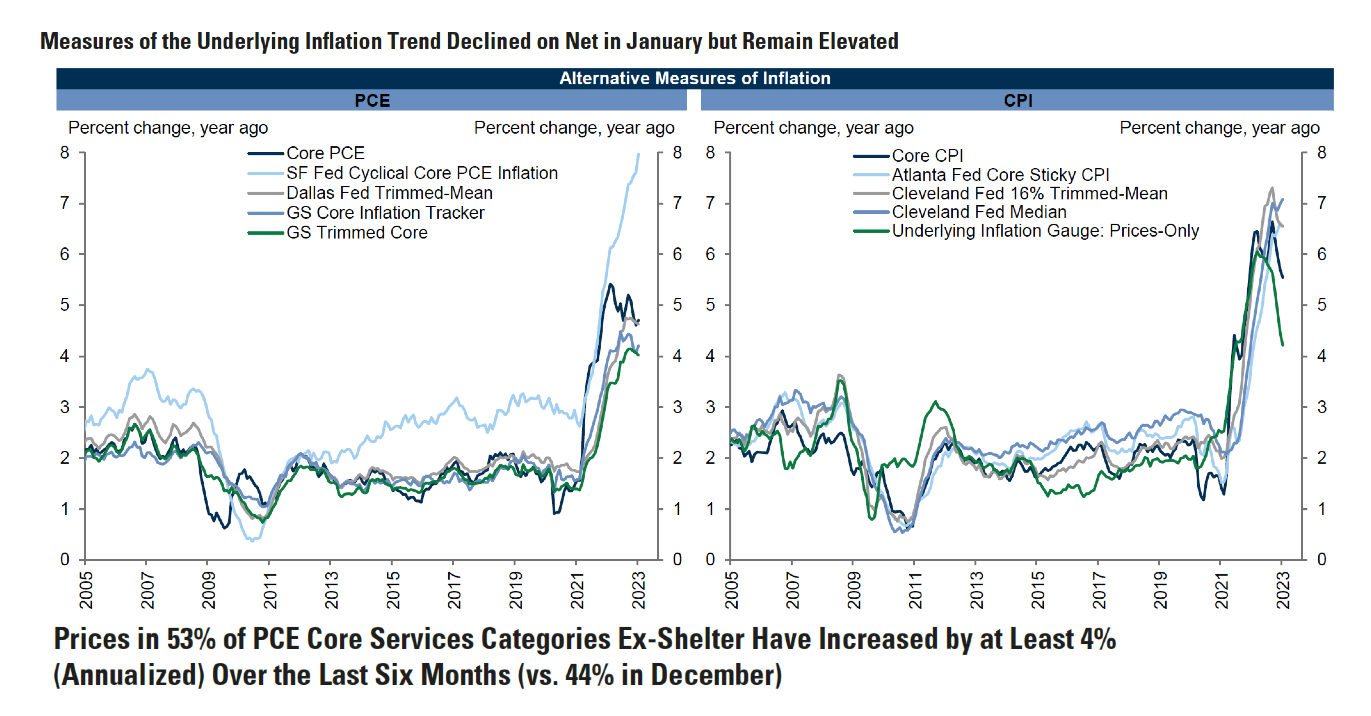
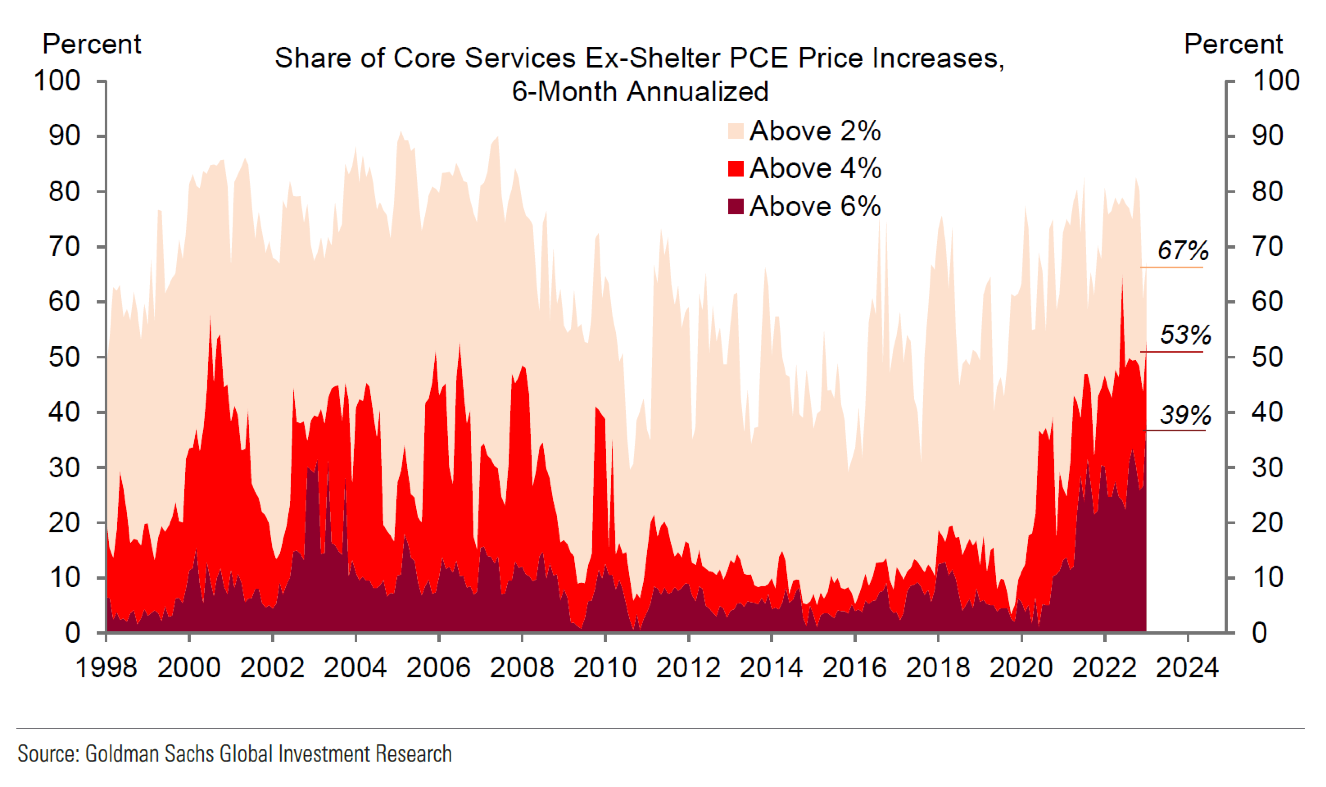
- Given the large distortions through seasonal adjustments and other anomalies that occur at the onset of a new year as we have described in our prior commentaries, we remain reluctant to change our basic views until we can analyze at least one more month of economic data. In the meantime, we continue to forecast a disinflationary trend continuing that includes slowing rates of wage growth. We do not anticipate a smooth trendline. We anticipate an unpredictable and “bumpy” path as inflation rates diminish.
- It appears that the interest rate adjustments across many European countries have recently been more severe than that of the U.S. Terminal interest rate policy determinations appear to assume more substantial increases by the European Central Bank (ECB) when compared to the Fed. This should not be surprising since the Fed is further along in its tighter monetary policies and that U.S. disinflation has been more pronounced than that of Europe. At some point, we expect the United States dollar (USD) to resume a downward trajectory when it becomes more evident that global economic growth is accelerating relative to that of the U.S.
- We found it somewhat puzzling that the expectation component of The Conference Board’s consumer confidence index descended to the lowest level since July of last year even as the “labor market differential” increased, suggesting a very tight labor market. We found many “mixed” messages on economic growth and inflation in our analysis of economic data this week. Hopefully, the next set of data will provide us with more clarity.
The Upshot: Our general investment approach remains the same as depicted in last week’s commentary. We maintain our preference for quality stocks with good balance sheets, relatively stable cash flows with stable margins. Volatility across sectors continues to be supportive of a diversified global portfolio for long term investors. We expect volatility to continue across asset classes.
We maintain our strategy of buying equities only on downturns. We continue to stress that stock selectivity in this current financial market environment is of paramount importance. A risk-reward analysis remains central to our investment approach.
Source: Goldman Sachs US Monthly Inflation Monitor: February 2023: Start-of-Year Price Increases (Walker) (3/2/2023)
“Open Mind for a Different View” – Many U.S. Stocks Resilient as Interest Rates Rise
Following the worst week of the year last week and given the rise in interest rates through Thursday of this week, we thought that U.S. stocks showed a strong resiliency in general. The 10-year Treasury yield breached the 4.0% threshold for the first time since last November as it rose close to 12 bps to 4.064% during this time period. Many European rates showed an even bigger increase. The yield for the German 10-year Bund – sovereign bond – rose 21 bps to yield 2.74%. Financial markets priced in higher terminal rates for both the U.S. federal funds rate and for the ECB key policy rate –its deposit rate. The S&P 500 managed a gain of 0.28% during this four-day period. Perhaps most surprising was that the S&P 500 Information Technology sector was one of only five out of eleven sectors to register a positive gain during this period. This sector is considered generally as a “growth” and “long duration” sector that is sensitive to interest rate movements. Moreover, this was also the only positive sector in February and was the second-best performing sector for the first two months of this year. Many analysts and investors would not have expected such an outperformance in the face of rising interest rates. As we have tried to explain in our recent commentaries, there are many “cross-currents” at play this year that make the current economic and financial environment rather complex. When trying to analyze and understand such apparent anomalies, our basic analytical approach perhaps was expressed best in Metallica’s song “Nothing Else Matters.” However, we do not mean to imply that this is our favored sector. As prices fluctuate, our risk-reward assumptions will also fluctuate. We still adhere to a very diversified global portfolio for long-term investors that highlights our highly selective stock specific approach. “Every day for us something new; Open mind for a different view; And nothing else matters … Forever trusting who we are; And nothing else matters.”
Changing Focus of Financial Markets
Since the end of last year, we expected that this year could prove to be a more “difficult” and “unpredictable” trading-type market when compared to the 2022 markets. In our opinion, the focus of financial markets in 2022 was on inflation, the Fed and interest rates. But now that we are in or at least close to “restrictive” territory in the federal funds rate – currently in the 4.5% to 4.75% range – the focus of financial markets can shift to economic growth concerns as well. The timing and the extent of these shifts in focus could be rather unpredictable. Many analysts and investors expected a moderating rate of economic growth this year. But the strong January U.S. employment growth and retail sales data raised concerns that U.S. economic growth might be too “excessive” to rein in inflation. European GDP growth rate assumptions were also increased by many analysts. Many measures of European inflation exceeded expectations and helped to accentuate a picture of stronger global economic growth and inflation. China’s February Purchasing Managers’ Indexes (PMIs) released midweek were also greater than expected.
Explaining U.S. Equity Resilience
In our commentaries over the last few weeks, we have tried to explain the myriad of reasons for the resilience of many U.S. stocks this year. If global economic growth continues to surprise on the upside, earnings should be more resilient as well. A higher inflation rate also could enable many companies to maintain their profit margins. A rise in interest rates in such an environment might not depress stock prices to the extent that many analysts predict when compared to an economic growth environment that is slowing more rapidly. As we indicated in last week’s commentary, the latest economic data we analyzed showed a resilient economy with a slowing rate of “disinflation.” We still expect disinflation to resume in the U.S., but probably on a more “bumpy” trajectory than the one to which we have become accustomed.
Fed Maintaining Pace of 25 bps Hikes in Federal Funds Could be “Critical” to Continued Equities Resilience
If the Fed were to maintain a pace of 25 bps increases to reach their ultimate “terminal” federal funds rate in an environment of somewhat stronger economic growth, a precipitous downturn in stocks could be postponed at least, if not avoided to the extent disinflation reasserts itself and wage growth resumes a slowing rate of increase. We surmise that for this fortuitous outcome to occur, the Fed must exhibit some “patience” in implementing their tightening monetary policies. We viewed the data that we analyzed as providing “mixed” signals on economic growth, inflation and expectations about future business prospects.
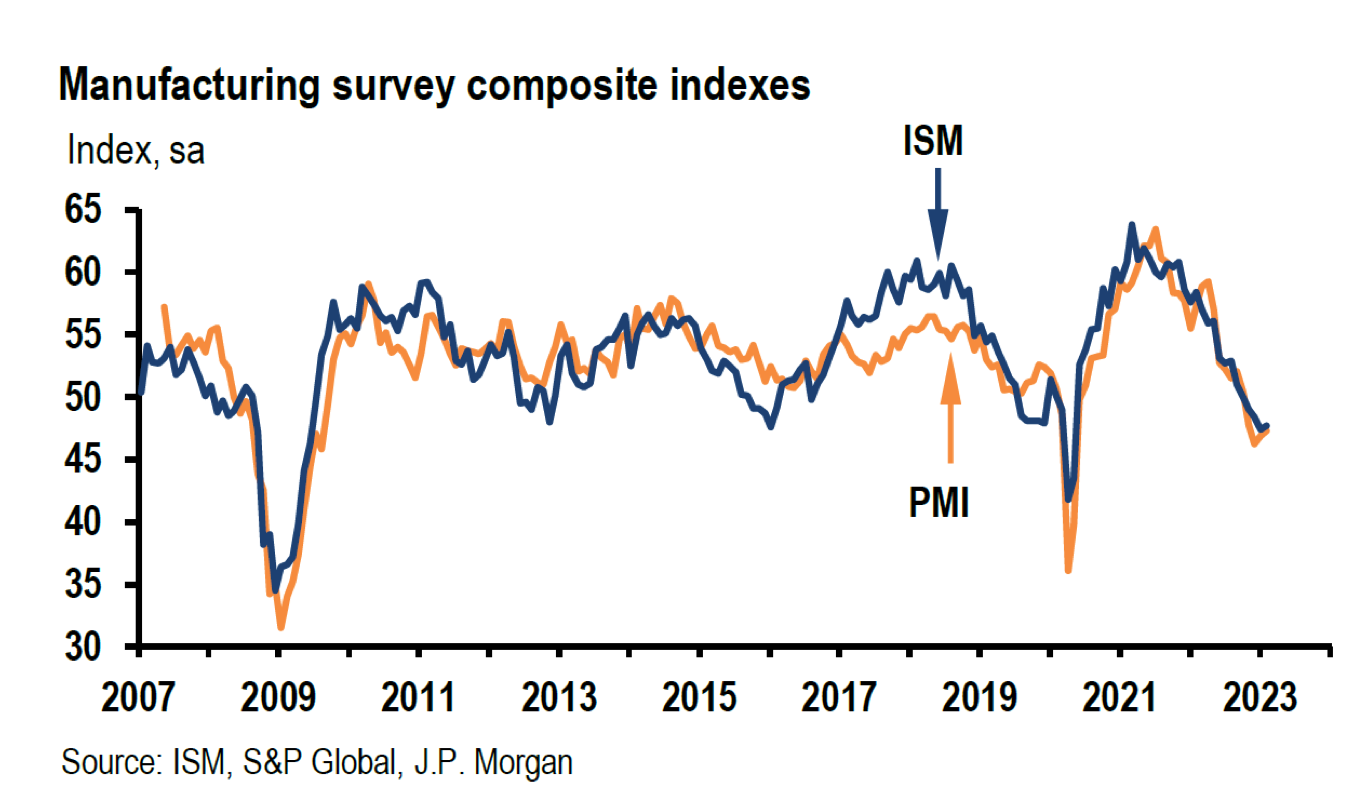
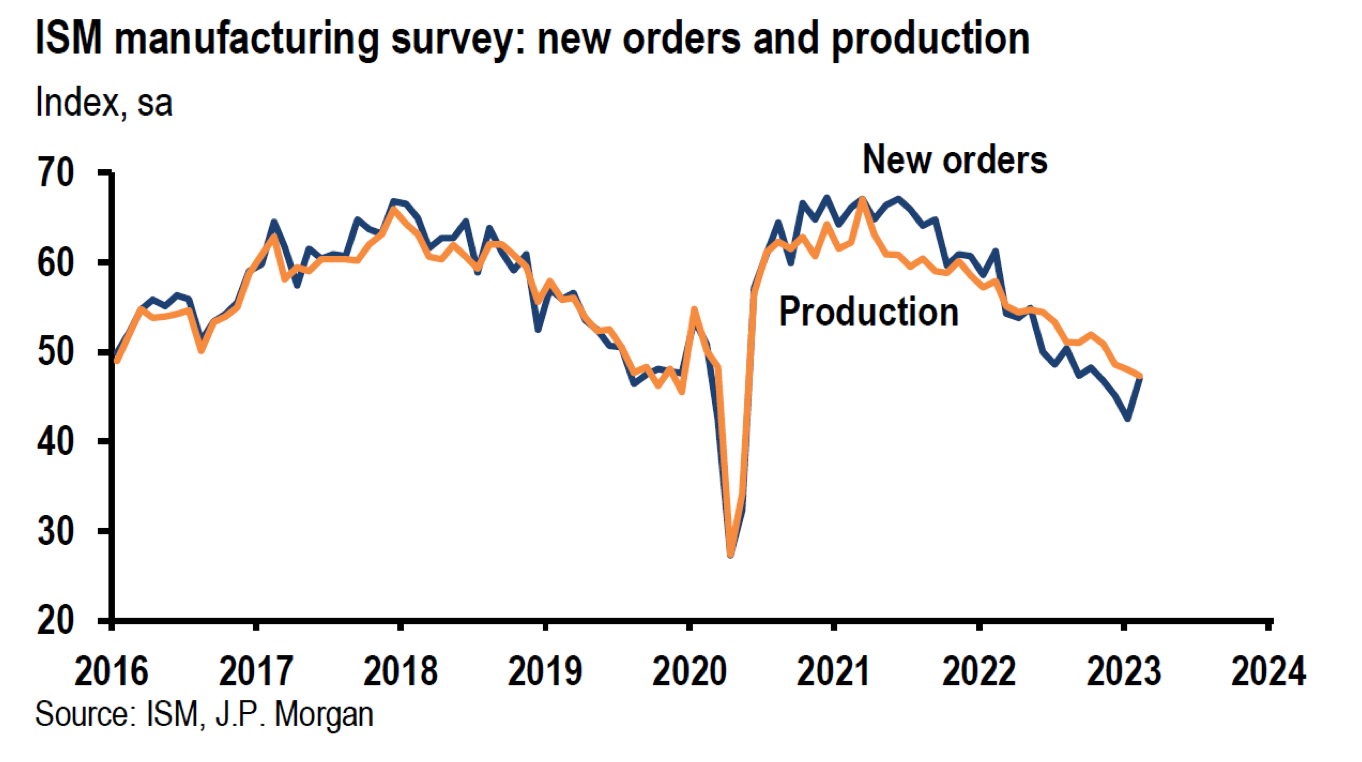
Much Greater-than-Expected “Prices Paid” in U.S. February Institute for Supply Management (ISM) Manufacturing PMI
The prices paid measure in this ISM report increased by a much-greater-than-expected 6.8 points to 51.3. It appeared that this was perhaps the single most important data point that spurred on the 10-year Treasury yield to finally breach the 4.0% threshold this year. The headline reading increased 0.3% from January’s reading to a still-contractionary reading of 47.7, and against expectations of 48.0. January’s reading was the lowest since May 2020. New orders posted a strong increase of 4.5 points but only could reach a still-depressed level of 47.0. Production dropped 0.7% to 47.3 and the employment index dropped 1.5 points to a contractionary level of 49.1.
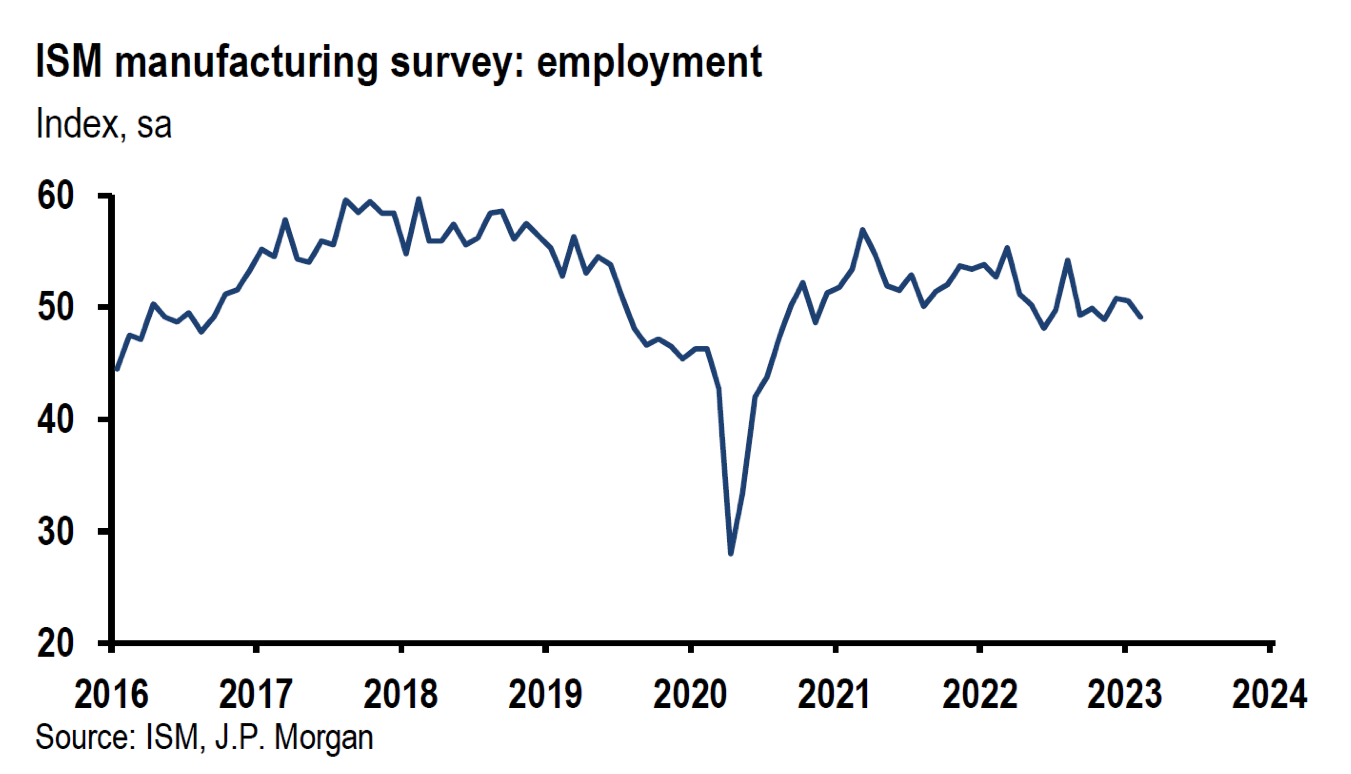
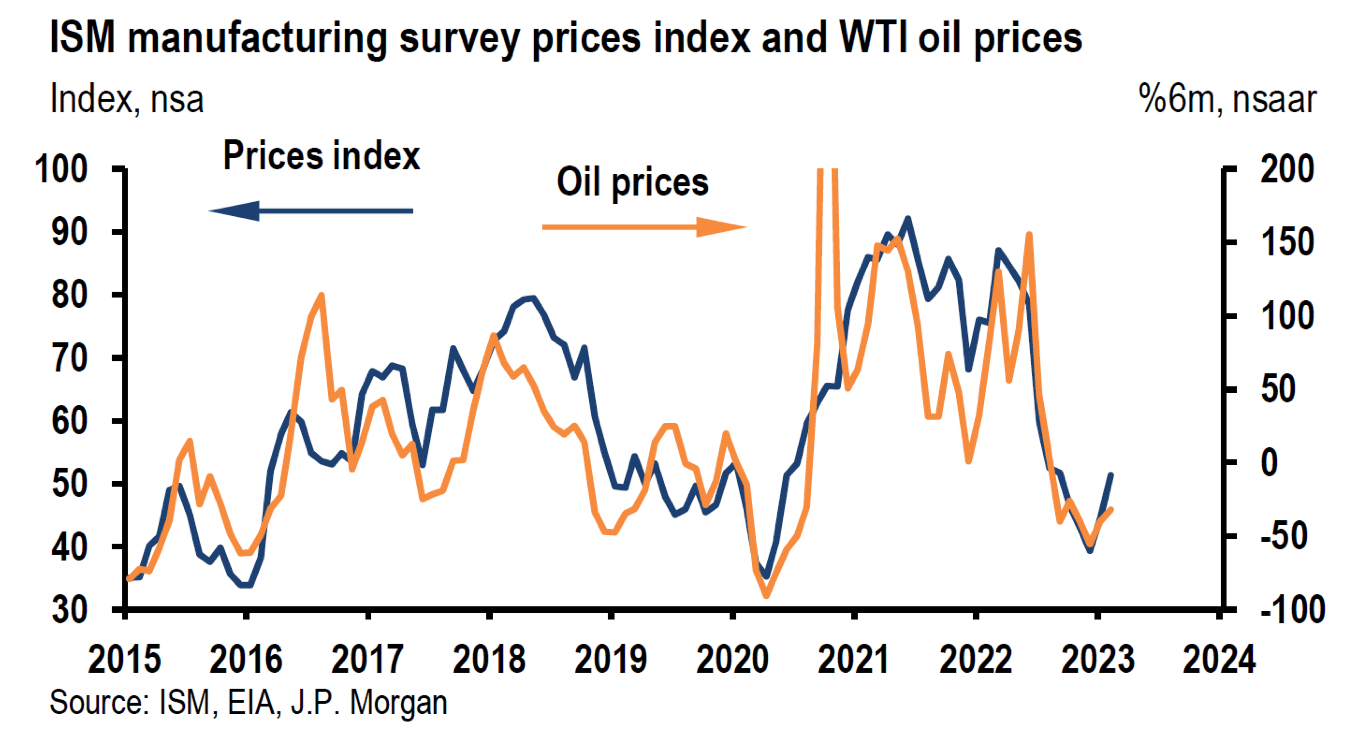
Source: J.P. Morgan US: ISM manufacturing survey moves up but stays low (3/1/2023)
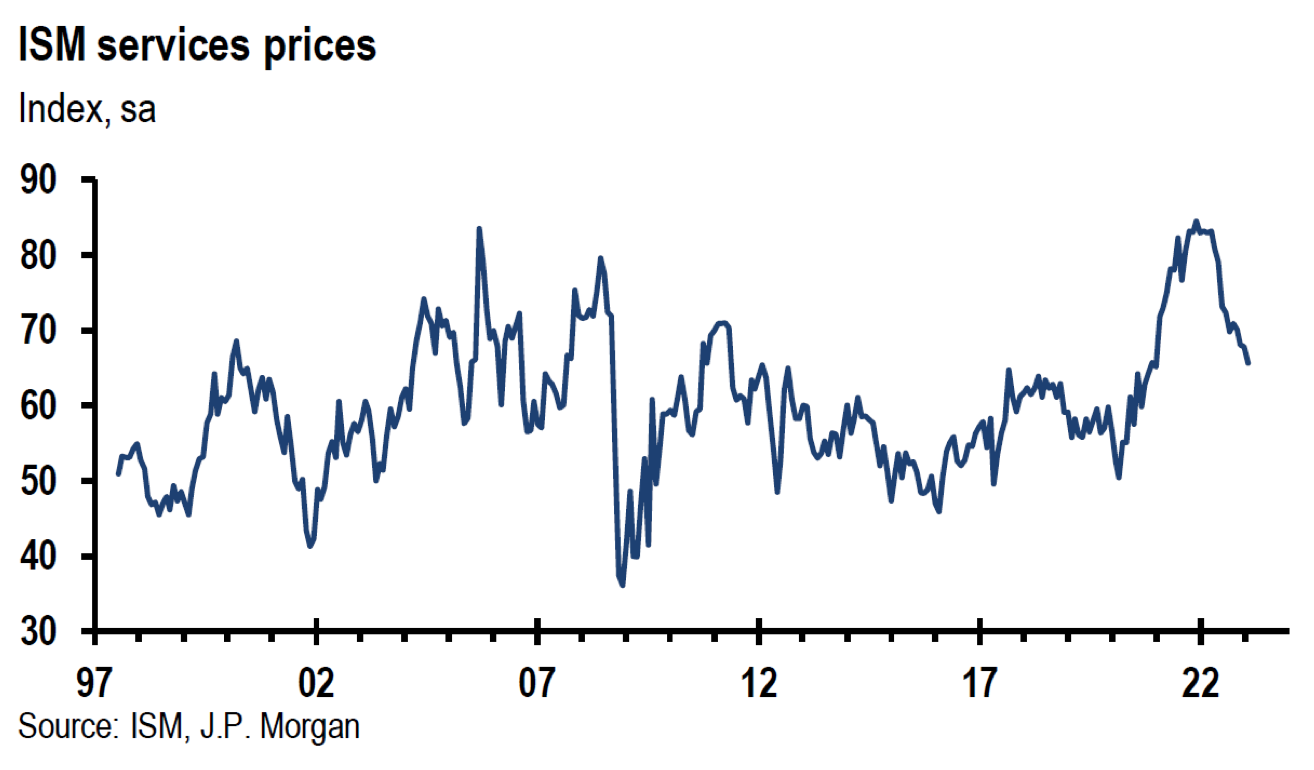
U.S. February ISM Services PMI – “Prices Paid” Drops Relative to January
Headline ISM Services PMI was 55.1, down from 55.2 in January and higher than the expected level of 54.5. The prices paid sub-index was 65.6 (lowest since January 2021), down from January’s level of 67.8, but higher than the expected 64.5. Other notable increases included the employment index at 54.9 (highest since December 2021) versus 49.8 expected and 50.0 prior (January); new orders at 62.6 (highest since November 2021) versus 58.5 expected and 60.4 prior; new export orders at 61.7 versus 59.0 prior. More muted changes included imports at 52.6 versus 53.0 prior; backlogs of orders 52.8 versus 52.9 prior; and inventories at 50.6 versus 49.2 prior. Supplier deliveries were 47.6, down from 50.0 in January, and indicating faster delivery times that were the fastest since June 2009. We view this report as a generally strong report, in particular in regard to new orders. We were somewhat encouraged by the decreases in prices paid even as they remained at elevated levels. Anthony Nieves, chair of ISM observed: “Business Survey Committee respondents indicated that they are mostly positive about business conditions. Suppliers continue to improve their capacity and logistics, as evidenced by faster deliveries. The employment picture has improved for some industries, despite the tight labor market. Several industries reported continued downsizing.” The downsizing referred to in the last sentence might help explain the 4.1 points drop in the business activity sub-index to 56.3.
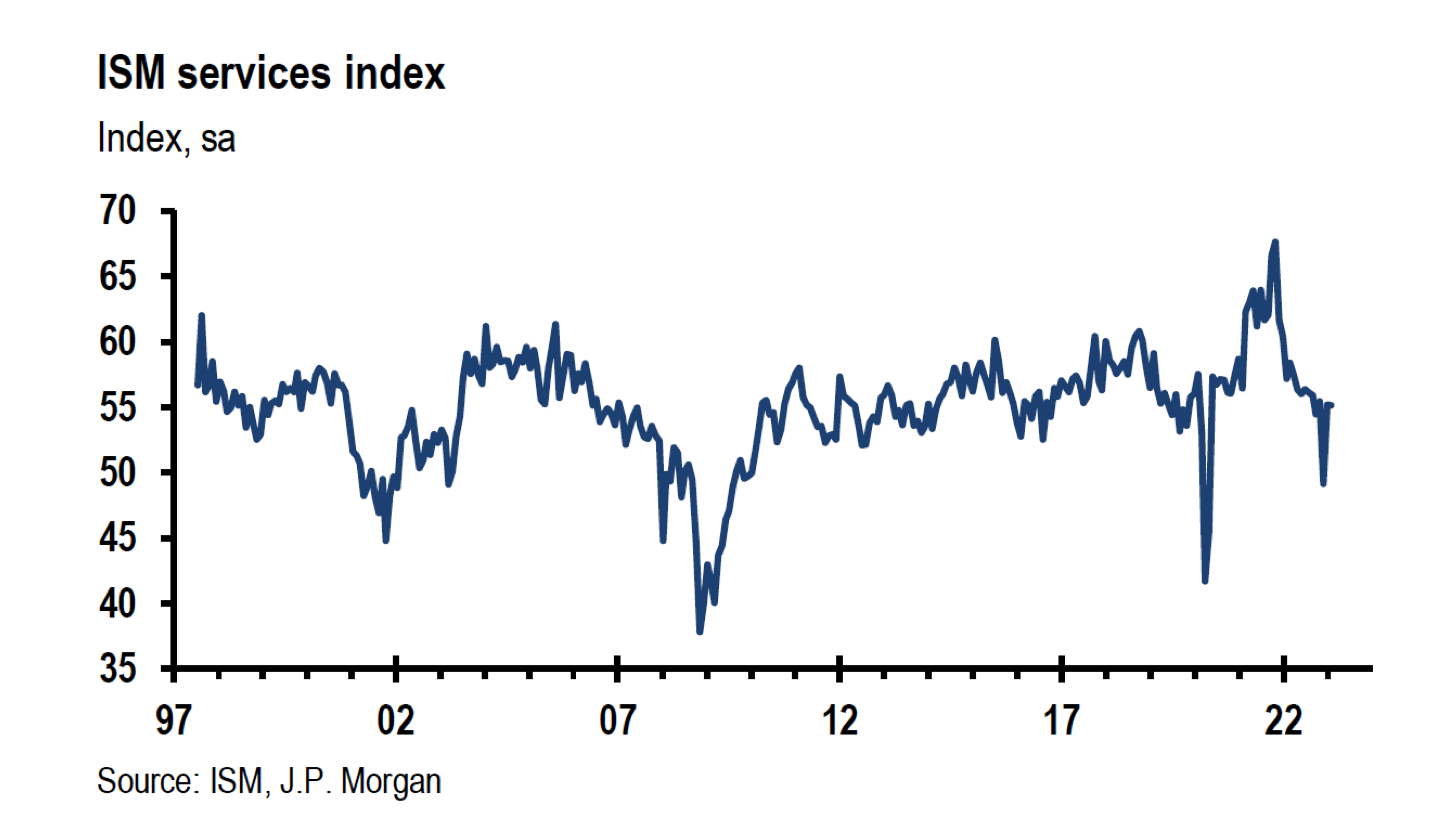
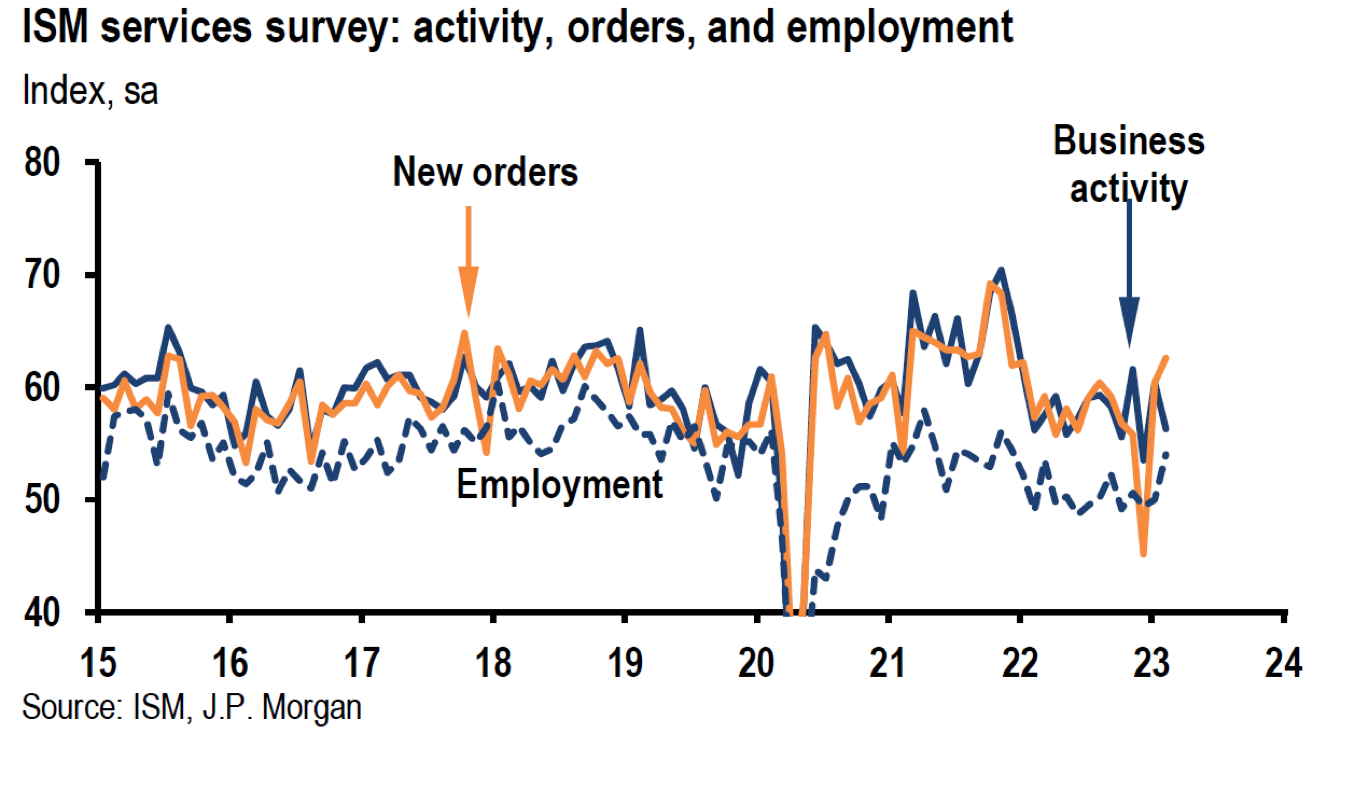
Source: J.P. Morgan US: Services ISM survey cools a touch in February (3/3/2023)
S&P Global Final February U.S. Manufacturing PMI
The headline reading of this survey showed a contractionary level of 47.3 compared to a preliminary estimate of 47.8, but higher than January’s level of 46.9. Unlike the ISM survey, manufacturers raised employment at the fastest pace in five months. In marked contrast to the ISM survey, input costs increased at a “softer” rate. However, “charge” inflation accelerated to a “marked” pace as firms tried to pass on higher input costs to their customers. There were also further contractions in production and new orders.
S&P Global Final February Eurozone Manufacturing PMI
Final Eurozone Manufacturing stabilized as manufacturing output ended eight months of contraction with a current reading of 50.1 versus 48.9 for January. February’s output increased as supplier delivery times saw their most rapid improvement since 2009. The faster delivery times enabled input costs to slow to the weakest pace of increases in almost two-and-half years. But manufacturing PMI dropped 0.3 points to 48.5 as pre-production inventories experienced the highest decline since May 2021. New orders fell for the tenth consecutive month as the decline in exports “quickened” as well. Input costs increased only marginally and to the weakest extent since September 2020. Selling prices of outputs stayed “sharp” even as they rose at the “softest” pace in two years. Future output expectations were at their highest level in a year.
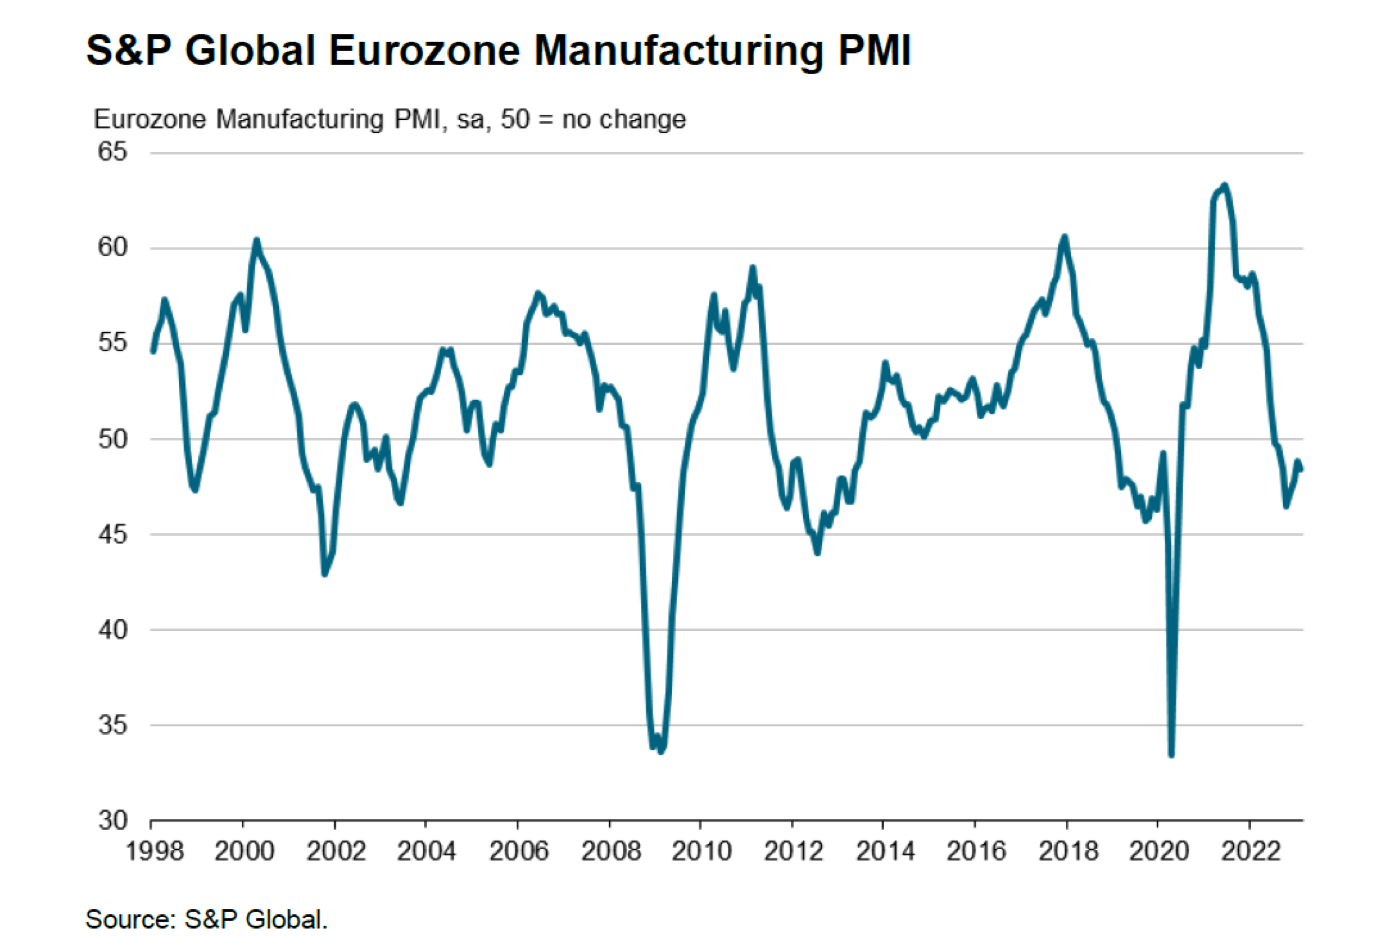
Source: S&P Global: S&P Global Eurozone Manufacturing PMI (3/1/2023)
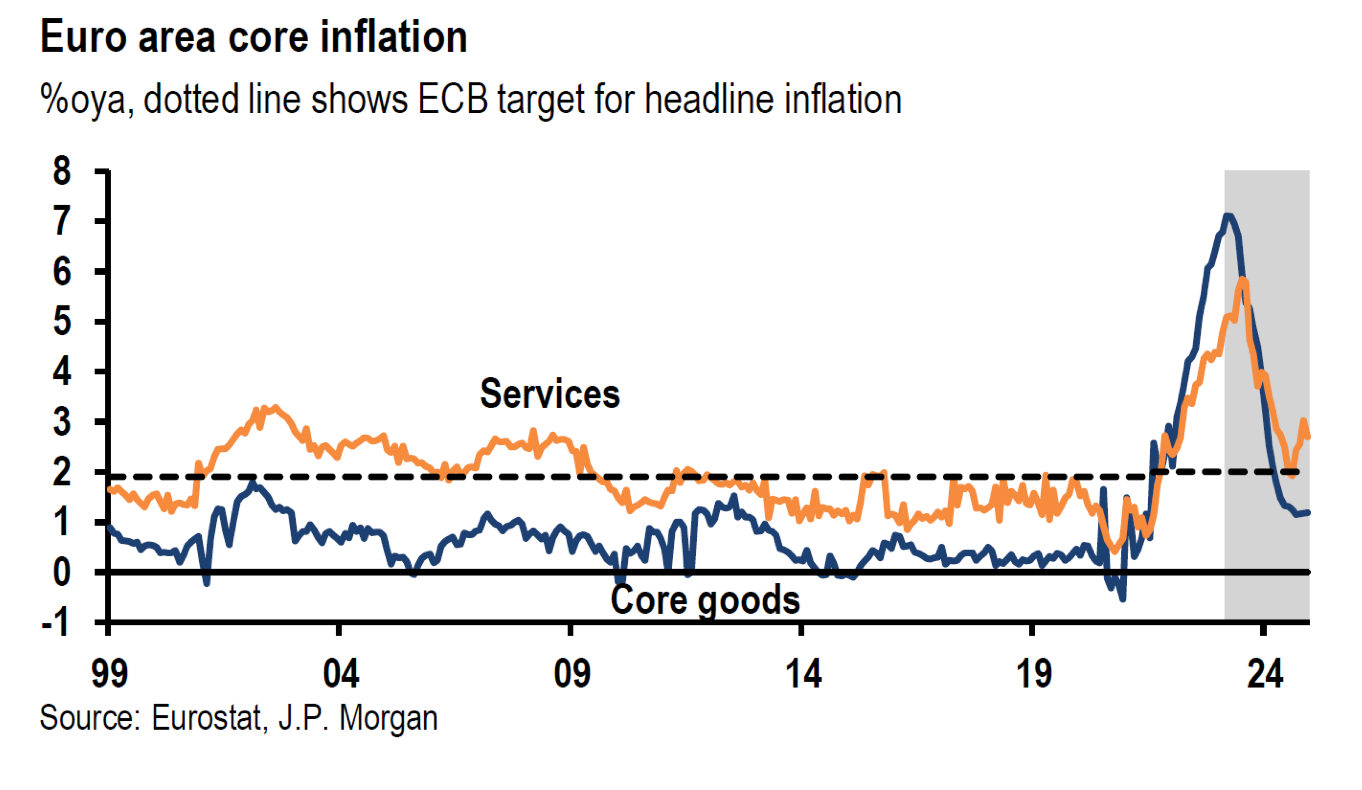
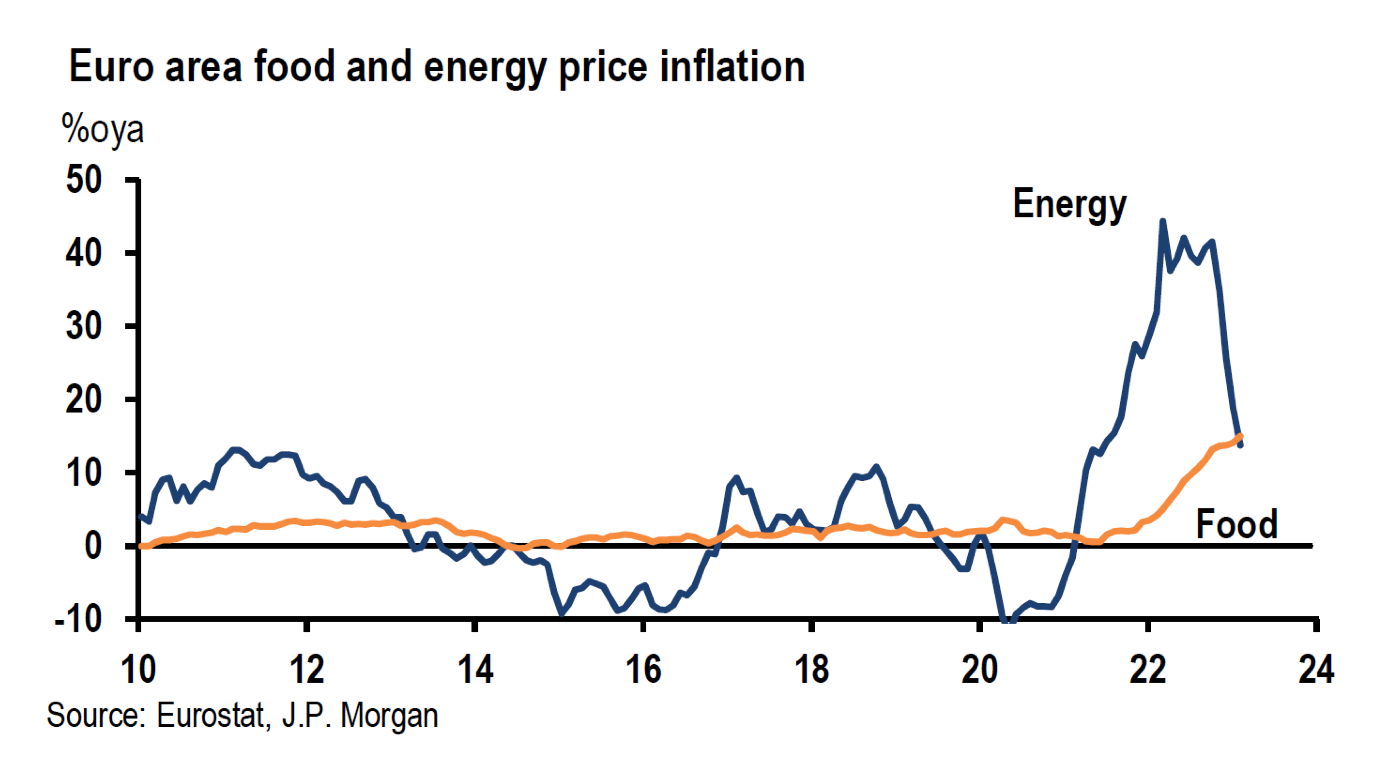
Higher-than-Expected February Euro Area Inflation
Europe’s Harmonized Index of Consumer Prices (HICP) headline rose 8.5% year-over-year (y/y), down from January’s growth level of 8.6%, but higher than the expected rate of 8.3%. Euro area core HICP inflation was 5.6% y/y for February versus January’s 5.3% level, which was also February’s expected level. Increases in headline inflation were driven largely by food and services costs. Core inflation increased 0.5% m/m compared to January’s sequential increase of 0.42% m/m. Core goods inflation declined 13 bps to 0.49% m/m and core services increased 11 bps to 0.43% m/m. According to Reuters on March 2, after these reports, financial markets were pricing in ECB’s key policy rate – its deposit rate – at about 4.1% at the turn of the year. This was a 50 bps increase in expectations versus estimates of one month ago. The deposit rate is currently 2.5%. By comparison, the fed’s key policy rate – the federal funds rate – is currently in the 4.5% to 4.75% range. According to CME data on March 2, there was a 53% probability that the federal funds rate would peak above 5.5% versus a 41.5% probability on February 28.
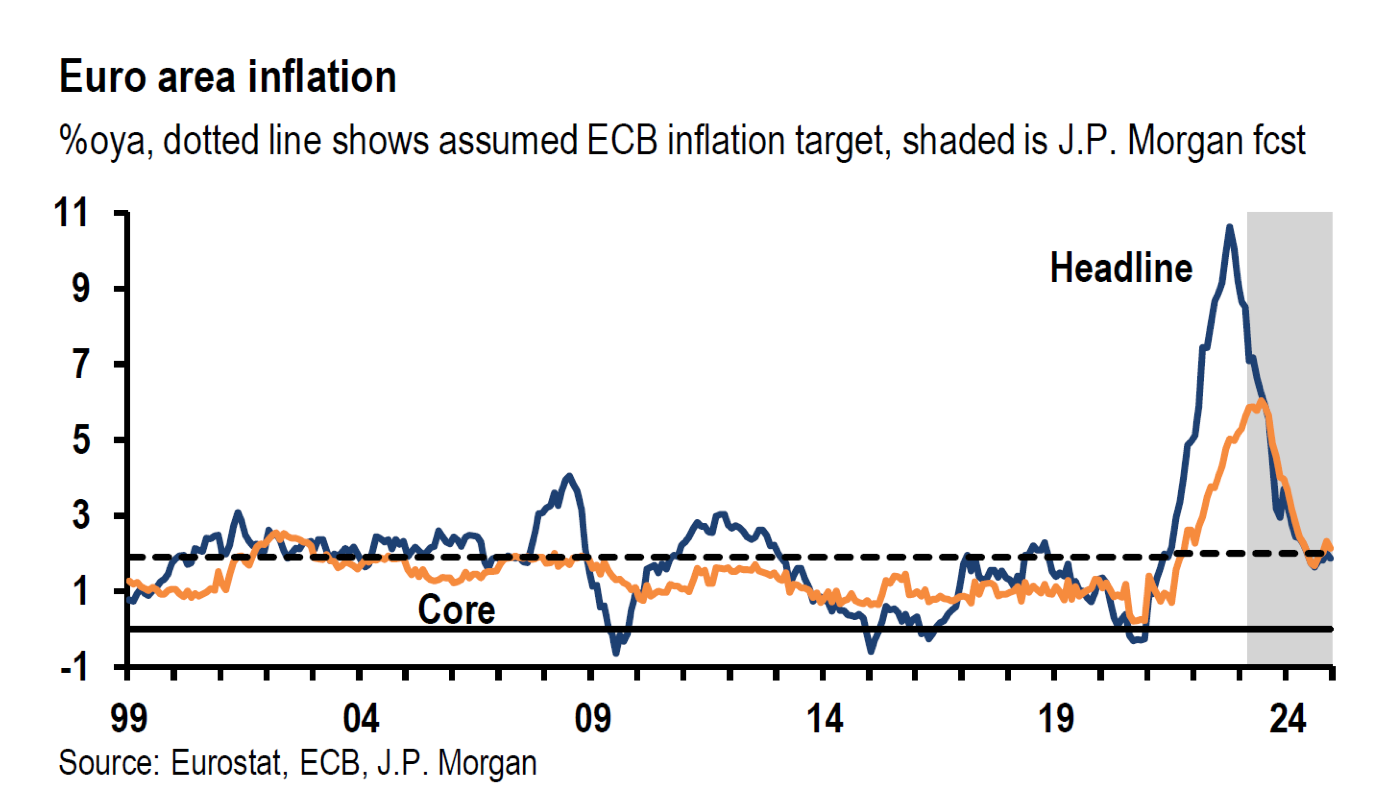
Source: J.P. Morgan Euro area: Inflation strength prompts another ECB change (3/2/2023)
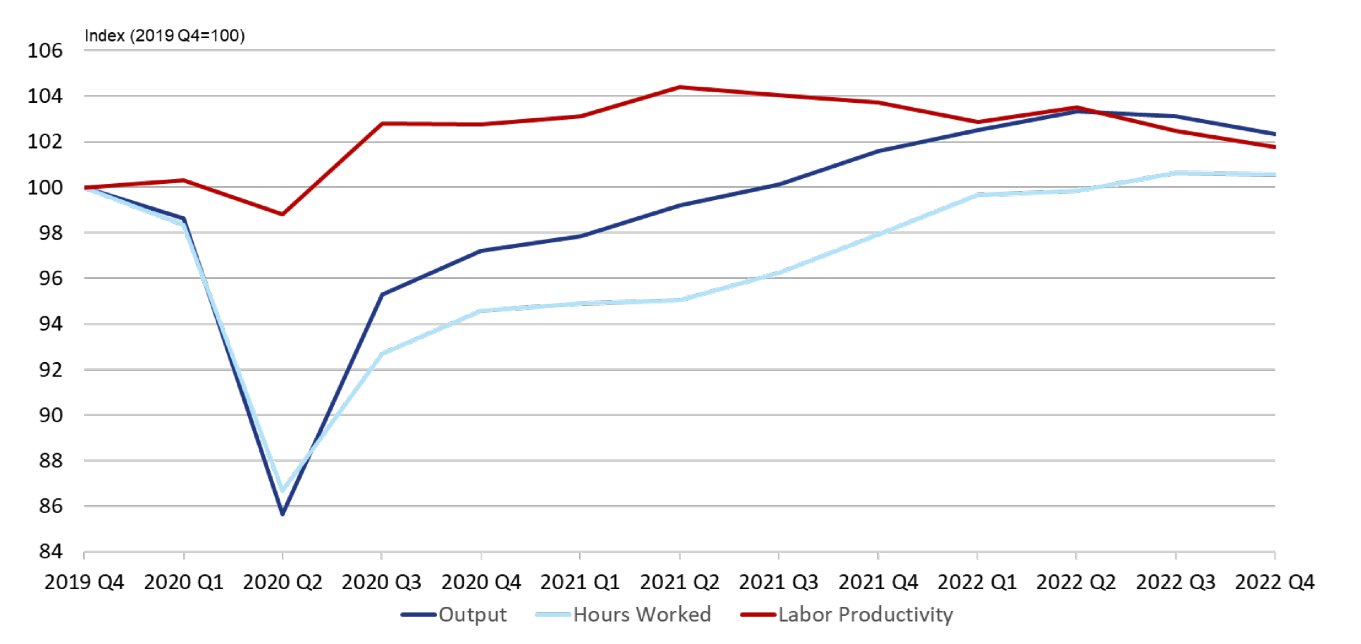
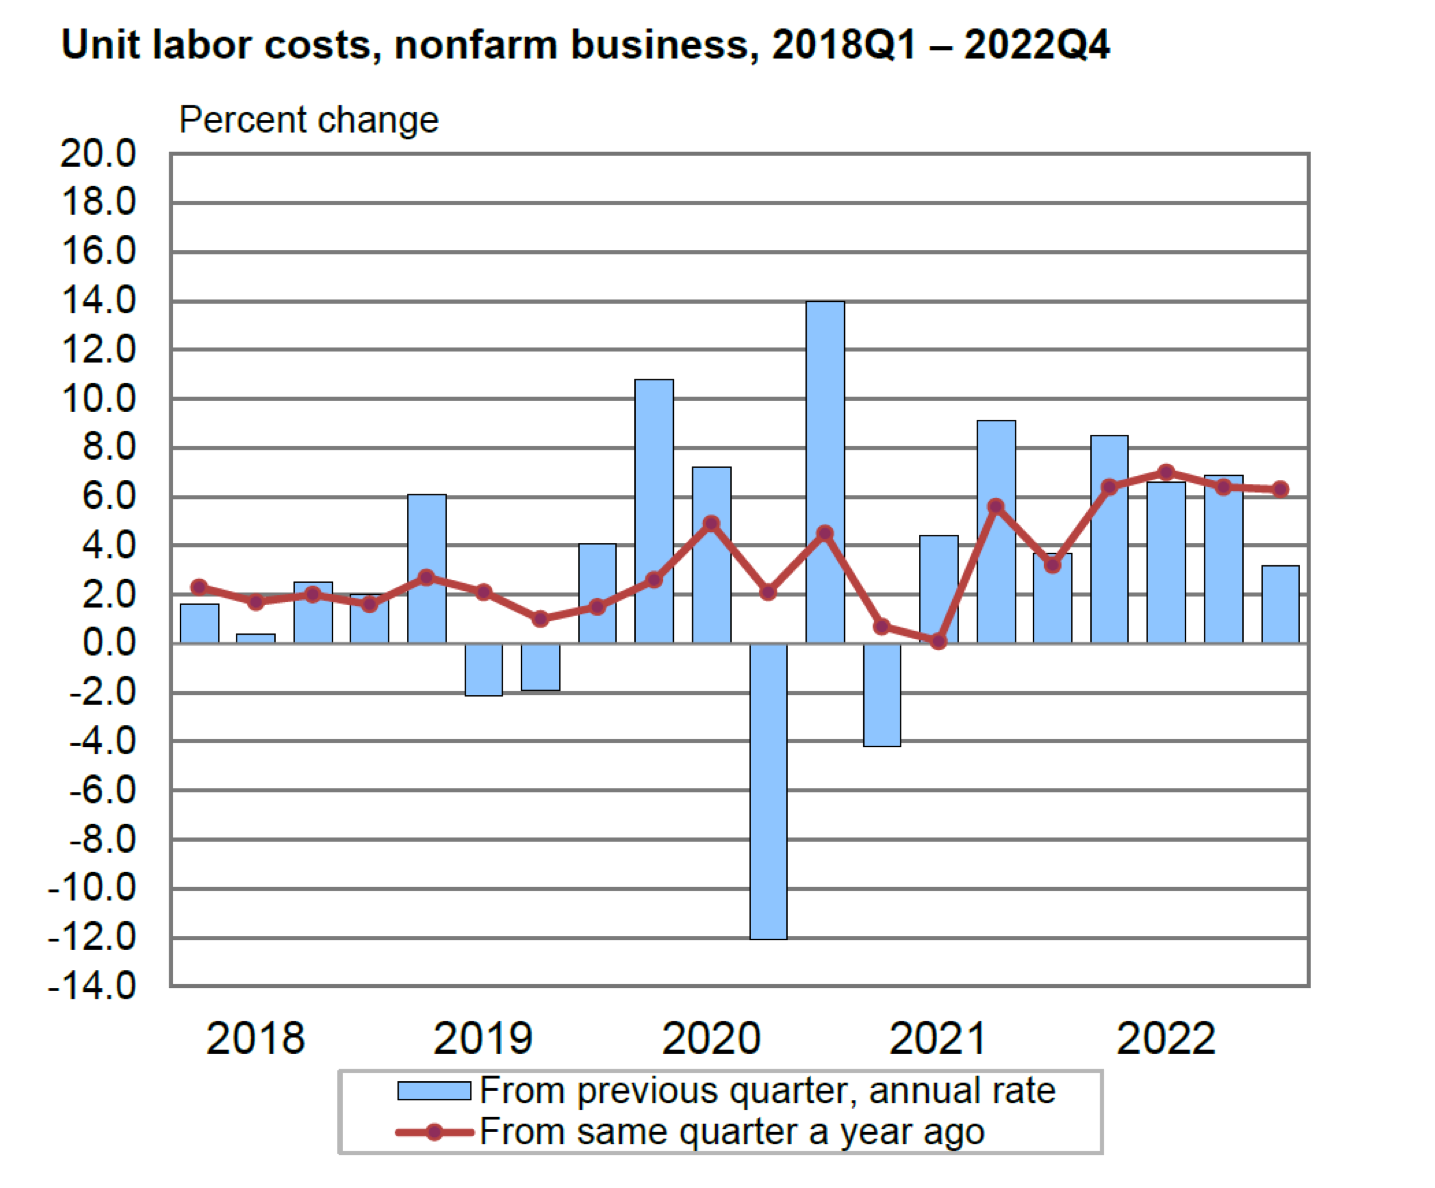
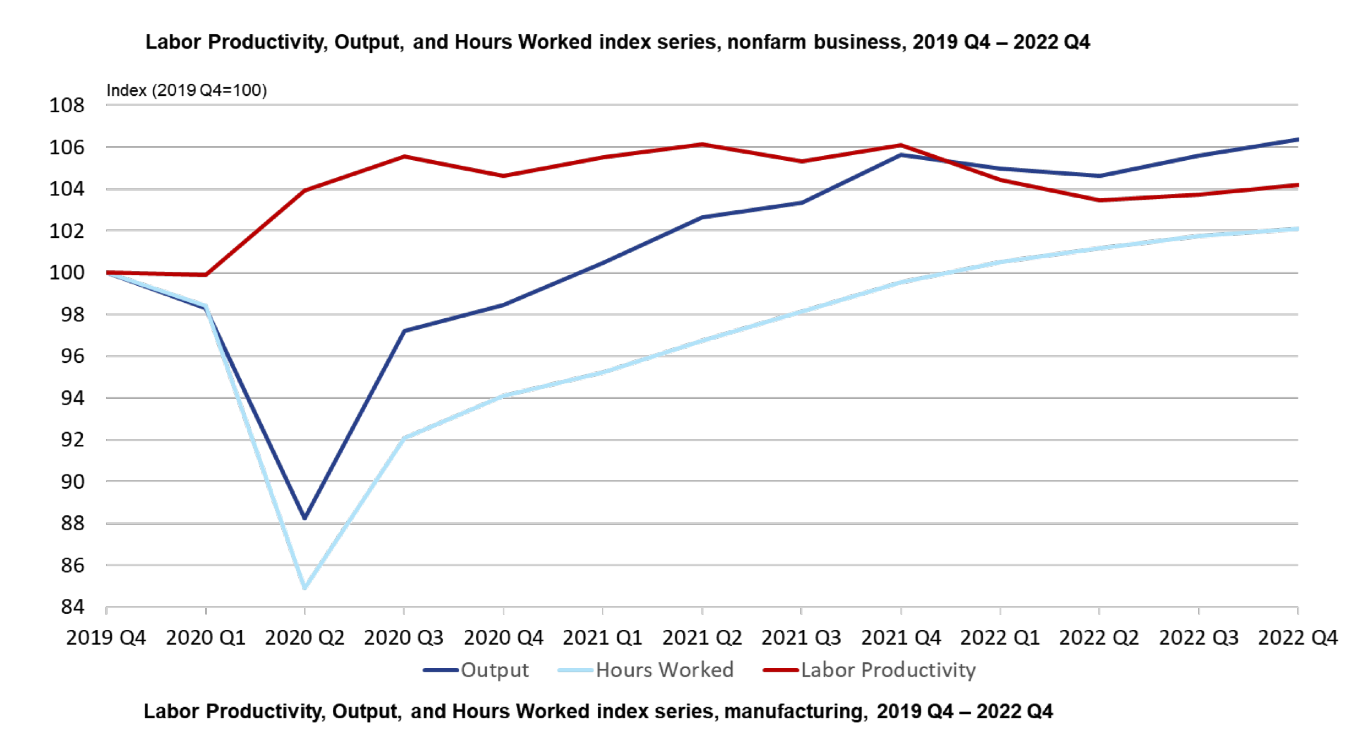
U.S. Q4 Labor Productivity Revised Lower, Unit Labor Costs Revised Higher
A less-productive labor force is more expensive, and is thus more inflationary. Nonfarm business sector labor productivity was revised lower to an increase of 1.7% from the preliminary estimate of 3.0% quarter-over-quarter (q/q) and versus an expected increase of 2.5%. Output increased 3.1% and hours worked increased 1.4%. All quarterly percent changes were seasonally adjusted annual rates. From the same quarter a year ago, nonfarm business sector labor productivity decreased 1.8%, reflecting a 0.7% increase in output and a 2.6% increase in hours worked. Average productivity for all of 2022 decreased 1.7% when compared to 2021. This is the largest annual decline in U.S. productivity since 1974, when it also declined 1.7%. The flipside to a decrease in productivity meant an increase in unit labor costs. Unit labor costs – compensation divided by output – were revised 2.1% higher to 3.2% q/q versus expectations of a 1.6% increase, and increased 1.8% to 6.3% y/y. Even after these revisions higher, the increase in Q4 unit labor costs was the smallest increase since Q1 2021, reflecting a 4.9% increase in hourly compensation and a 1.7% increase in productivity. As a consequence of these revisions, Goldman Sachs (Goldman) revised their “wage tracker” up on March 2 from 5.2% to 5.4% y/y in Q4. For Q3, the wage tracker was revised upward from 5.6% to 5.8%. In our previous commentary, we have highlighted that many analysts find that a wage growth rate of 3.5% is compatible with a 2% rate of inflation. In the Fed’s words, “more work needs to be done.” We still expect wage growth rates to continue their downward trajectory but perhaps at a somewhat slower rate of deceleration.
U.S. January Pending Home Sales Increase Show Sensitivity of Housing Market to Mortgage Rates
Pending sales of single-family homes increased for the second consecutive month in January according to the National Association of Realtors (NAR). This is considered a forward-looking indicator that is based on contract signings to buy a home. Pending home sales increased 8.1% m/m versus an expected increase of 1.0% and was the biggest monthly increase since June 2020. Pending home sales were nevertheless 24.1% lower y/y in January. NAR’s chief economist Lawrence Yun thought that “buyers responded to better affordability from falling mortgage rates in December and January.” Yun added that “home sales activity looks to be bottoming out in the first quarter of this year, before incremental improvements will occur… but an annual gain in home sales will not occur until 2024.” We believe that Yun’s muted optimism for the U.S. housing market could turn more pessimistic with the subsequent rise in 30-year fixed-rate mortgage rates. These rates are thought to track loosely the 10-year Treasury yield. According to Mortgage News Daily on March 2, the average rate of the 30-year fixed rate mortgage rose to 7.1% on that day and these rates have increased about 100 bps since the beginning of February. According to CNBC on March 2, the purchase of a $400,000 home in today’s market could mean a 50% increase in monthly payments when compared to a year ago when mortgage rates were closer to 4%. It was therefore not surprising when mortgage applications to purchase a home fell to a 28-year low last week according to the Mortgage Bankers Association. Such applications have been falling for the past three weeks.
Lower December U.S. Home Prices
The S&P CoreLogic Case-Shiller National Home Price Index fell 0.8% m/m in December, was 5.8% higher y/y, and down from a 7.6% y/y gain in November. The cooling of home prices began in June 2022. For the full-year 2022, single family home prices rose 5.8%, down from an 18.9% average gain in 2021. According to Goldman, multi-family units accounted for approximately 40% of U.S. housing starts over the past six months as homebuilders tried to catch up with strong rental demand. This should help alleviate shelter inflation at some later point. The Federal Housing Finance Agency (FHFA) home price index fell 0.1% m/m in December and was 6.6% higher y/y. The Case-Shiller index is “value weighted” – price changes in more expensive homes are given a greater weight – whereas the FHFA index is equal weighted. The geographic coverage of these two indexes may differ as well.
The Conference Board’s U.S. Consumer Confidence Index Declined in February
The January headline index, which was revised down from 107.1 to 106.0 for January, declined again in February to 102.9. A Reuters poll expected a reading of 108.5. The present situation component of this index increased from 151.1 to 152.8. However, the expectations component fell further, from a downwardly revised 76.0 reading in January to 69.7. Expectations were at the lowest level since July of last year. Any level below 80 is considered often to signal a recession within the next year. The expectations index has been below 80 for eleven of the last twelve months. Inflation expectations looking out twelve months dropped from 6.7% to 6.3%. Fewer consumers were planning to purchase homes or autos and they also appeared to be scaling back plans to buy major appliances. The “labor market differential” – the difference between consumers finding jobs “plentiful” and jobs “hard to get” – increased from 37.0 in January to 41.5, which suggested a tight U.S. labor market. This consumer confidence index is considered to be influenced more by employment and labor market conditions when compared to University of Michigan’s consumer sentiment index, which places greater emphasis on household finances and the impact of inflation.
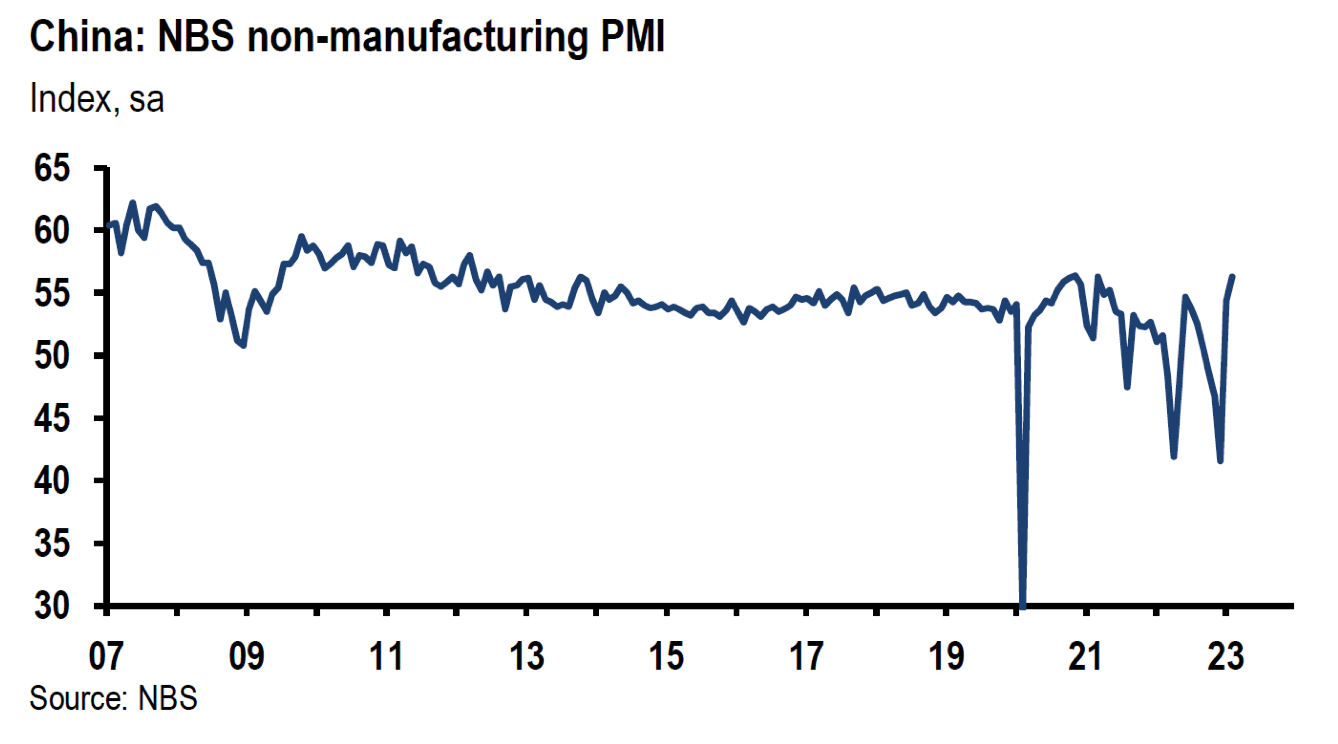
Better than Expected China February PMIs – Better for Global Economic Growth
The “official” China manufacturing PMI, published by the National Bureau of Statistics (NBS), came in at 52.6 in February versus 50.1 in January and versus an expected level of 50.5. February’s headline was the highest since April 2012. China’s nonmanufacturing PMI (includes services and construction) was also higher than expected at 56.3, up from 54.4 in January. China’s “reopening” appeared to be off to a strong, broad-based start. The private Caixin/S&P Global manufacturing PMI was also strong with a 51.6 reading, up from 49.2 in January. This was Caixin’s first expansionary reading since July and the highest since June. The Caixin new orders subindex grew at the fastest rate since mat-y 2021. Caixin surveys focus on smaller firms typically from coastal regions and includes a number of exporters. Many subindexes of the NBS manufacturing PMI were especially strong. The new orders subindex increased to 54.1 from 50.9 in January and the new export orders index rose to 52.6 from 46.1, which was also its first expansionary reading in 23 months and the highest since March 2011. The employment subindex increased to 50.2 from 47.7. Delivery times were faster as well. The NBS output manufacturing index rose to 56.7 from 49.8. Manufacturers were able to charge higher prices for their exports due to higher input costs and improved demand. Overall optimism was the highest since March 2021. Input and output prices increased.
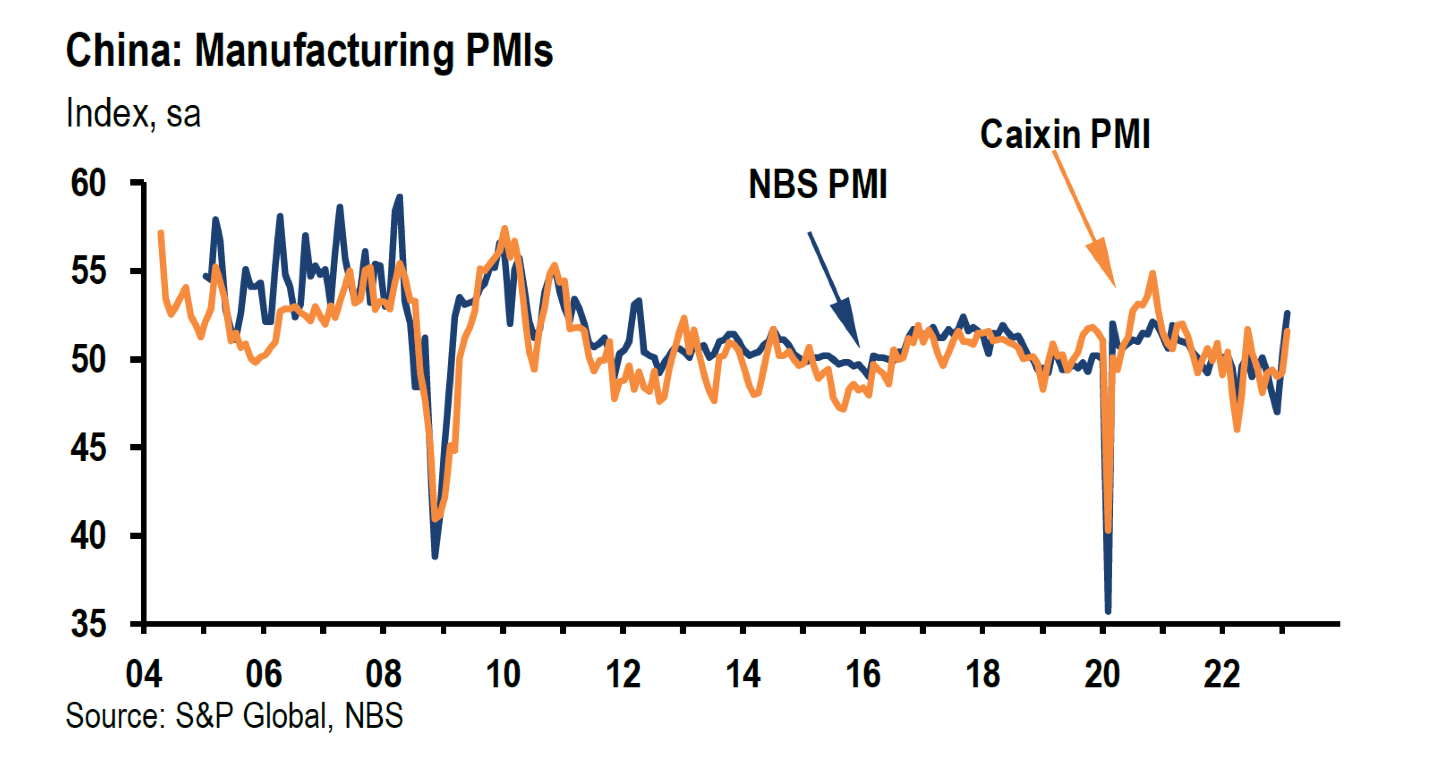
Source: J.P. Morgan China: February PMIs beat expectations, indicating broad-based uptick in economic activity (3/1/2023)
Bottom Line
For the time being we are maintaining our basic investment approach as expressed in last week’s commentary. We continue to prefer high quality stocks that offer good balance sheets, as well as relatively stable cash flows and profit margins. We prefer a very diversified global portfolio for long term investors. We expect volatility to continue across asset classes.
We continue to stress that stock selectivity in this current financial environment is of paramount importance. We will reassess our investment posture after we have analyzed the next set of monthly economic data. We maintain our strategy of buying equities only on downturns. We will continue to scrutinize investments on a risk-reward basis.
Definitions
Basis Points (bps) – A basis point is one hundredth of one percent, used chiefly in expressing differences of interest rates.
Headline Inflation – Headline Inflation is the raw inflation figure reported through the Consumer Price Index (CPI) that is released monthly by the Bureau of Labor Statistics (BLS). The CPI calculates the cost to purchase a fixed basket of goods to determine how much inflation is occurring in the broad economy.
Core Inflation – Core inflation is the change in the costs of goods and services, but it does not include those from the food and energy sectors. This measure of inflation excludes these items because their prices are much more volatile.
ECB’s Key Policy Rate – Deposit Rate – The deposit facility rate is one of the three interest rates the ECB sets every six weeks as part of its monetary policy. The rate defines the interest banks receive for depositing money with the central bank overnight.
Federal Funds Rate – The term federal funds rate refers to the target interest rate set by the Federal Open Market Committee. This target is the rate at which commercial banks borrow and lend their excess reserves to each other overnight.
Fed Funds Terminal Rate – The terminal rate is defined as the peak spot where the benchmark interest rate, the federal funds rate, will come to rest before the central bank begins trimming it back.
Manufacturing Purchasing Managers’ Index PMI – A manufacturing Purchasing Managers’ Index (PMI) is a survey-based economic indicator designed to provide a timely insight into changing business conditions in the goods-producing sector.
Producer Price Index (PPI) – The producer price index (PPI), published by the Bureau of Labor Statistics (BLS), is a group of indexes that calculates and represents the average movement in selling prices from domestic production over time. It is a measure of inflation based on input costs to producers.
Core Producer Price Index (PPI) – The core producer price index (PPI), published by the Bureau of Labor Statistics (BLS), is a group of indexes that calculates and represents the average movement in selling prices from domestic production over time that excludes food and energy prices, which are the more volatile parts of inflation.
Eurozone – The eurozone, officially known as the euro area, is a geographic and economic region that consists of all the European Union countries that have fully incorporated the euro as their national currency.
Nonfarm Productivity – Nonfarm Productivity measures the annualized change in labor efficiency when producing goods and services, excluding the farming industry. Productivity and labor-related inflation are directly linked-a drop in a worker’s productivity is equivalent to a rise in their wage.
Productivity – Productivity measures output per unit of input, such as labor, capital, or any other resource. It is often calculated for the economy as a ratio of gross domestic product (GDP) to hours worked.
Labor Market Differential – the percentage of respondents who say jobs “are plentiful” less those who say jobs “are hard to get”.
Harmonized Index of Consumer Prices (HICP) – In the euro area, the Harmonised Index of Consumer Prices (HICP) is used to measure consumer price inflation. That means the change over time in the prices of consumer goods and services purchased by euro area households. It is “harmonised” because all the countries in the European Union follow the same methodology. This ensures that the data for one country can be compared with the data for another. The HICP is compiled by Eurostat and the national statistical institutes in accordance with harmonised statistical methods. The inflation rate is also used in assessing whether a country is ready to join the euro area.
S&P 500 – The S&P 500 is a total return index that reflects both changes in the prices of stocks in the S&P 500 Index as well as the reinvestment of the dividend income from its underlying stocks.
Case-Shiller Home Price Index – The S&P CoreLogic Case-Shiller U.S. National Home Price Index (“the U.S. national index”) measures the value of single-family housing within the United States. The index is a composite of single-family home price indices for the nine U.S. Census divisions and is calculated monthly.
ISM manufacturing prices paid – A diffusion index of ISM Manufacturing PMI calculated by adding the percent of responses indicating they paid more for inputs plus one-half of those responding that they paid the same for inputs.
IMPORTANT DISCLOSURES
The views and opinions included in these materials belong to their author and do not necessarily reflect the views and opinions of NewEdge Capital Group, LLC.
This information is general in nature and has been prepared solely for informational and educational purposes and does not constitute an offer or a recommendation to buy or sell any particular security or to adopt any specific investment strategy.
NewEdge and its affiliates do not render advice on legal, tax and/or tax accounting matters. You should consult your personal tax and/or legal advisor to learn about any potential tax or other implications that may result from acting on a particular recommendation.
The trademarks and service marks contained herein are the property of their respective owners. Unless otherwise specifically indicated, all information with respect to any third party not affiliated with NewEdge has been provided by, and is the sole responsibility of, such third party and has not been independently verified by NewEdge, its affiliates or any other independent third party. No representation is given with respect to its accuracy or completeness, and such information and opinions may change without notice.
Investing involves risk, including possible loss of principal. Past performance is no guarantee of future results.
Any forward-looking statements or forecasts are based on assumptions and actual results are expected to vary from any such statements or forecasts. No assurance can be given that investment objectives or target returns will be achieved. Future returns may be higher or lower than the estimates presented herein.
An investment cannot be made directly in an index. Indices are unmanaged and have no fees or expenses. You can obtain information about many indices online at a variety of sources including: https://www.sec.gov/fast-answers/answersindiceshtm.html or http://www.nasdaq.com/reference/index-descriptions.aspx.
All data is subject to change without notice.
© 2024 NewEdge Capital Group, LLC


