

Weekly Summary: August 15 – August 19, 2022
Key Observations:
- FOMC minutes confirm a “soft” Fed pivot. This is not a classic Fed pivot that would require a “telegraphed” cut in the federal funds rate in the foreseeable future. We assume a slowing of the pace of Fed rate hikes and then a “pause” once a “restrictive” federal funds rate range is achieved. We do not foresee the Fed cutting rates for “quite some time.” A slowing U.S. economy is a critical component of this characterization.
- We accept that the Fed is committed to achieving its targeted 2% rate of inflation. We assume that the Fed will show “patience” once it gets to at least a “restrictive” range in the federal funds rate.
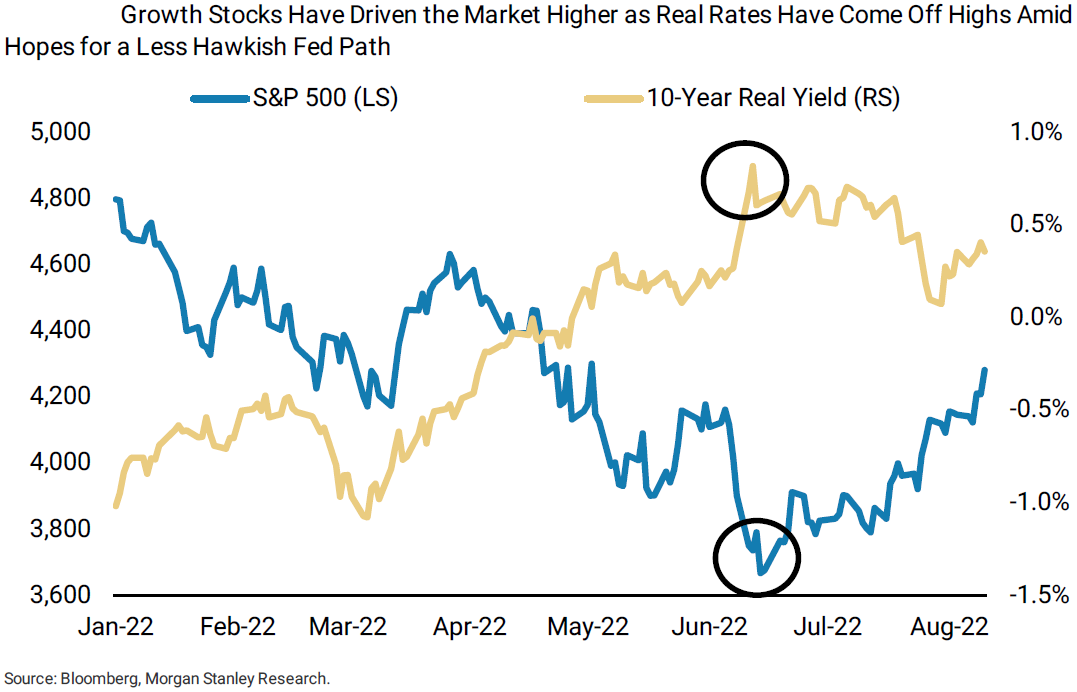
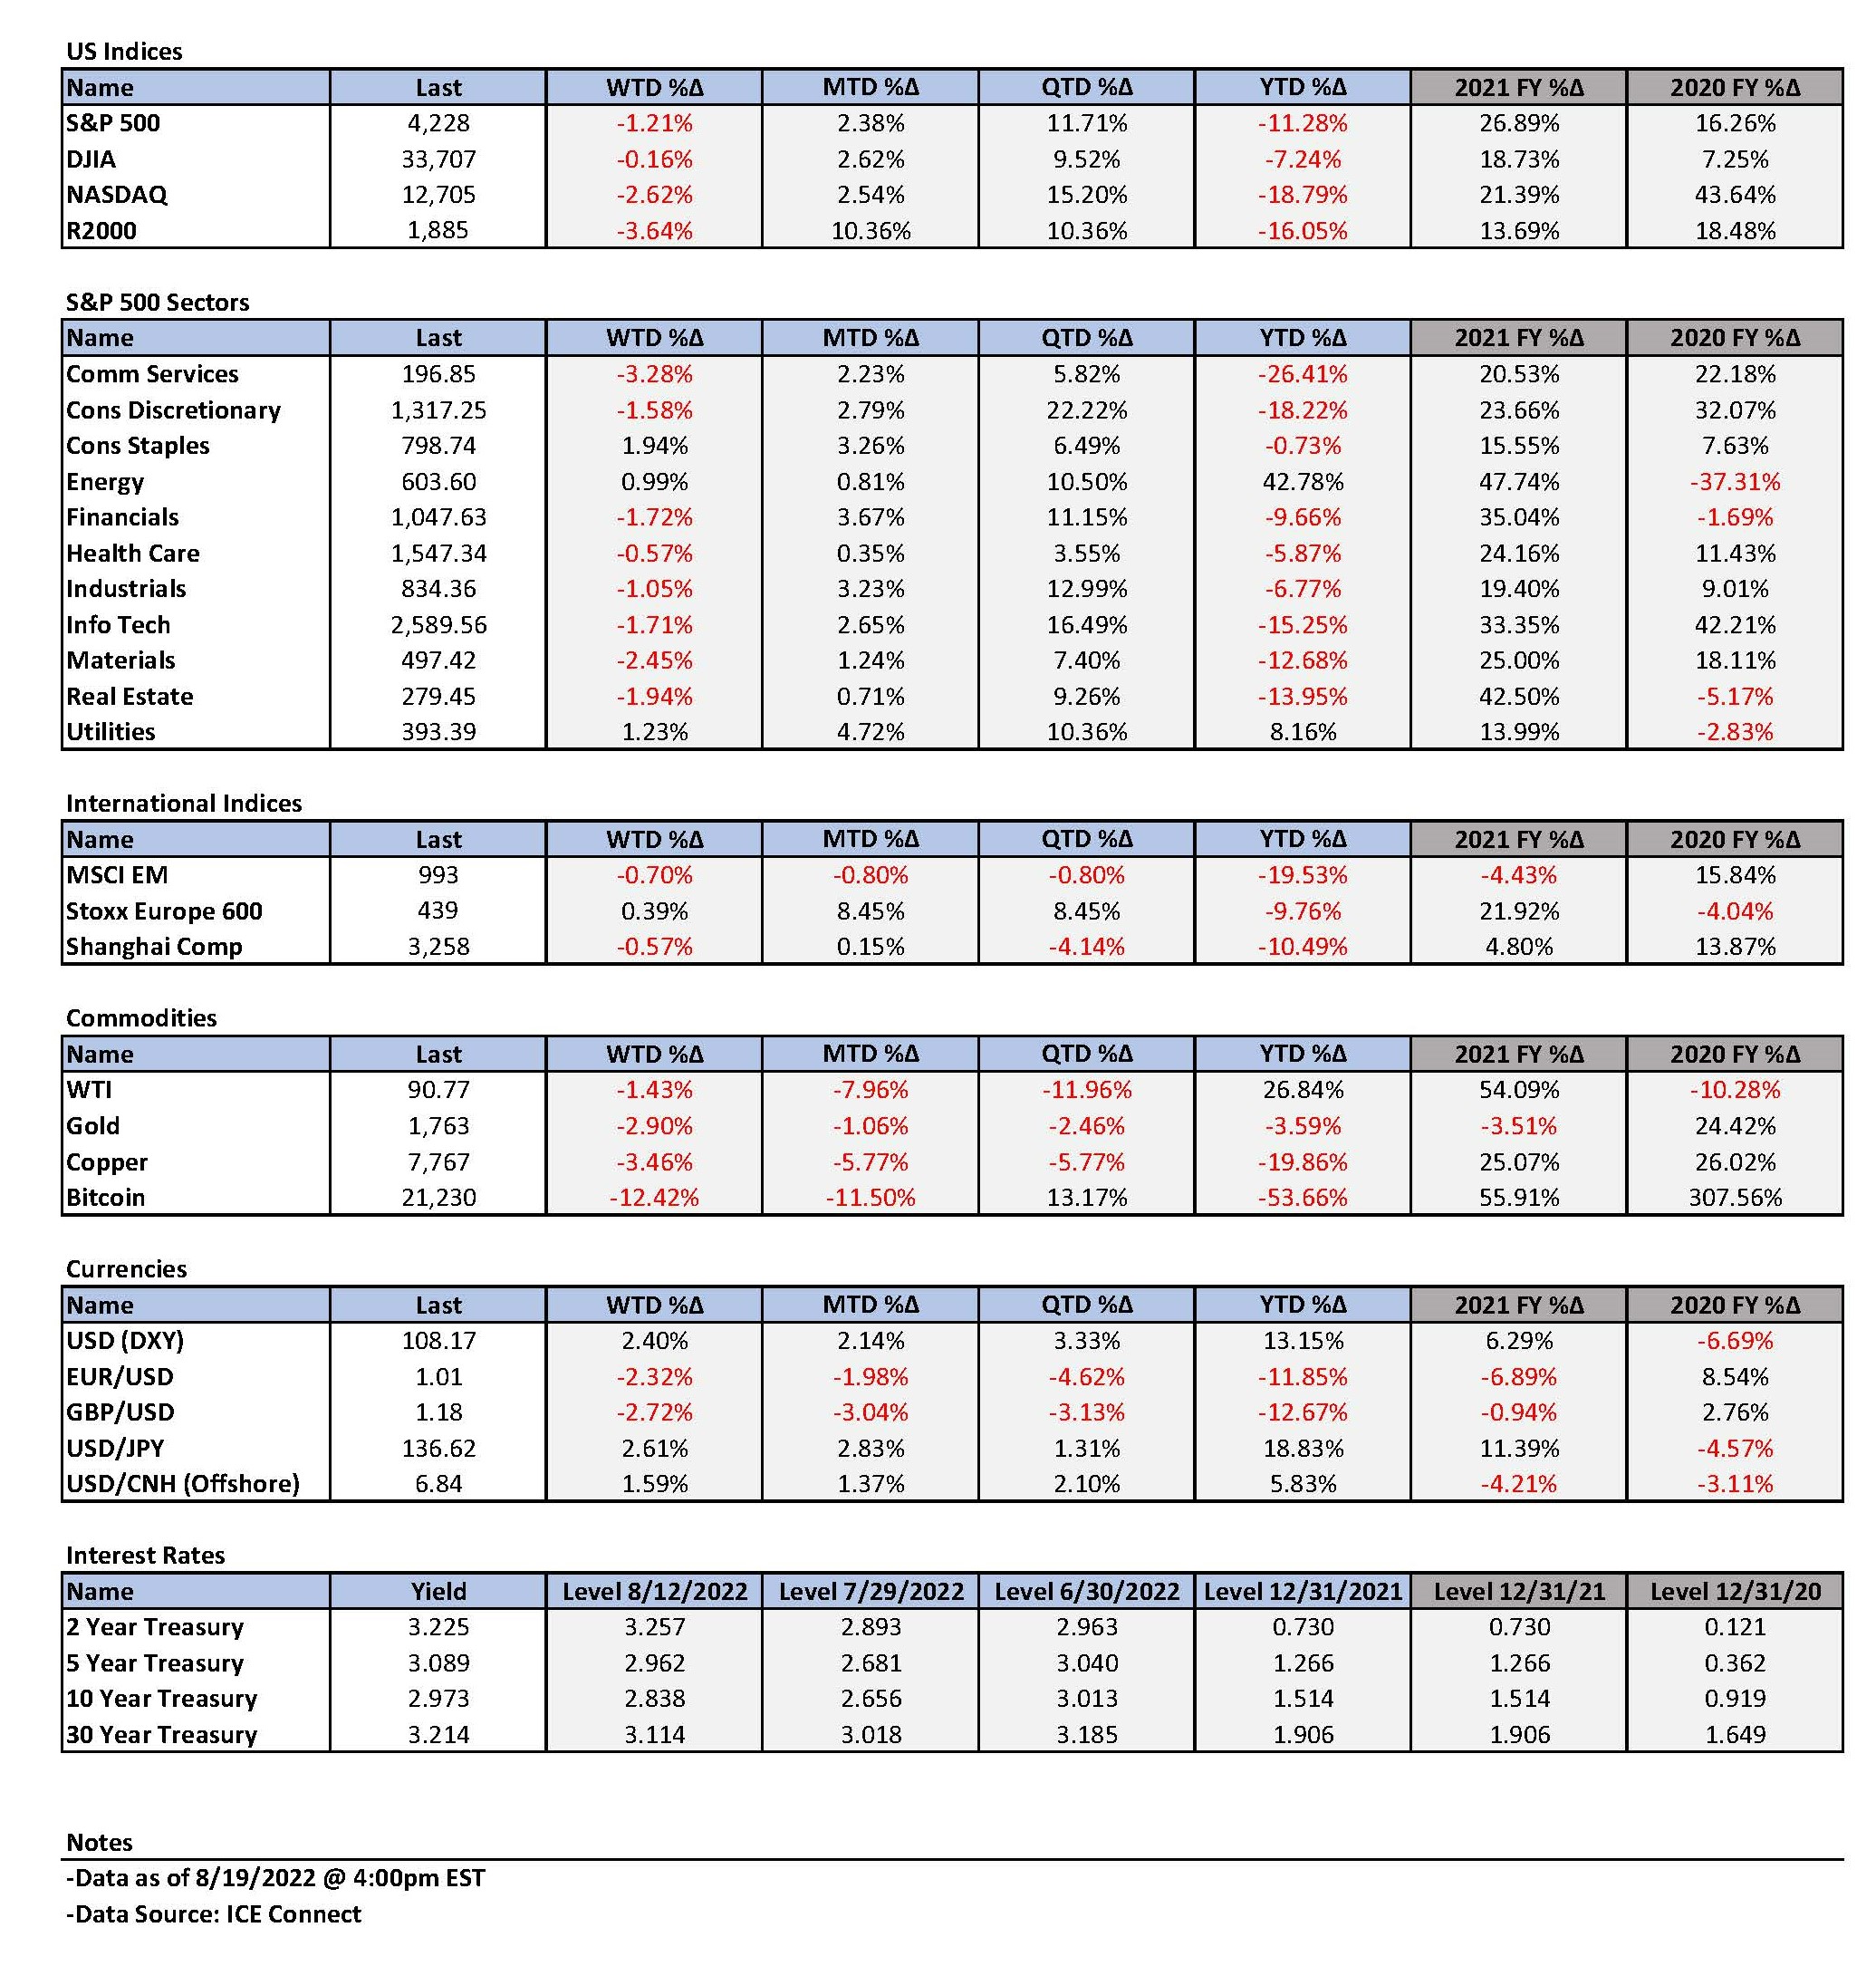
- The 10-year Treasury yield steepened relative to the 2-year Treasury yield (less inversion) toward the latter part of this week as yields traded higher in general. We anticipated this development as highlighted in last week’s letter.
- We postulate that a rise in the 10-year yield has a greater negative affect on stock prices than the 2-year yield. Although we anticipate the Fed to continue raising rates, we view the trend to a somewhat lesser “inverted” yield curve as an indication that the Fed’s “terminal” federal funds rate may be less harmful to the U.S. economy than previously thought. It remains our contention that a slowing U.S. economy will do a significant part of the Fed’s “work” so that the terminal rate will be contained under 4%.
The Upshot: Our general investment approach remains the same as depicted in last week’s commentary. Our forecast last week that Treasury yields would rise and that the 10-year yield would rise relative to the 2-year yield has occurred and was most evident in Friday’s trading. Not surprisingly, growth and tech stocks suffered especially. Our preference for energy stocks in combination with selected high-quality growth and tech stocks seemed to be working quite well this week as energy stocks appeared to function as a hedge against growth stocks. We have never deviated this year from only recommending high quality big cap stocks on a selective basis, and to only buy such stocks when they trade lower. Once bought by a long-term investor, the stock should be of such a high quality that such an investor could hold the stock through market turmoil.
We continue to foresee financial market volatility and we maintain our conviction that equities should only be purchased on market downturns. Absent a severe U.S. recession, we view the significance of a “soft” Fed pivot as we have outlined, as enabling a long-term investor to be more “comfortable” buying selected stocks given the lessened probability of U.S. equities approaching the low levels of this year. Again, we view risk/reward diminishing as any stock trades higher, but if we are correct in our notion of a Fed “soft” pivot, as enhancing the risk/reward when someone choses to buy any equities at an “opportune” time. A soft pivot should enable an investor to focus more on individual stock picking. We are convinced that stock selectivity will continue to be of particular importance in the current rather “uncertain” environment.
Source: Morgan Stanley, Weekly Warm-up: The Challenge with Front-Running a Fed Put (8-15-2022)
“Soft” Pivot Confirmed by FOMC Minutes
We interpret the minutes of the Federal Open Market Committee’s (FOMC or Committee) last meeting of July 26-27 as confirming our characterization of the Federal Reserve’s latest monetary stance as a “soft” pivot – like we outlined first in our July 29 weekly. We don’t see any material difference between these minutes released mid-week and Fed chair Powell’s statements during the July 27 press conference when he explained the Fed’s latest deliberations. Participants at the meeting judged that moving to a restrictive policy stance was required to meet the Committee’s legislative mandate to “promote maximum employment and price stability.” Powell characterized the current federal funds rate in the 2.25% to 2.50% range as “neutral”. But with “inflation elevated and expected to remain so over the near term, some participants emphasized that the real federal funds rate would likely still be below shorter-run neutral levels after this meeting’s policy rate hike,” which was 75 basis points (bps). We understand that the Fed would characterize a range of 3.25% to 3.50% as “restrictive.” It is our view that the Fed will achieve this level after a 50-bps hike in September and 25-bps hikes at its November and December meetings. “Participants judged that, as the stance of monetary policy tightened further, it likely would become appropriate at some point to slow the pace of policy rate increases while assessing the effects of cumulative policy adjustments on economic activity and inflation.” We suppose that the “appropriate” time to slow the pace of rate hikes will become evident at the Fed’s next upcoming meetings given our view of a slowing in U.S. economic growth and headline inflation rates. “Some participants indicated that, once the policy rate had reached a sufficiently restrictive level, it likely would be appropriate to maintain that level for some time to ensure that inflation was firmly on a path back to 2%.” We imagine that a “sufficiently restrictive level” in the federal funds rate might be reached at as low as the 3.25% to 3.50% range we envision by year’s end. We admit that it might be necessary to continue hiking beyond this range. If this transpires, we do not anticipate a materially higher “terminal” federal funds rate. Given our forecast of a slowing U.S. economy and slowing headline inflation, we thought that an indication of a federal funds rate increased slowing and an indication of the Fed’s willingness to pause its rate hikes by the end of this year or early next year, was sufficient to characterize this as a “soft” pivot. A classic Fed pivot would need to see a cut in the federal funds rate, which we do not anticipate for “quite some time.”
Lagging Effects of Monetary Policies
The minutes highlighted that “participants generally judged that the bulk of the effects [of the Fed’s tightening policies and communications about future tightening measures] on real [economic] activity had yet to be felt because of lags associated with the transmission of monetary policy.” But a number of participants also observed that some effects from Fed actions “were showing more rapidly than had historically been the case, because the expeditious removal of policy accommodation and supporting communications already had led to a significant tightening of financial conditions.” Once again, ever since the beginning of the pandemic, the “unexpected” seems to have a way of occurring sporadically. This is why the Fed has chosen a “patient” approach in its monetary policies once the federal funds rate has achieved at least a “neutral” rate. The Fed also indicated that it would weigh the “risks” of too much tightening against the “substantial risks” of elevated inflation becoming “entrenched.” In this regard, the Committee thought that it was important that the public not question its “resolve” of sufficiently tightening to rein in elevated rates of inflation. The Fed’s credibility was indeed a concern.
Fed Needs “Patience”
Once the Fed achieves the neutral federal funds rate in the 2.25% to 2.50% range, the Fed could adopt a more “patient” wait-and-see approach that would be data dependent and that was described more colorfully in the Guns N’ Roses song “Patience.” The Fed was now in a position to “take it slow, and it’ll work itself out fine; All we need is just a little patience.” Furthermore, the participants could tell each other “you and I’ve got what it takes to make it … Just trying to get it right … it’s hard to see with so many around.” Another reason why the Fed could be somewhat more patient in tightening the monetary policy further is a weakening U.S. economy. The Fed staff’s economic projections for the July meeting were “noticeably” weaker than the June projections, “reflecting the economy’s reduced momentum and current and prospective financial conditions that were expected to provide less support to aggregate demand growth.” The housing market was singled out in this regard. Participants “observed that housing activity had weakened notably, reflecting the impact of higher mortgage interest rates and house prices on home affordability. Participants anticipated that the slowdown in housing activity would continue and also expected higher borrowing costs to lead to a slowing in other interest-sensitive household expenditures, such as purchases of durable goods.”
Spending by Consumers and Credit Availability
In the Fed’s staff review of the “Financial Situation,” the staff concluded that “while credit availability remained generally available, it appeared to tighten for most businesses and some households.” Participants also commented that “consumer sentiment had deteriorated, and households were reportedly being more cautious in their expenditure decisions in light of uncertainty about the economic outlook and the reduction in purchasing power induced by price rises…” Lower consumer expenditures is what the Fed is hoping. “Participants emphasized that a slowing in aggregate demand would play an important role in reducing inflation pressures.”
Fed Focus on Financial Stability
The minutes showed that concerns about financial stability remained at the forefront of the Fed’s thinking. Several participants noted that in spite of decreased liquidity in some financial markets since January, market functioning had been “orderly.” We have referenced this concern of the Fed in our prior commentaries when we highlighted the Fed’s focus on less-liquid conditions in the Treasury markets, as well as the energy markets. But the minutes also focused on “financial stability challenges posed by digital assets.” Some participants saw “the need to establish a robust supervisory and regulatory framework for this industry that would appropriately limit potential systemic risks.” We have commented often on our concern of any potential market “dislocations” as liquidity is further drained from the financial system when the Fed’s quantitative tightening (QT) is increased in September. We intend to monitor these developments closely. We do not construe the Fed’s concern as any “put” to halt a decline in U.S. equities. Stocks can trade lower without any dislocation needed, much like they did in the first half of this year.
Role of Commodity Prices on Inflation
The recent decrease of energy prices, and gasoline prices in particular, have been instrumental in our forecast that we probably have seen the peak of U.S. headline inflation. Nevertheless, we project that commodity prices will remain volatile, including possible unexpected price spikes higher. Many surveys on which we have commented previously, have shown that gasoline prices have an inordinate impact on the public’s inflation expectations. The Fed explicitly recognized this as well. Participants “remarked that … prices of oil and some other commodities could not be relied on as providing a basis for sustained lower inflation, as these prices could quickly rebound.” We agree, but we also would like to point out that even a fluctuating gasoline price could be helpful in “anchoring” the public’s inflation expectations that are more closely aligned with the Fed’s targeted 2% rate of inflation than a steady increase in commodity prices.
Weaker U.S. Housing Market
In recent weeks, we have highlighted the housing market downturn. The release this week of housing related data substantiated this downturn, while confirming the Fed’s observations on the recent slump in housing. The National Association of Home Builders (NAHB) housing market index, which is based on home-builders assessment of the U.S. housing market, declined for the eighth straight month to its lowest level since May 2020. The sub-indexes for current sales, buyer traffic and sales expectations over the next six months all declined in August on a month-to-month (m/m) basis. The chief economist of the NAHB even described the current situation as a “housing recession” due to the Fed’s tighter monetary policies and elevated construction costs.
U.S. July housing starts were 9.6% lower m/m versus an expected downturn of 2.5%. July starts were the lowest since February 2021. Single family starts declined 10.1% and those for multi-family were 8.6% lower. Building permits were down a less-than-expected 1.3% versus an expected decline of 3.3%. The overall less-than-expected decrease in building permits masked the more important measure for single family building permits that were 4.3% lower in July m/m. The more volatile multi-family data were 2.8% positive. As a further sign of a recent housing market weakness, record mortgage cancellations of 63,000 were recorded in June. According to the Mortgage Bankers Association survey released this week, the mortgages demand for the week that ended August 12 hit its lowest level since 2000. The volume of purchase applications fell 1% from the prior week and was 18% lower y/y. The National Association of Realtors (NAR) disclosed on Thursday that existing U.S. home sales declined by a more-than-expected 5.9% m/m, marking the sixth consecutive month of declines. The report also showed an increase in homes available for sale. At its current sales pace, the inventories in July increased from a 2.5-month supply to a 2.9-month supply. This compares to a 3.9-month average supply of existing homes for sale in 2019. Other than the pandemic-related drop in 2020, the seasonally adjusted sales rate in July was the weakest since November 2015. The chief economist for NAR commented that the weak July sales partly reflected the impact of 30-year fixed mortgage rate 6% peak in early June. “Home sales may soon stabilize since mortgage rates have fallen to near 5%.”
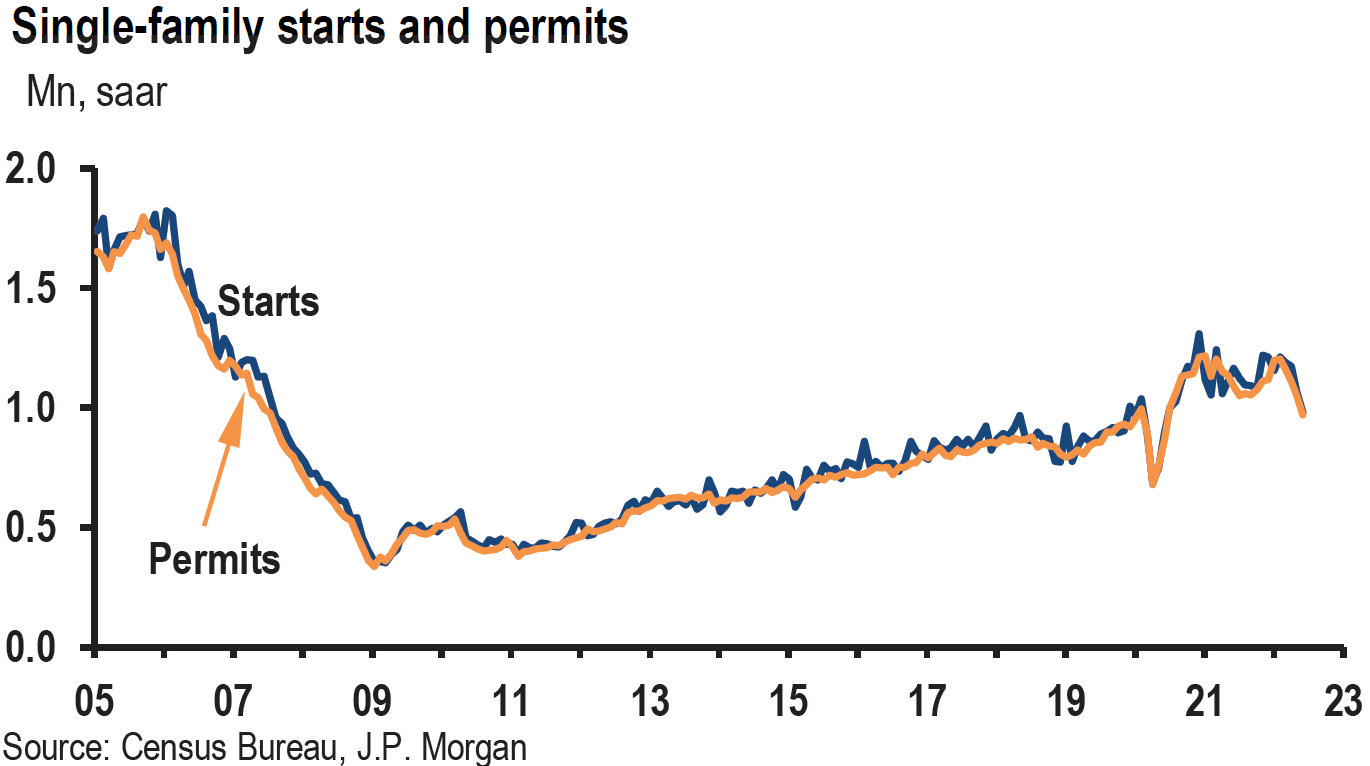
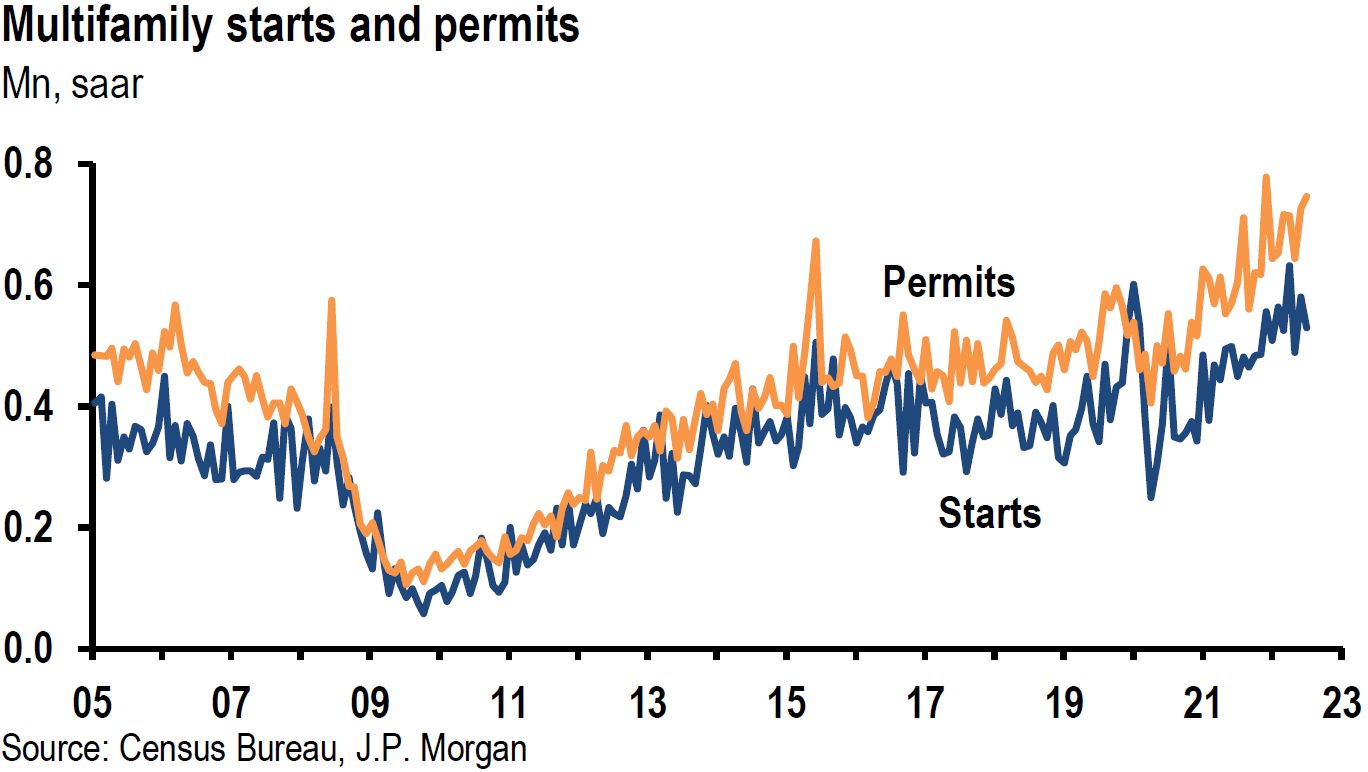
Source: JP Morgan, US: Starts and permits data show another weak housing report (8-16-2022)
U.S. Retail Sales
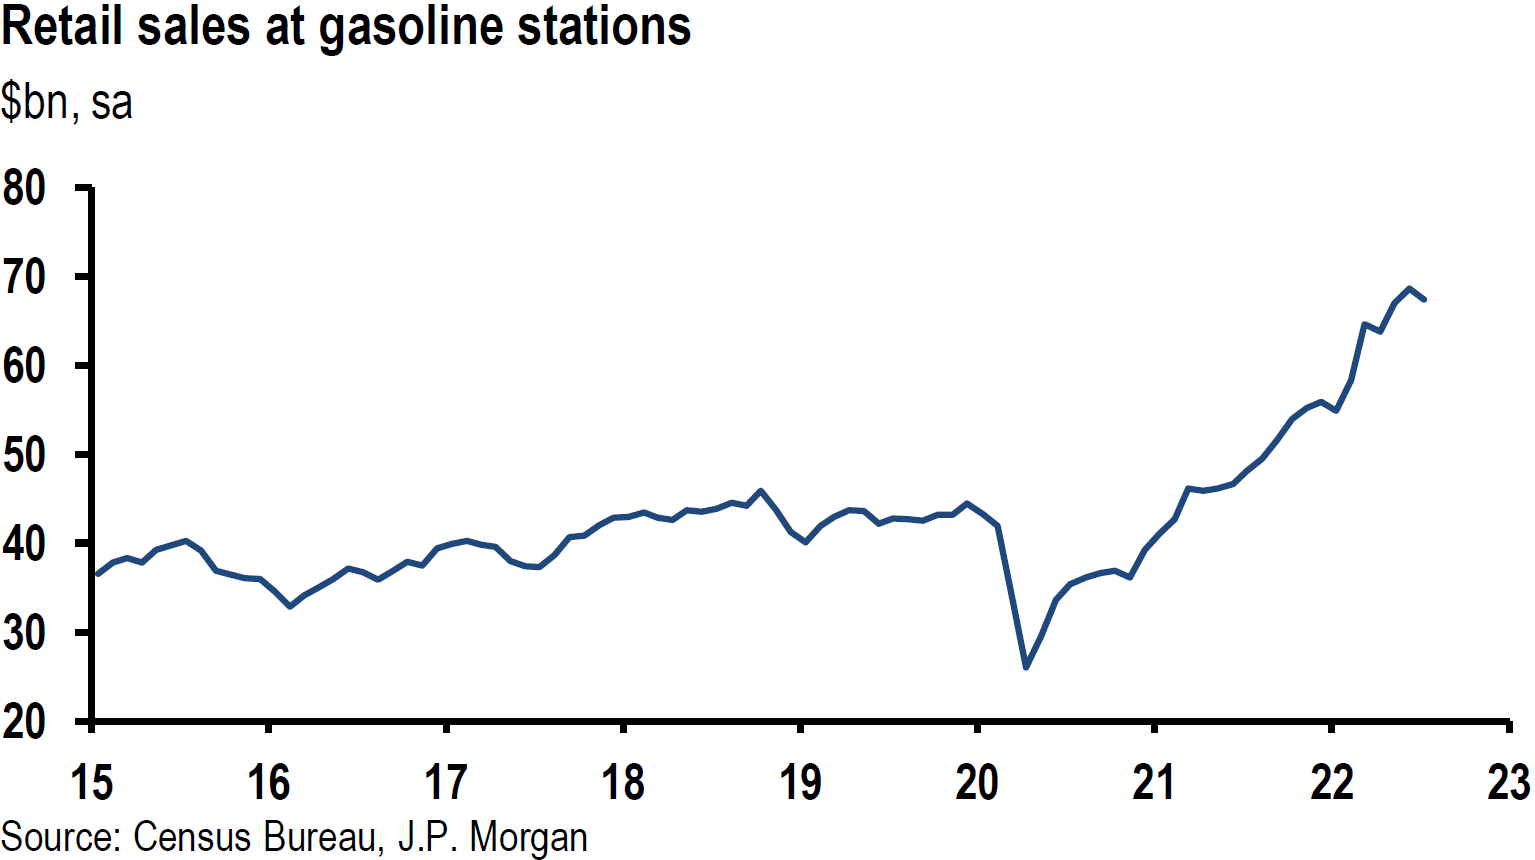
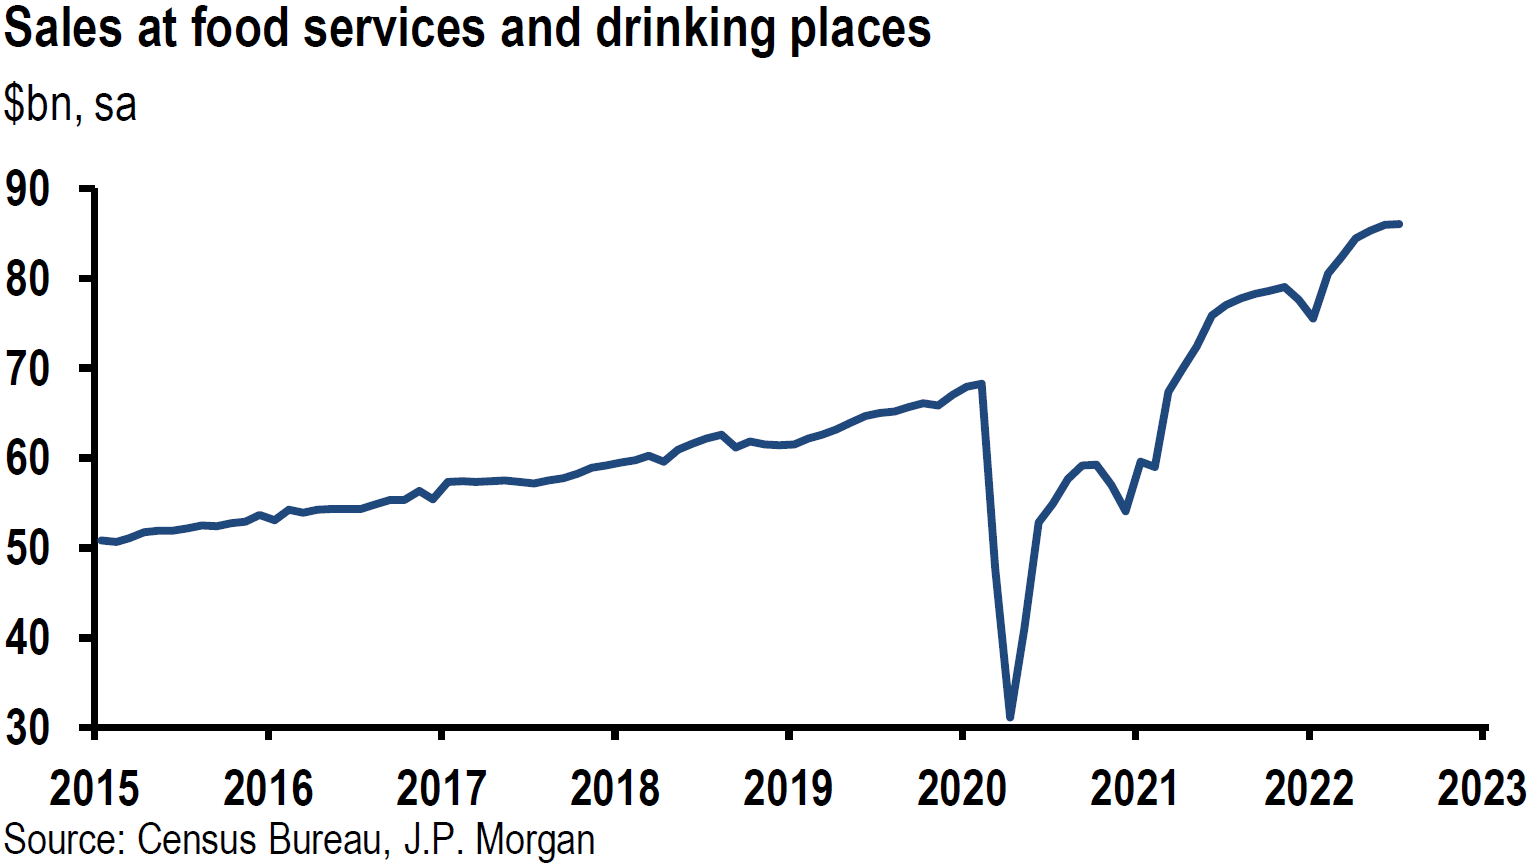
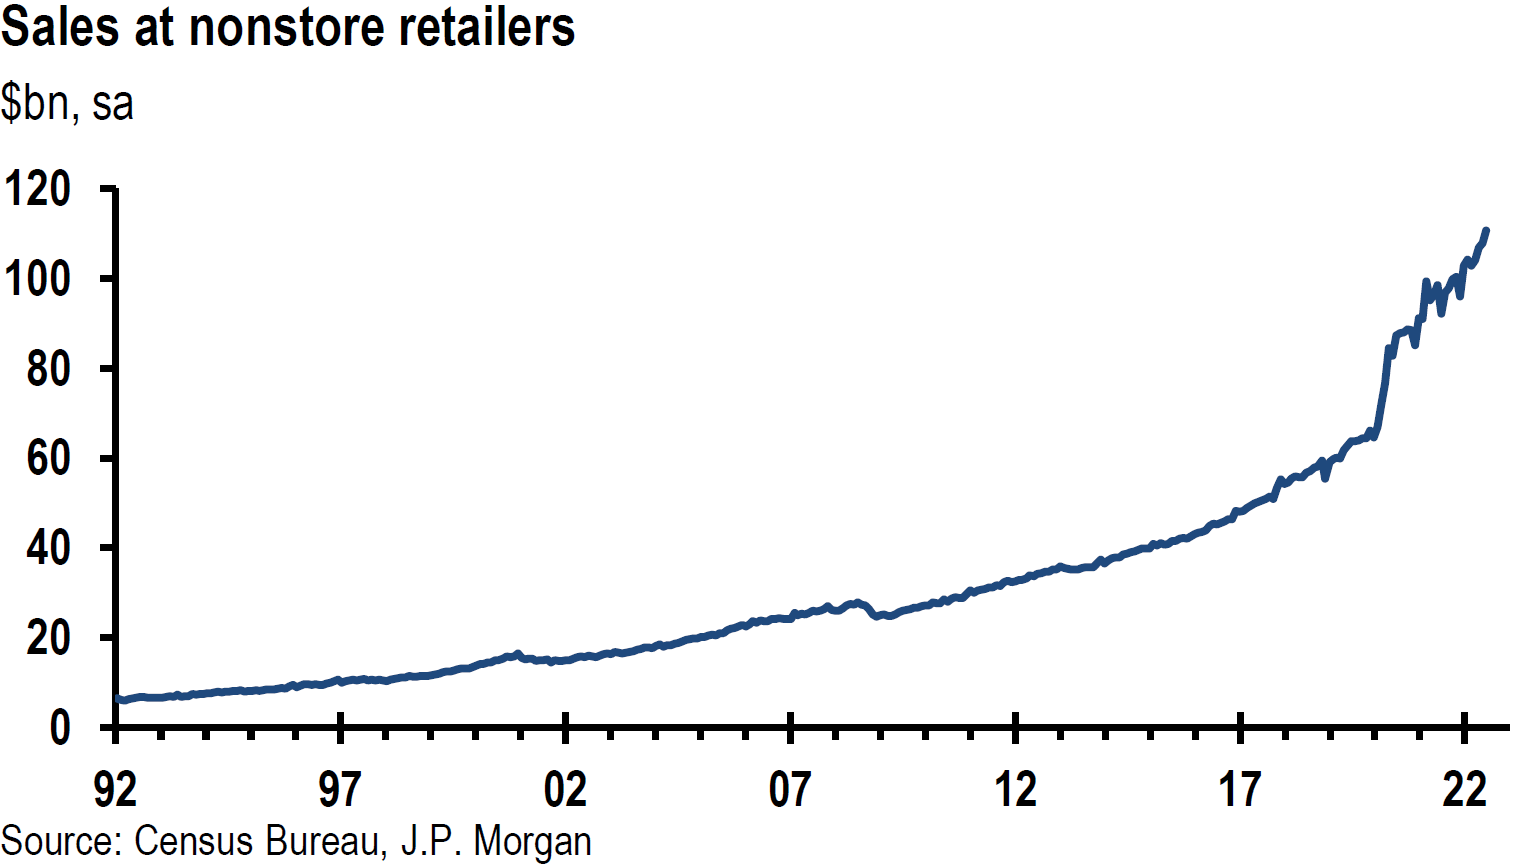
Headline U.S. retail sales for July were flat m/m – slightly below expectations of a 0.1% increase and 10.3% higher y/y. But these figures were “distorted” by a 1.8%-drop in gasoline stations’ sales as the price of gasoline dropped precipitously in July. Sales at motor vehicle and parts dealers were 1.6% lower. Non-store (on-line) retailers showed sales gains of 2.7% m/m and 20.2% y/y. Excluding gas station sales, total retail sales were 0.2% higher m/m. Retail sales for the control group – total excluding gasoline, autos, building materials, and food services – rose 0.8% m/m. The May control group sales were revised substantially higher from -0.3% to +0.8%, which more than offset a slight downward revision for June. After examining the underlying details of this retail report, many analysts viewed this report as being on the “strong” side. Given the volatile components and major revisions for retail data, we view the July data as rather inconclusive of any trend. Another reason for our hesitation in drawing any conclusion from the July retail data is the seasonal adjustment for auto and parts production. On August 16, J.P. Morgan (JPM) noted that auto and parts production dropped 12.4% before any seasonal adjustment, but rose 6.6% after such adjustments. July is very often a weak month for auto and parts production due to temporary plant closures and this is factored into seasonal adjustments. These seasonal adjustments were also largely responsible for the better-than-expected July industrial production readings released this week.
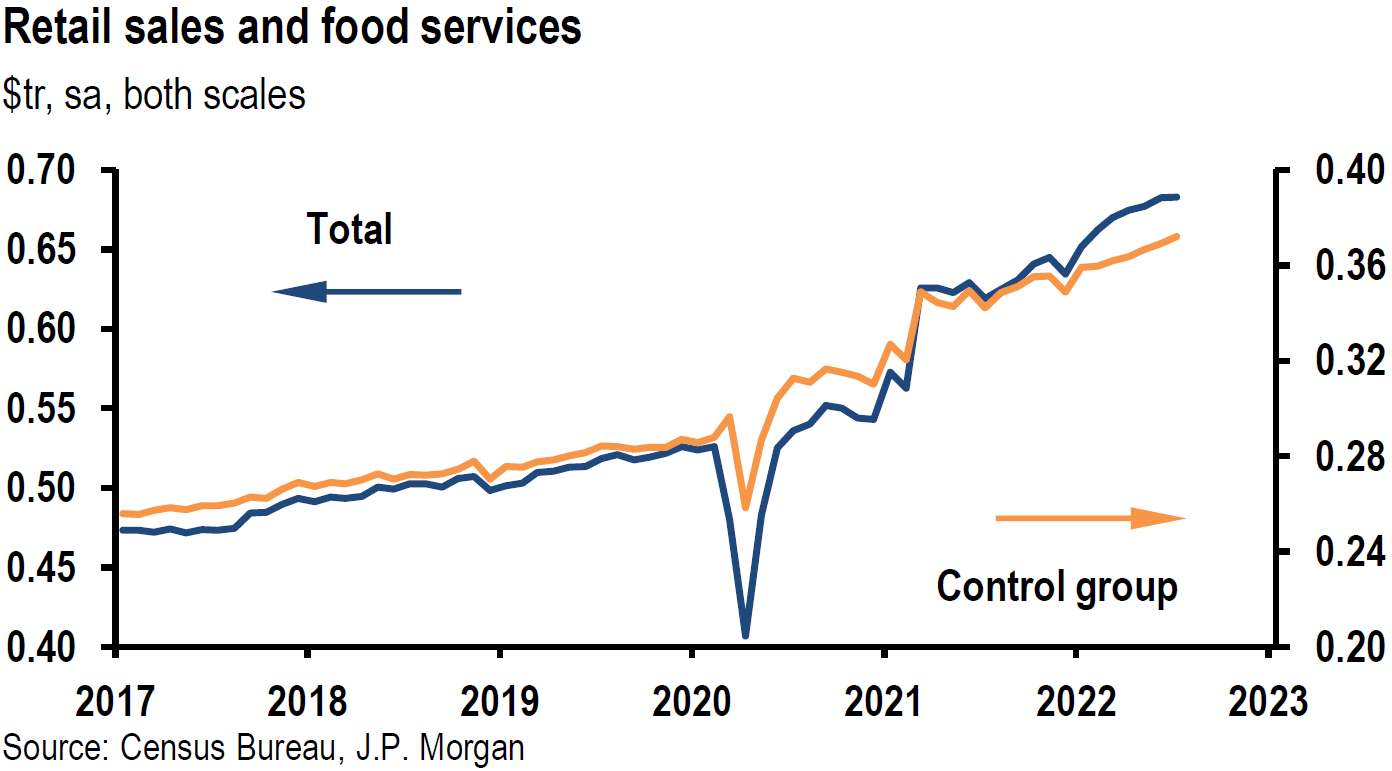
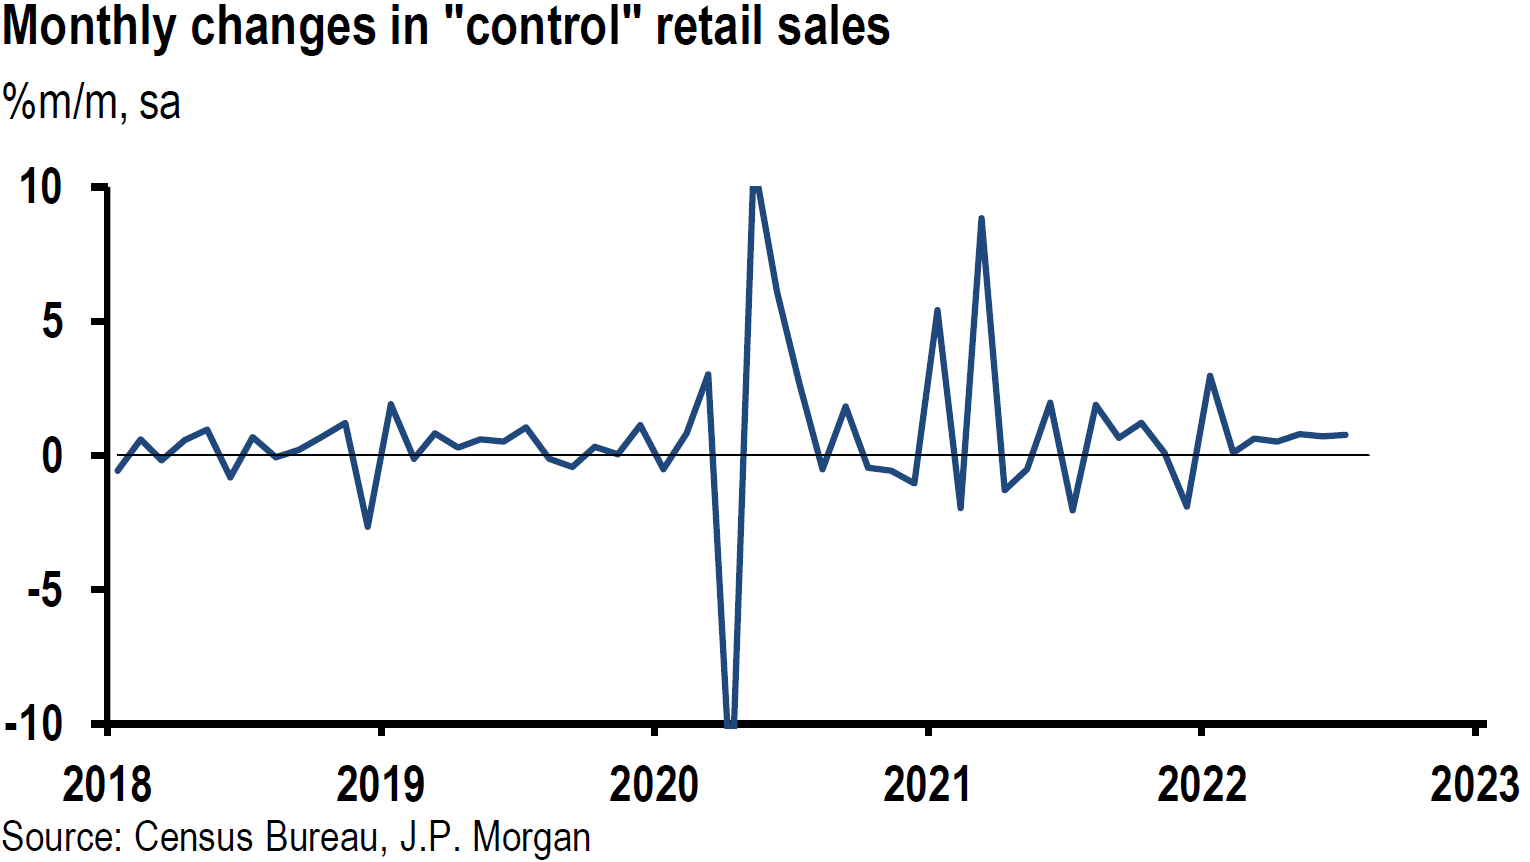
Source: JP Morgan, US: Stronger details underlying flat retail sales print (8-17-2022)
Selected Regional Fed Surveys
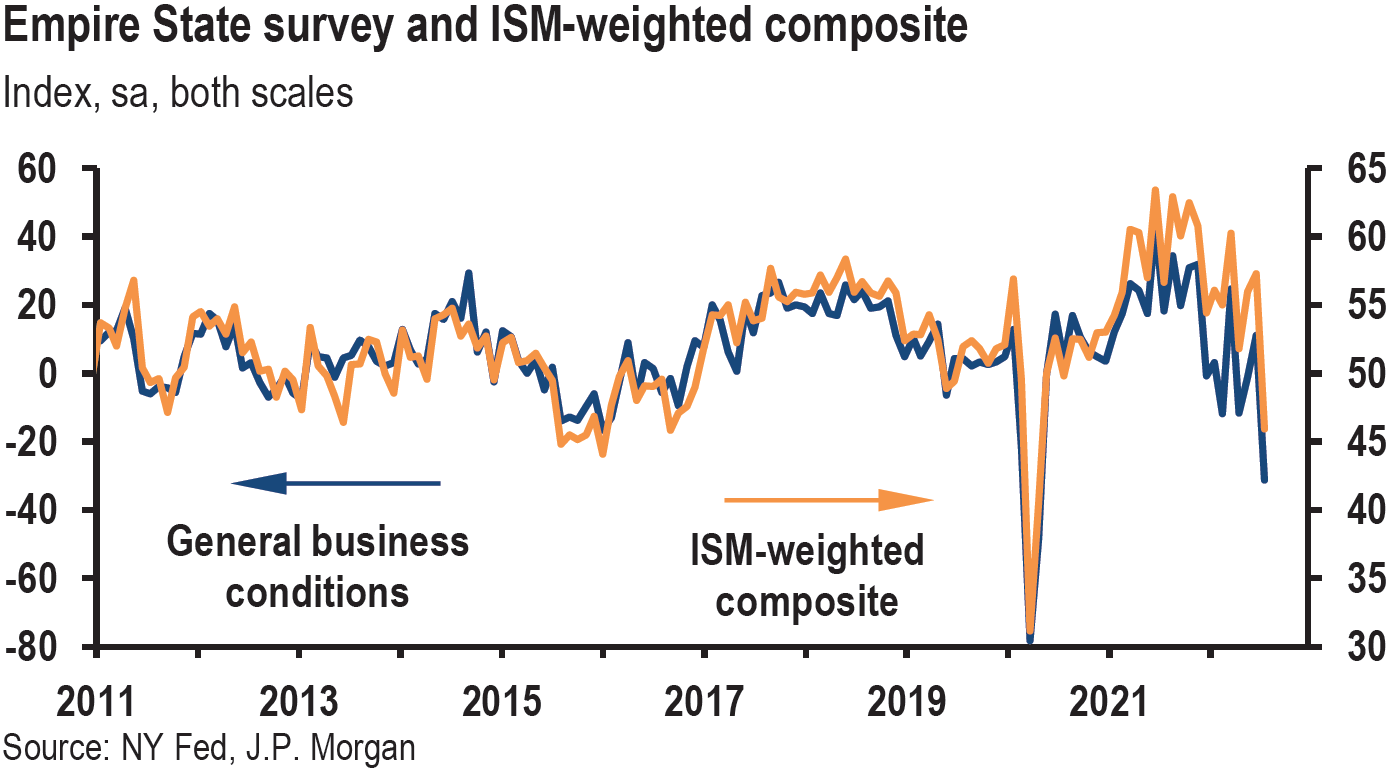
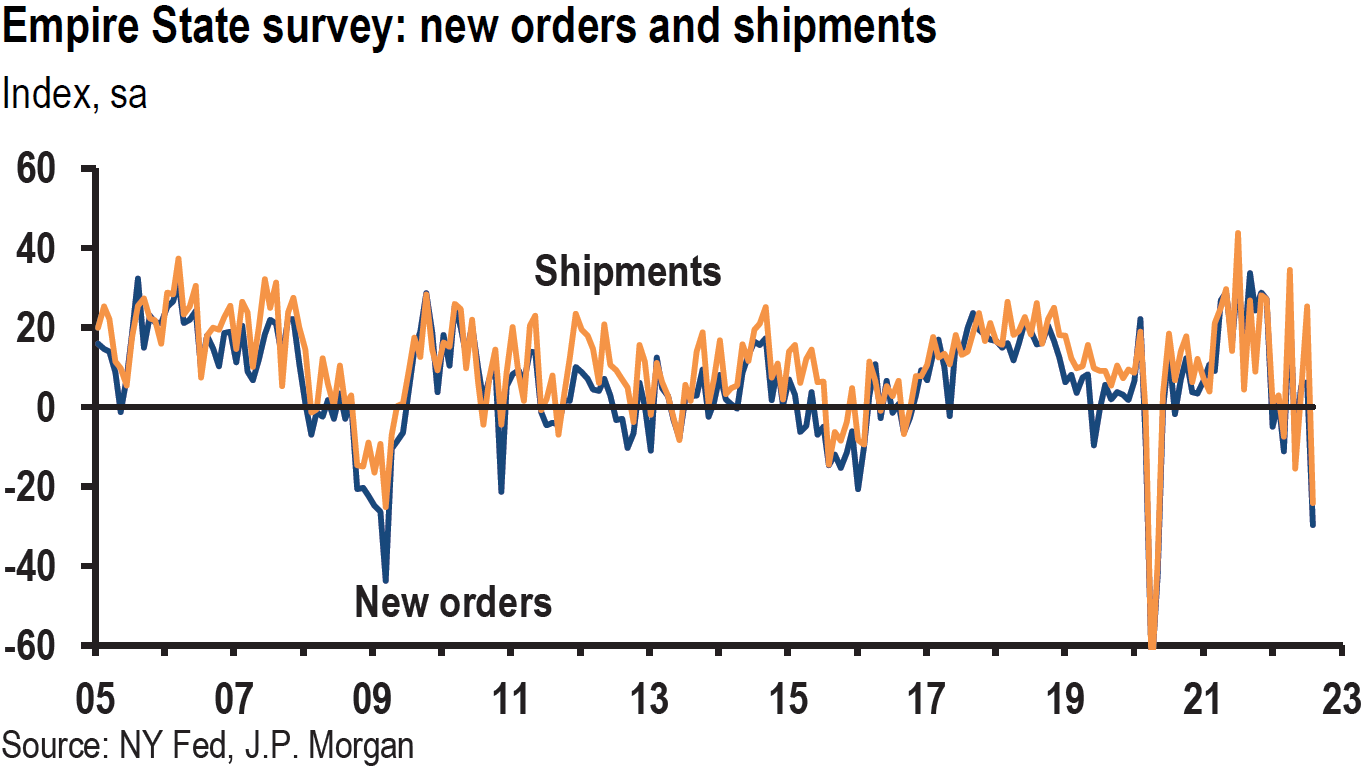
The latest regional Empire State manufacturing survey and the Business Leaders survey of service firms in the New York area – both conducted by the NY Fed –, as well as the Philadelphia Fed’s manufacturing survey were released this week. All three surveys generally showed a rather downbeat view of the U.S. economy. The Conference Board’s survey of its Leading Economic Indicators (LEI) also continued to point to a decline in near-term economic activity.
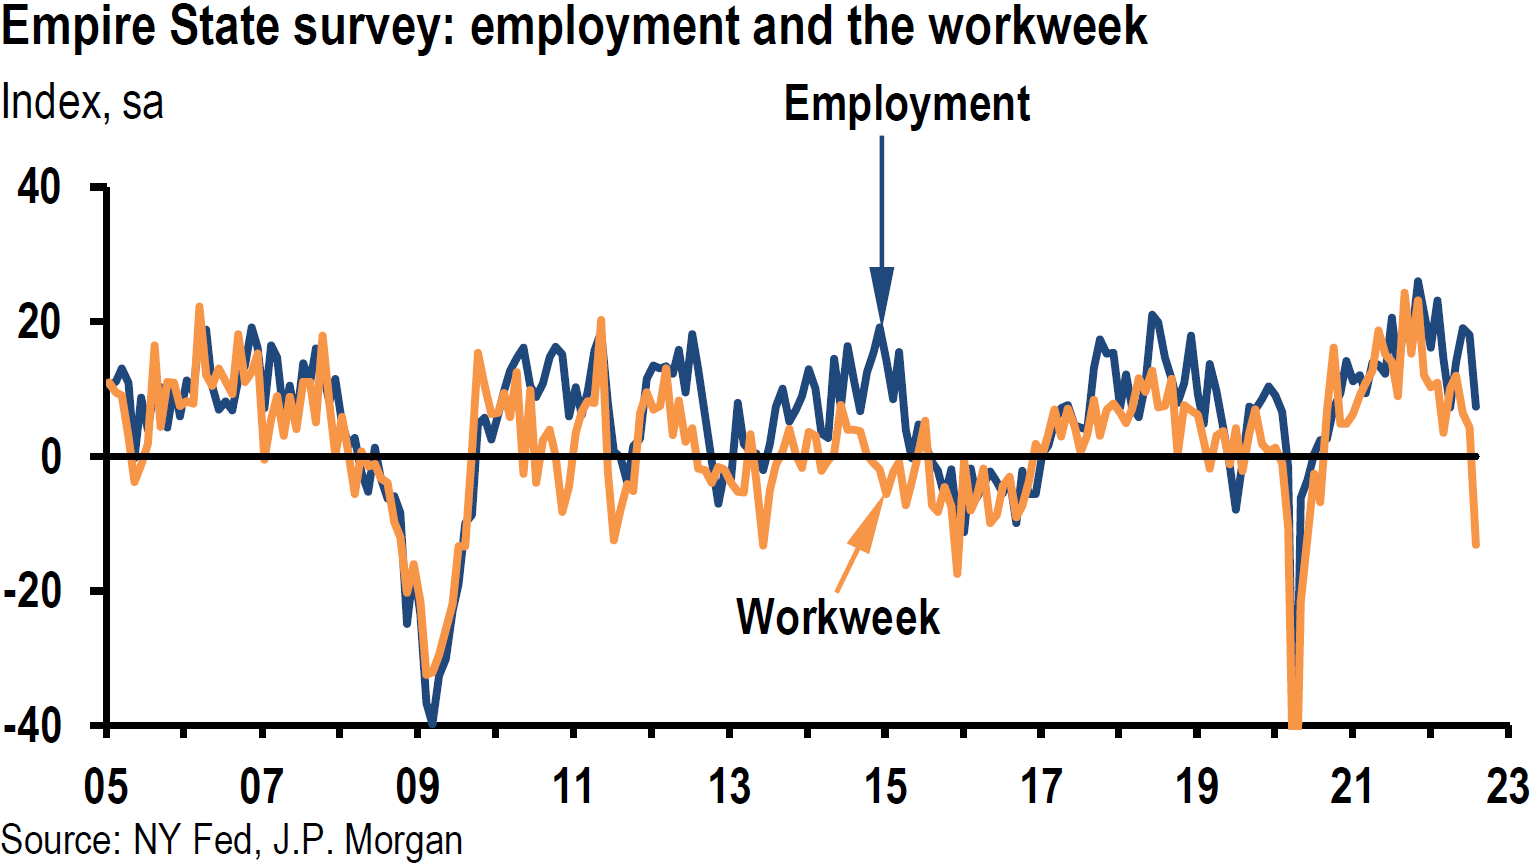
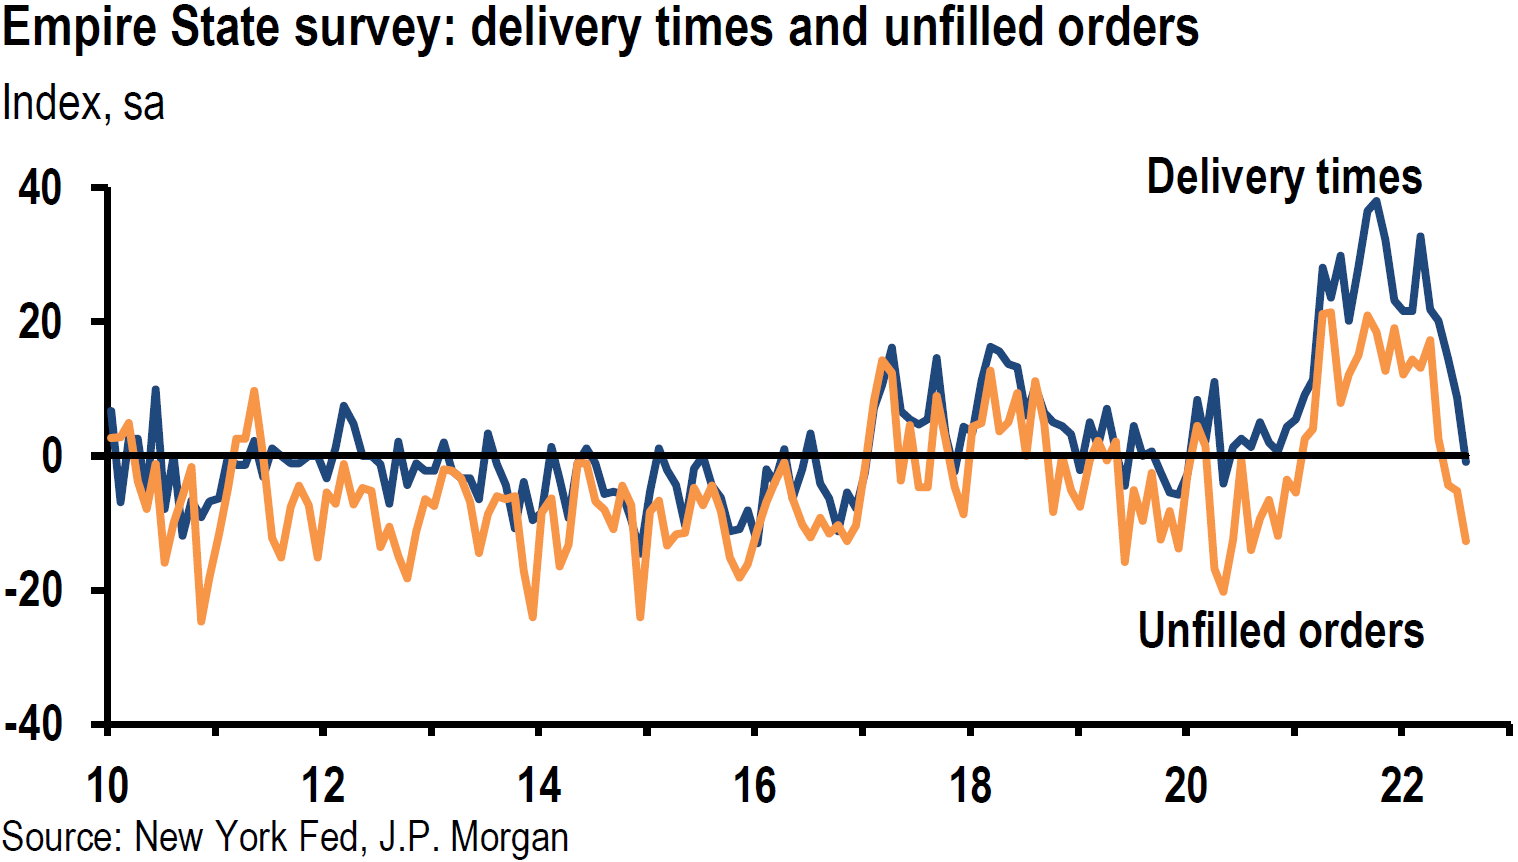
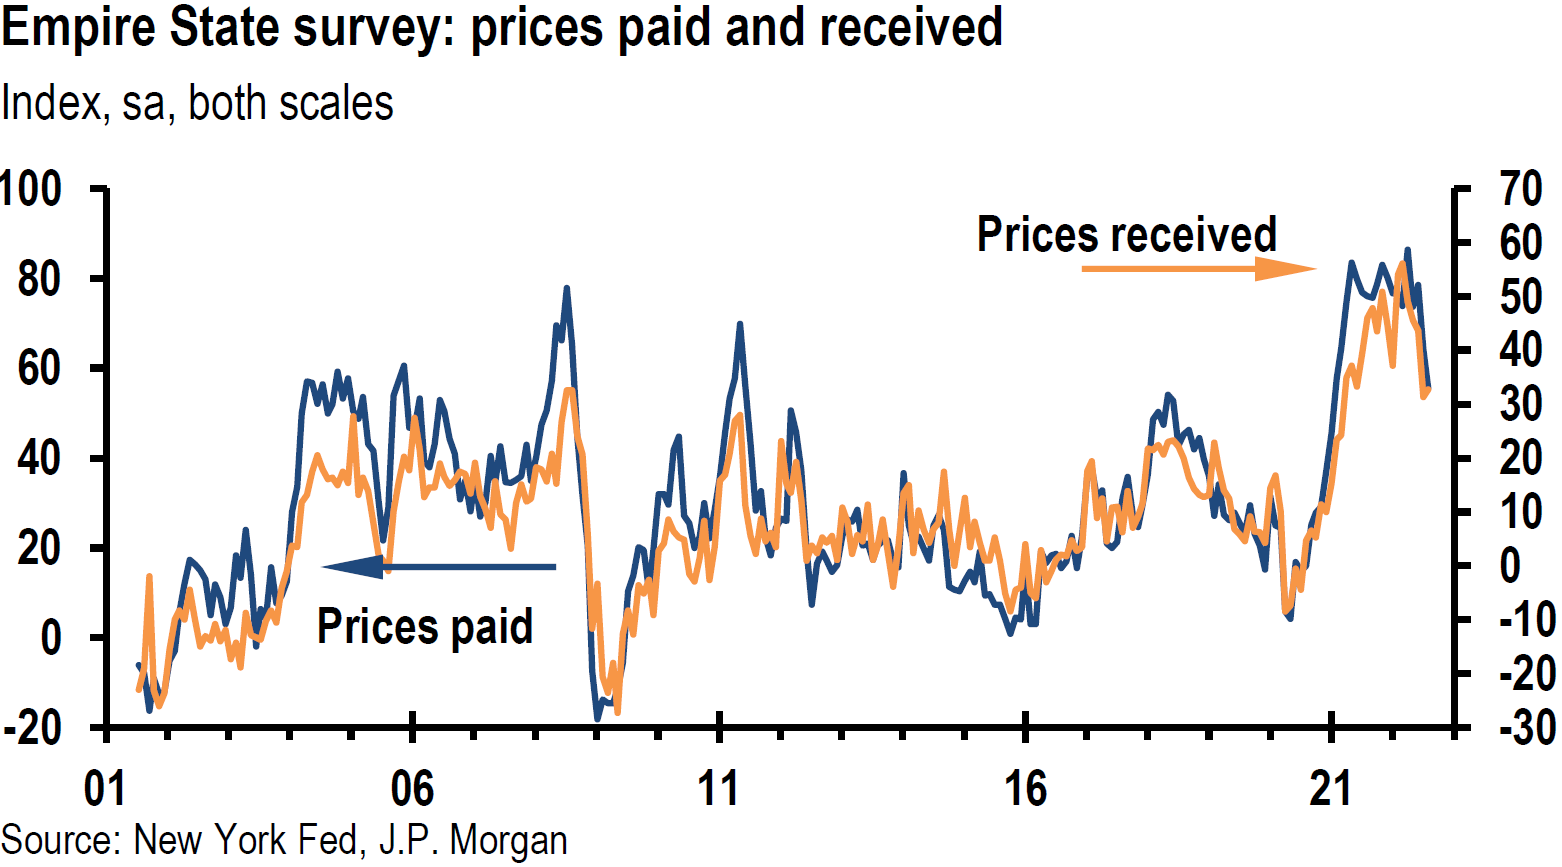
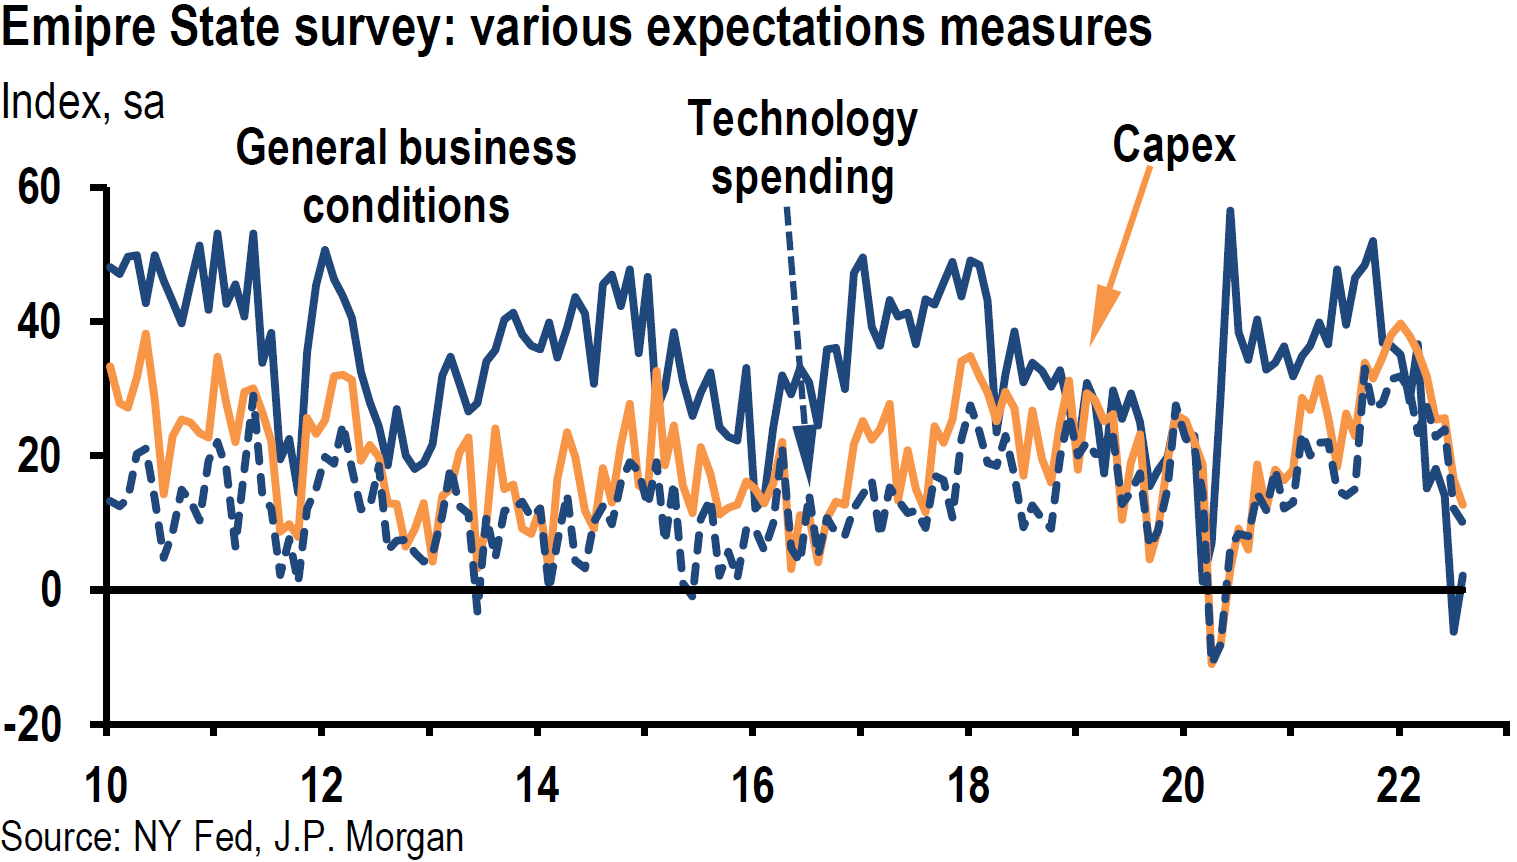
The Empire State manufacturing survey is based on responses collected in early August and was perhaps the most downbeat. Its headline general business conditions index plummeted 42 points to -31.3. This was the largest monthly decline in this survey’s history. New orders and shipments also plunged, but delivery times held steady for the first time in nearly two years. Businesses did not expect much improvement over the next six months. With responses also collected in early August, the NY Fed’s business leaders’ survey of service firms showed a six-point increase in its headline business activity index but remained in negative territory at -4.4. The business climate index also remained at a deeply negative level. Firms were not very optimistic that activity would increase over the next six months. Wage increases remained widespread and prices paid and received remained elevated.
The Philadelphia Fed’s manufacturing survey, with responses collected during the second week of August, held steady for the most part at low levels as most of survey’s indicators rose. The new orders index remained negative. Prices declined for the fourth consecutive month but remained elevated. Prices paid declined to their lowest level since December 2020 and prices received hit their lowest level since February 2021. The median firm’s forecasts for consumer inflation rates over the next year and ten years diminished. The Fed should be particularly encouraged by the ten-year forecast of an average rate of inflation of 3.0% – down from a 3.5% level in May. Inflation expectations appeared to be well “anchored.” The index for future business activity increased but remained negative for the third straight month.
Source: JP Morgan, US: Empire State Survey Falls Sharply in August (8-17-2022)
Conference Board’s Leading Economic Indicators Continue to Weaken
The Conference Board’s LEI index declined 0.4% to 116.6 compared to a 0.7% decline in June and a 1.6% decline over a six-month period that ended in July. The senior director of economics at the Conference Board thought that the recent monthly trend pointed to increased risks of a short but mild recession beginning by the end of this year or early next year. “Consumer pessimism and equity market volatility as well as slowing labor markets, housing, and manufacturing new orders suggest economic weakness will intensify and spread more broadly throughout the economy.”
Climate Change Possibly Affecting Supply Chains
Many months ago, we foresaw the possibility of many sporadic supply chain disruptions due to climate change. Extreme heatwaves and droughts in China, Europe and even the U.S. are beginning to realize many of these effects. China has begun rationing electricity in the southern China industrial province of Sichuan as a severe draught has limited China’s hydroelectric power. The production of lithium is but one of the many products affected. Lithium is a critical need for the manufacture of electric vehicles. In sharp contrast to the drought in many parts of China, excessive rainfall may potentially damage crops in northern China that could affect food inflation. The German draught is affecting logistics in the transportation of goods over Germany’s Rhine River. France has been forced to curtail its nuclear facility capacity to under 50% due to insufficient water to cool its nuclear reactors. The U.S. is considering water rationing from the Colorado River among various western states.
Higher Inflation and Slowing Economic Growth Overseas May Affect U.S.
Although we suspect that we have seen peak headline inflation in the U.S., we do not hold that view for many other counties. The UK and Europe continue recording multi-decade highs in their inflation rates. The UK headline July CPI rose 10.1% y/y – the highest rate in forty years. The UK’s negative real wages remain problematic. The very large gap between the higher private sector wages over those of the public sector could lead to more strikes like the rail strikes that have occurred already this year. The UK’s GfK Consumer Confidence Index for August hit its lowest level since the 1974 inception of this index. GfK’s client strategy director characterized the latest survey’s results as pointing to a “sense of capitulation.” The August reading was -44, as compared to a -8 reading one year ago. The European July headline CPI rose 8.9% y/y. This was the highest inflation rate since the inception of the euro in 1999. We expect higher future headline inflation rates for both the UK and Europe. Some or all of these factors could affect supply chains that could lead to higher inflation rates and slower rates of economic growth. We admit that the U.S. is somewhat insulated from potential overseas turmoil. But at some point, we can envision spillover effects causing an increase in U.S. inflation as well as a slowdown in its economic activity.
Bottom Line
For the time being we are maintaining our basic investment approach as expressed in last week’s commentary. We will continue to favor high quality big cap stocks with good balance sheets, as well as relatively stable cash flows and profit margins. For long-term investors who are prepared to tolerate volatility, we still maintain a preference for selected high-quality big-cap tech and growth stocks, as well as energy shares. Again, we only would add to positions on downturns. We assume continued volatility across virtually all financial markets. Many uncertainties remain. We continue to forecast very rapid changes in economic trends, many of which could be “surprising.”
Definitions
Inverted Yield Curve – An inverted yield curve describes the unusual drop of yields on longer-term debt below yields on short-term debt of the same credit quality. Sometimes referred to as a negative yield curve, the inverted curve has proven in the past to be a relatively reliable lead indicator of a recession.
Federal Funds Rate – The term federal funds rate refers to the target interest rate set by the Federal Open Market Committee. This target is the rate at which commercial banks borrow and lend their excess reserves to each other overnight.
Regional Fed Reserve Bank – The Federal Reserve System is composed of 12 regional Federal Reserve Banks that are each responsible for a specific geographic area of the U.S.
Neutral Rate Federal Funds Rate – The neutral rate is the theoretical federal funds rate at which the stance of Federal Reserve monetary policy is neither accommodative nor restrictive. It is the short-term real interest rate consistent with the economy maintaining full employment with associated price stability.
Restrictive Federal Funds Rate – A restrictive Federal Funds Rate is the rate at which the stance of the Federal Reserve monetary policy is restrictive with the goal of taking liquidity out of the market in order to slow economic growth.
Steeper Yield Curve – If the yield curve steepens, this means that the spread between long- and short-term interest rates widens. It typically indicates stronger economic activity and rising inflation expectations, and thus, higher interest rates. When the yield curve is steep, banks are able to borrow money at lower interest rates and lend at higher interest rates.
Federal Open Market Committee (FOMC) – The Federal Open Market Committee (FOMC) is the branch of the Federal Reserve System that determines the direction of monetary policy specifically by directing open market operations. The committee is made up of 12 members: the seven members of the Board of Governors; the president of the Federal Reserve Bank of New York; and four of the remaining 11 Reserve Bank presidents on a rotating basis.
Growth Stock – A growth stock is any share in a company that is anticipated to grow at a rate significantly above the average growth for the market. These companies generally do not pay dividends, instead growth stocks tend to reinvest any earnings they accrue in order to accelerate growth in the short term.
Market Liquidity – Market liquidity refers to the extent to which a market, such as a country’s stock market or a city’s real estate market, allows assets to be bought and sold at stable, transparent prices.
Quantitative Tightening (QT) – Quantitative tightening refers to monetary policies that contract, or reduce, the Federal Reserve System’s balance sheet.
Headline Consumer Price Index (Headline CPI) – Headline inflation is the raw inflation figure reported through the Consumer Price Index (CPI) that is released monthly by the Bureau of Labor Statistics (BLS). The CPI calculates the cost to purchase a fixed basket of goods to determine how much inflation is occurring in the broad economy. The CPI uses a base year and indexes the current year’s prices, according to the base year’s values.
Leading Economic Indicators Conference Board – The components of The Conference Board Leading Economic Index for the U.S. include:
- Average weekly hours in manufacturing – The average hours worked per week by production workers in manufacturing industries tend to lead the business cycle because employers usually adjust work hours before increasing or decreasing their workforce.
- Average weekly initial claims for unemployment insurance – The number of new claims filed for unemployment insurance are typically more sensitive than either total employment or unemployment to overall business conditions, and this series tends to lead the business cycle.
- Manufacturers’ new orders for consumer goods and materials – These goods are primarily used by consumers. The inflation-adjusted value of new orders leads actual production because new orders directly affect the level of both unfilled orders and inventories that firms monitor when making production decisions.
- ISM Index of New Orders – This index reflects the levels of new orders from customers. As a diffusion index, its value reflects the number of participants reporting increased orders during the previous month compared to the number reporting decreased orders, and this series tends to lead the business cycle.
- Manufacturers’ new orders for nondefense capital goods excluding aircraft orders – This index, combing with orders from aircraft (in inflation-adjusted dollars) are the producers’ counterpart to consumer goods and materials.
- Building permits for new private housing units – The number of residential building permits issued is an indicator of construction activity, which typically leads most other types of economic production.
- S&P 500 Index of Stock Prices – The Standard & Poor’s 500 stock index reflects the price movements of a broad selection of common stocks traded on the New York Stock Exchange.
- Leading Credit Index – This index is consisted of six financial indicators: 2-years Swap Spread (real time), LIBOR 3 month less 3 month Treasury-Bill yield spread (real time), Debit balances at margin account at broker dealer (monthly), AAII Investors Sentiment Bullish (%) less Bearish (%) (weekly), and Senior Loan Officers C&I loan survey
- Interest rate spread (10-year Treasury bonds less federal funds rate) – The spread or difference between long and short rates is often called the yield curve.
- Average consumer expectations for business condition – This index reflects changes in consumer attitudes concerning future economic conditions.
GfK Consumer Confidence Index – The UK’s GfK Consumer Confidence Index is derived from a survey of about 2,000 consumers asked to rate the relative level of past and future economic conditions including personal financial situation, climate for major purchases, overall economic situation, and savings level.
IMPORTANT DISCLOSURES
The views and opinions included in these materials belong to their author and do not necessarily reflect the views and opinions of NewEdge Capital Group, LLC.
This information is general in nature and has been prepared solely for informational and educational purposes and does not constitute an offer or a recommendation to buy or sell any particular security or to adopt any specific investment strategy.
NewEdge and its affiliates do not render advice on legal, tax and/or tax accounting matters. You should consult your personal tax and/or legal advisor to learn about any potential tax or other implications that may result from acting on a particular recommendation.
The trademarks and service marks contained herein are the property of their respective owners. Unless otherwise specifically indicated, all information with respect to any third party not affiliated with NewEdge has been provided by, and is the sole responsibility of, such third party and has not been independently verified by NewEdge, its affiliates or any other independent third party. No representation is given with respect to its accuracy or completeness, and such information and opinions may change without notice.
Investing involves risk, including possible loss of principal. Past performance is no guarantee of future results.
Any forward-looking statements or forecasts are based on assumptions and actual results are expected to vary from any such statements or forecasts. No assurance can be given that investment objectives or target returns will be achieved. Future returns may be higher or lower than the estimates presented herein.
An investment cannot be made directly in an index. Indices are unmanaged and have no fees or expenses. You can obtain information about many indices online at a variety of sources including: https://www.sec.gov/fast-answers/answersindiceshtm.html or http://www.nasdaq.com/reference/index-descriptions.aspx.
All data is subject to change without notice.
© 2024 NewEdge Capital Group, LLC


