

Weekly Summary: May 9 – May 13, 2022
Key Observations:
- In our estimation, Vladimir Putin remains the single most important variable and uncertainty in forecasting the probabilities and the extent of inflation, slowing economic growth, stagflation and recession.
- Presently, our base case is that the Russia-Ukraine war (war) and sanctions against Russia will persist for quite some time. We understand that the longer this war persists, the more probable stagflation and/or recession become. It appears that financial markets, and in particular U.S. equities, are increasingly pricing in a U.S. recession in the next twelve months.
- As we stated in our last week’s commentary, ever since Russia’s invasion of Ukraine on February 24, the “increasing number of variables are amplifying uncertainties as possible outcomes multiply.” China’s “dynamic zero COVID-19” policies with their accompanying “lockdowns” have only exacerbated the uncertainties as they added to the number of variables.
- After the release of the U.S. April Consumer Price Index (CPI) and Producer Price Index (PPI) data this week, we remain resolute in our opinion that the Fed will pursue an aggressive tightening monetary policy to rein in inflation. We remain agnostic as to whether we have witnessed “peak” rates of inflation in the U.S.
The Upshot: We interpret recent trading in U.S. equities to be pricing in an elevated chance of a recession within the next twelve months. We surmise that this view has taken hold of the markets as the markets seem to be assuming that the war will persist for quite some time. In its Financial Stability Report released this week, the Federal Reserve (Fed) voiced its concerns that diminished liquidity in financial markets has helped to make financial markets more volatile. We agree. Lowered liquidity, greater uncertainty and less conviction are a rather potent mixture that we expect to lead to continued volatility as long as the war persists. U.S. consumers appear to be very confident about their job security and prospects. Many consumers continue to have optimistic spending plans. In spite of seemingly robust balance sheets, however, they have recently shown a noticeable heightened tendency to borrow, The NY Fed national survey of consumers released this week shows that many consumers are concerned that credit availability could be diminished in one year. Perhaps they could be assuming that their wages will not keep pace with inflation and that their solid balance sheets might be insufficient to meet their contemplated expenditures. We suppose that this perceived need for higher wages that might be necessary to meet consumers spending plans in light of expected higher inflation rates is at the root of small business pessimism on future business conditions. Given our assumptions, we continue to anticipate that global economic growth forecasts will be lowered and that inflation forecasts will be raised. We still favor diversified portfolios that consist of high quality big cap stocks as well as some commodity exposure. We will continue to look for opportunities to take advantage of market volatility.
“Psycho Killer”
When Russia first invaded Ukraine on February 24 we characterized Russia’s president Vladimir Putin as the “Hoochie Coochie Man” as depicted in Muddy Waters’ song of the same name. The Hoochie Coochie Man was someone not to “mess with.” After witnessing the subsequent horrors of the war, I had to find a song with the most extreme depiction that would be more suitable. I want to make clear that this is my own personal depiction of Putin as I see him at present. In answer to the question posed in the Talking Heads’ song “Psycho Killer” – “Qu’est-ce que c’est?” (What is it?), my answer is that Putin is the “Psycho Killer” in my own personal view. We could easily see the first two lines as an apt description of Putin as I view him: “I can’t seem to face up to the facts; I’m tense and nervous and I can’t relax.” To paraphrase another line from this song, I view Putin as both “vain” and “blind.”
Our Base Case on War
In many of our recent commentaries, we highlighted the increasing number of variables, uncertainties and possible outcomes since Russia’s invasion. But the ultimate uncertainty must be Putin himself in our estimation. Putin and his foreign minister have mentioned the possible use of “tactical” nuclear weapons on more than one occasion. Putin has a history of often following through on his threats. Although we cannot handicap this possibility, we also chose not to dismiss it. Our base case does not include this possibility and we view this as one of those binary outcomes for which there really is no hedge. At present, our base case with respect to the war is that it will persist probably for quite some time and that sanctions against Russia will likely persist even longer. Higher-than-otherwise energy and food costs will then persist. Other commodities could also be affected adversely which could also affect supply chains and constraints. But many other possible outcomes could be realized, including a quick and unexpected resolution of this war. We are really not trying to forecast how or when this war will end. All we can do is assess its ramifications if it continues somewhat in its present form.
High Uncertainty, Low Conviction, Low Liquidity = Volatility
The above depiction of the many uncertainties that confront us is very applicable to the current financial market environment, in particular with respect to U.S. equities – high uncertainty along with low conviction. This combination has led to increasing volatility in financial markets. In its latest Financial Stability Report released this week, the Fed expressed its concern of a “higher-than-normal” risk of a sudden deterioration in liquidity in financial markets. This report is published twice a year and is intended as the Fed’s current assessment of the U.S. financial system. “While the recent deterioration in liquidity has not been as extreme as in some past episodes, the risk of a sudden significant deterioration appears higher than normal.” The Fed highlighted the decline in liquidity since the end of 2021 for recently issued U.S. cash Treasury securities and for U.S. equity futures. We have commented often that some surprisingly quick movements in Treasury yields might have been at least partly due to illiquid markets and to extreme positioning by market participants. The Fed noted that most of the illiquidity in Treasuries appeared to be focused on the front part of the yield curve – shorter maturities – mostly because it was prone to respond more quickly to perceived policy changes in the Fed’s monetary stance.
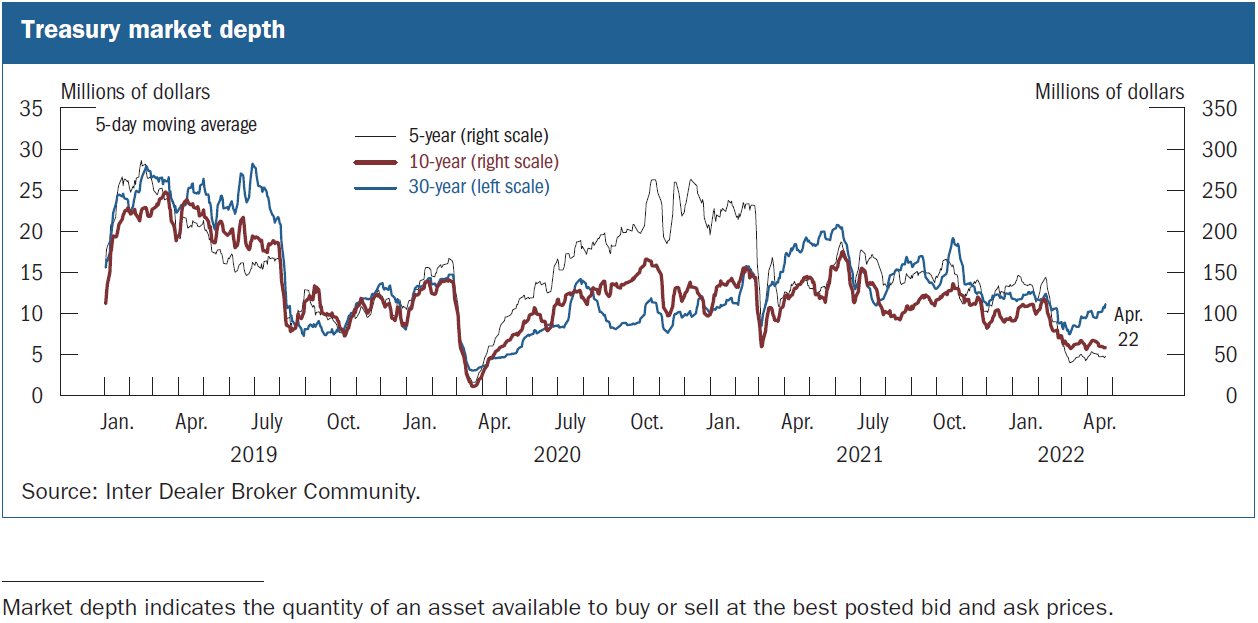
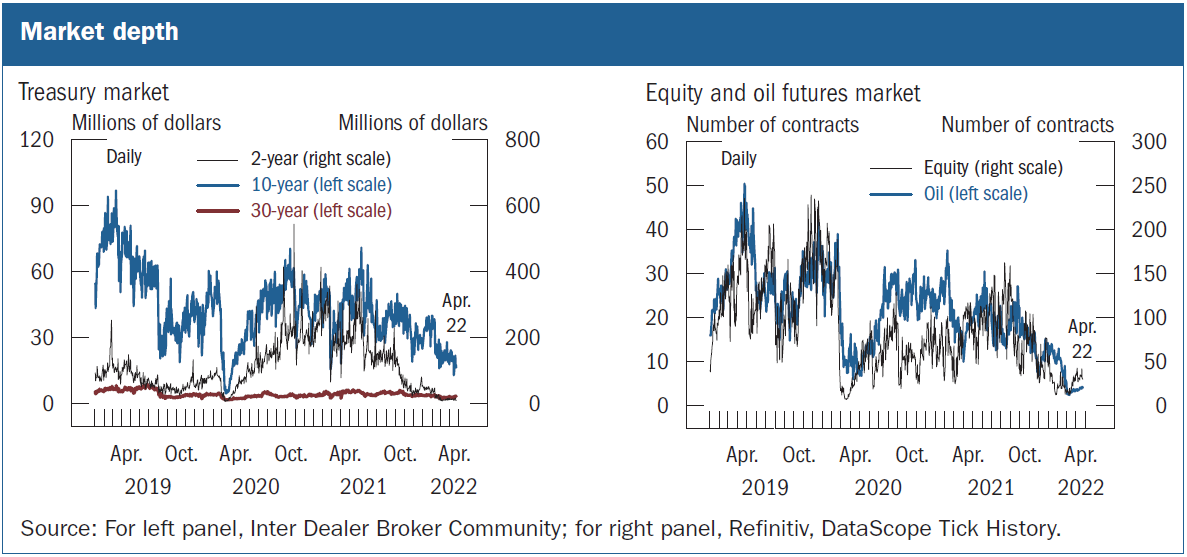
Source: BOARD OF GOVERNORS OF THE FEDERAL RESERVE SYSTEM, Financial Stability Report – May 2022 (4/25/22)
Fed Observations on Volatile Commodity Markets, Stablecoins and Credit Spreads of Corporate Bonds
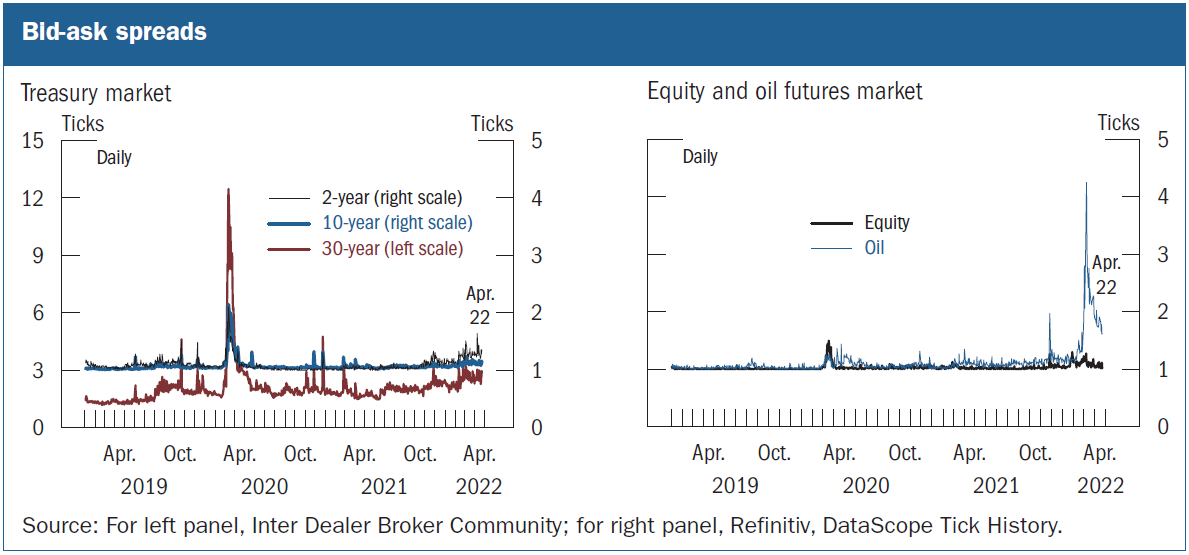
In a statement accompanying the Fed’s report, Fed Governor Lael Brainard noted that the war “has sparked large price movements and margin calls in the commodities market [– especially oil futures markets –] and highlighted a potential channel through which large financial institutions could be exposed to contagion.” In a very timely observation, the Fed also reiterated its concerns over the financial risk posed by stablecoins, how they were “vulnerable to runs” and how there was a lack of transparency around the assets that are supposedly backing stablecoins. This week confirmed the Fed’s concerns over stablecoins. Illiquid financial markets by their very nature have a strong tendency to exacerbate volatility and could possibly even lead to market “dislocations.” Other significant observations in this report included that credit spreads in corporate bond markets “widened considerably”, that banks remained well capitalized but that some money market and bond funds were still exposed to sizable liquidity risks. The Fed also thought that leverage at life insurance companies and hedge funds “remained high by historic standards.”
Persistence of Lower U.S. Equity Markets May Affect VIX Levels
At Thursday’s close of the major U.S. equities markets, we were very surprised to find that Cboe Volatility Index (VIX) traded lower in spite of the rather precipitous drop in the major U.S. equity indexes. The VIX is often dubbed the “fear” index and is expected to rise as put buying is increased. Some market participants speculated that the decrease in the VIX level could have been at least partly due to investors and/or traders “de-grossing” – reducing their positions by selling their stocks and the underlying puts that were meant to hedge their long equity positions. On May 12, Goldman Sachs countered with a more intriguing proposition. This week the S&P 500 (SPX) hit its first 12-month low since 2020 and was about 18% below its January 3 peak at Wednesday’s close. The SPX also hit a three-month low in May for the fifth consecutive calendar month and for the first time since 1974. “May is also on track to be the seventh consecutive month SPX realized [volatility] has increased – only the second such streak in the index’s 90-year history.” Volatility then trended higher for several years after that streak. Evidently, when equity downturns are persistent as they have been in 2022 and significantly lower already, “market participants do not see implied vol rising [for SPX] quickly should the sell-off continue …” But according to Goldman, this does not apply to single stocks, which can still have considerable downside and robust puts activity.
Increasing Risks of Stagflation and Recession
Although we have focused on the Fed’s monetary tightening policies to rein in inflation, we have become concerned increasingly about stagflation and recession risks, as noted in our prior week’s commentary. We view the unrelenting and persistent downturn in U.S. stocks in general, and in these last two weeks in particular, as factoring in the increasing probability of a recession in the next twelve months. The U.S. equity indexes could continue to trade lower to the extent that this perception lasts. Nevertheless, unexpected and quick rebounds in stock prices are possible at any time. Unfortunately, the longer the war persists, the more likely that many countries, including the U.S., will experience a recession. China’s now “dynamic zero-COVID-19” policies with accompanying lockdowns would only exacerbate the likelihood of recessions. The dynamic part of China’s new COVID-19 approach now involves “mass testing” with the hope that broad-based lockdowns might be avoided to some extent.
Increases in Consumer Credit Growth
Along with the Fed, we have highlighted the robustness of the balance sheets of both the consumers and businesses. Although we remain optimistic that the U.S. consumer will continue to spend, we are beginning to question its continuing resiliency if inflation does not begin to moderate more quickly. On May 6, J.P. Morgan (JPM) remarked that it was beginning to see a drag in its recent Chase card spending data on consumer demand due to higher gasoline prices. In contrast, Goldman Sacks remarked on May 11 that it witnessed a dramatic increase in revolving consumer credit growth in March, mostly through credit cards, but credit balances still remained “well below normal.” However, if consumer credit continued to expand at March’s pace and consumers’ balance sheets returned to more normal levels, Goldman thought that consumers might become more constrained in their spending by Q3. Filings by commercial banks also indicated a clear increase in consumer credit demand since the start of this year. If consumer credit continued to expand rapidly, Goldman saw a “sizable” downside risk to spending “beyond the very near term.”
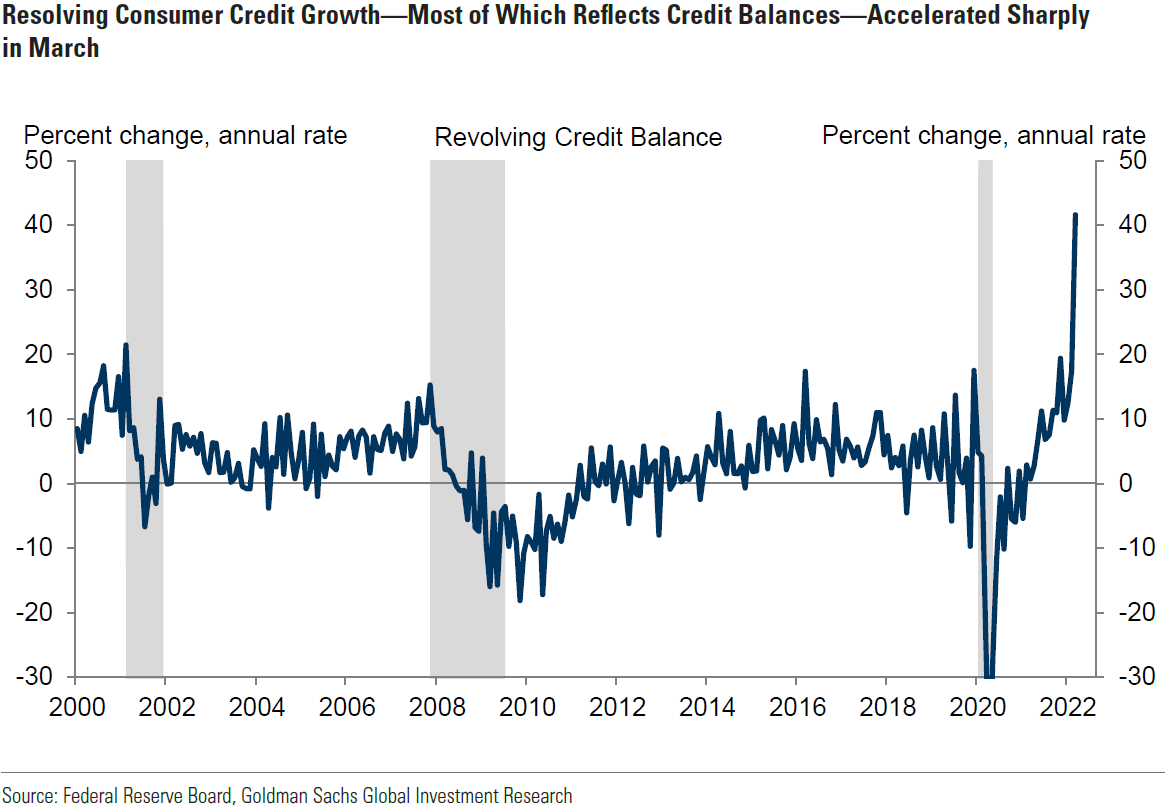
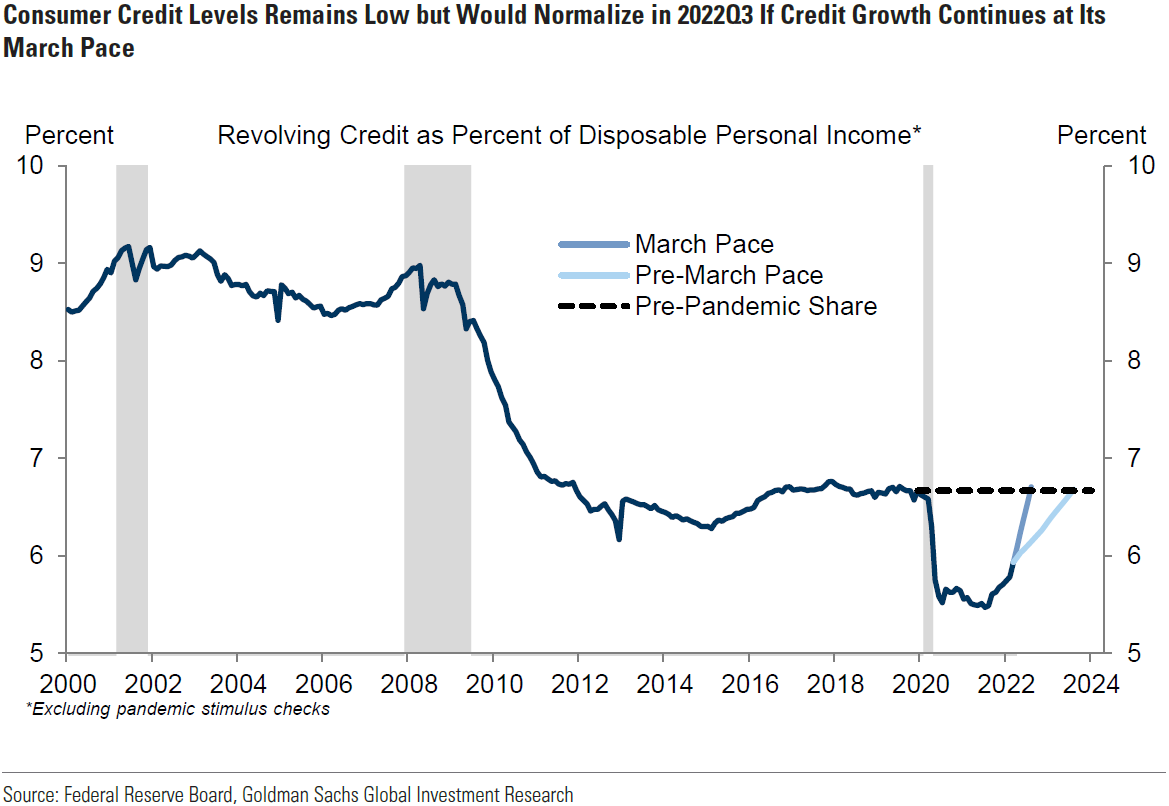
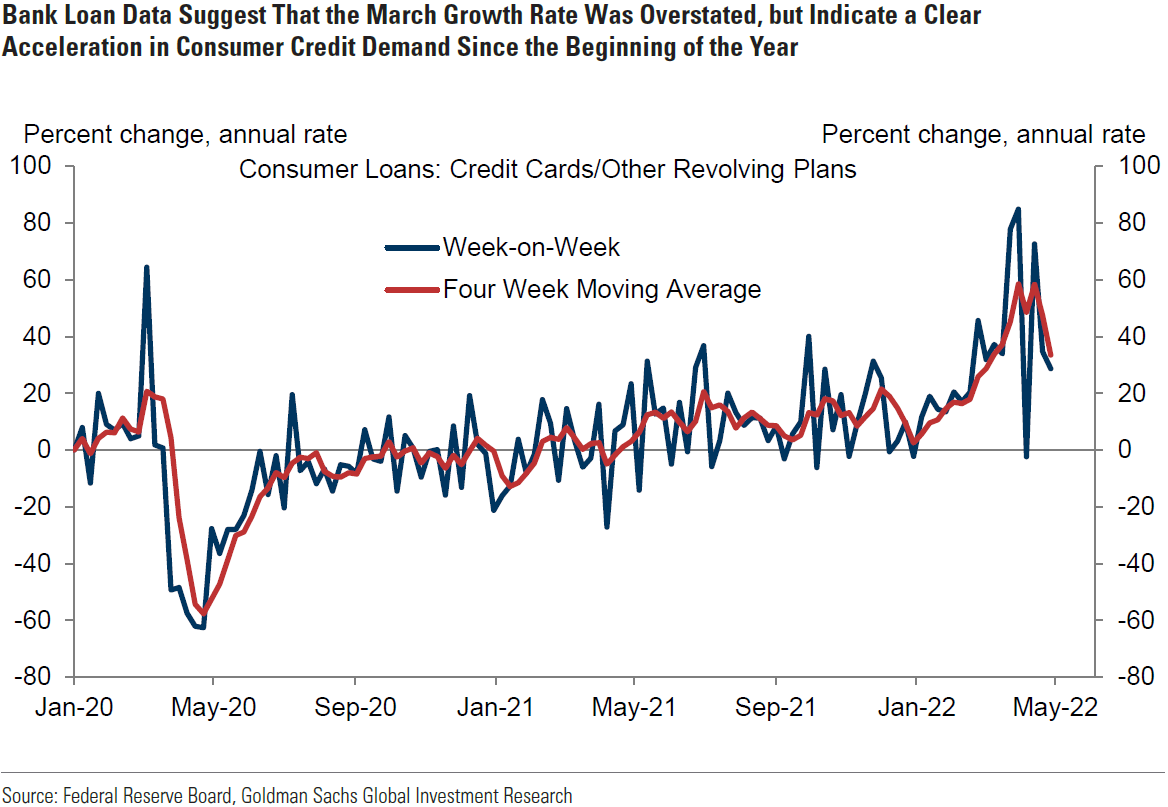
Source: Goldman Sachs, US Daily: Is the Recent Rise in Consumer Credit Growth Concerning? (5/11/22)
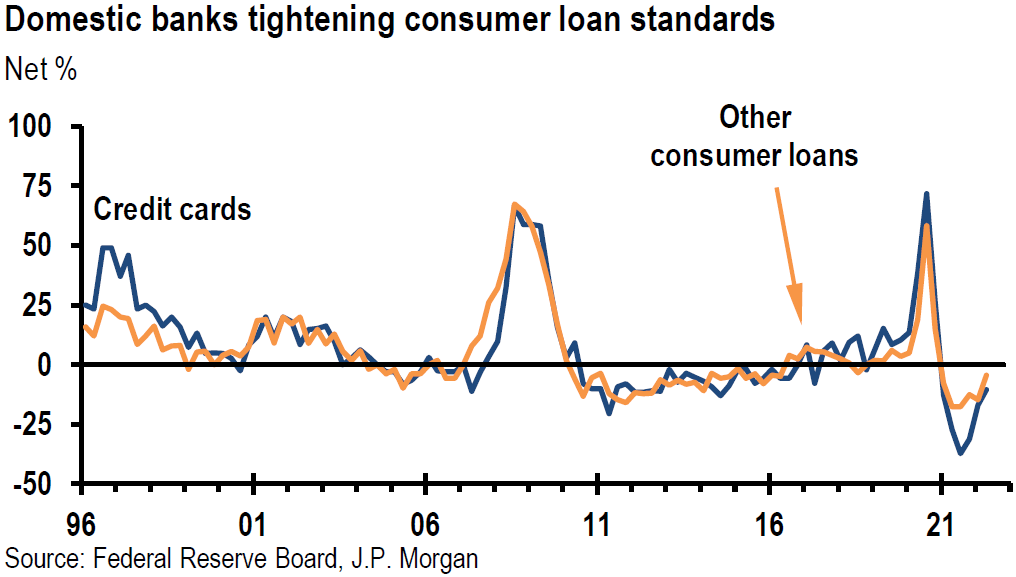
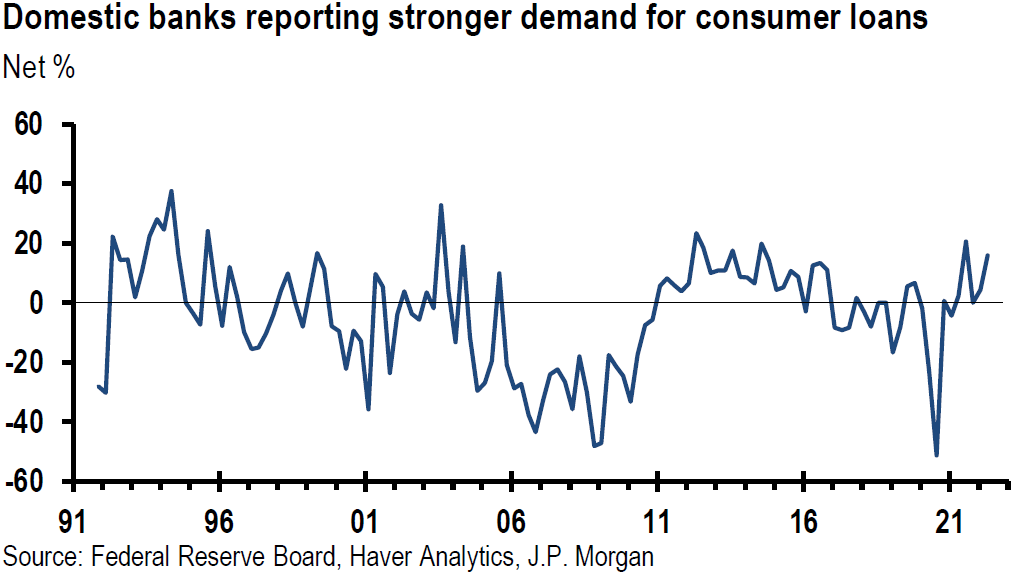
Source: J.P. Morgan, US: SLOOS shows less easing in lending standards (5/9/22)
NY Fed – National Survey of Consumers and Expected Diminished Credit Availability
On Monday, May 9, the NY Fed released its survey of consumers’ expectations on inflation and on their financial conditions. This is a national internet based survey of household heads. Consumers remained very positive about the labor market over the next year and reflected this in their series-high expectations to spend over the next year. But their perception of their own credit access over the next year fell for the fourth consecutive month to a series low. We interpret this to mean that when labor market tightness begins to abate, consumer spending might drop rather quickly as credit availability becomes more problematic. Median consumer inflation expectations for the next year decreased 0.3% from the series high in March to 6.3%, but increased 0.2% to 3.9% for the three year outlook. Consumers’ uncertainty about their future inflation expectations remain at, or close to a series high as well.
Fed Senior Loan Officer Survey of Banks’ Lending Standards and Loan Demand
The Fed also released on Monday its Senior Loan Officer Survey of banks’ lending practices. This survey is meant to indicate the changes in bank lending practices and standards to both businesses and households over the past three months. This survey confirmed that consumer demand for many types of consumer loans increased over the past three months, but there was a noticeable drop in demand for mortgage loans. Banks were reported to have eased their lending standards for auto and credit card loans. In general, banks either maintained their latest lending standards or eased them less than they have done in most recent quarters. On balance, lending standards were maintained for commercial and industrial loans after having been eased over the prior four quarters. Likewise, for most commercial real estate loans lending standards were maintained, except for those loans secured by multifamily residential properties. Easier standards were reported for those types of loans as demand for those loans strengthened. The majority of banks, which continued to ease their lending standards, cited more aggressive competition from other banks or nonbank lenders as an important reason for doing so. On Monday, JPM characterized this survey’s findings as “consistent with an economy losing some momentum.”
Small Business Pessimism on Future Business Conditions
Consumers’ optimism of their own job prospects over the next year looks like it could be the principal reason for a more pessimistic outlook for small business owners’ expectations of future business conditions. The NFIB small business optimism index for April was released on Tuesday. This index remained below its 48-year average for the fourth consecutive month. The survey showed that small business owners expecting better business conditions over the next six months decreased one point to a negative 50, which is the lowest level recorded in the 48-year history of this survey. Perhaps the chief National Federation of Independent Business (NFIB) economist summed it up best: “The labor supply is not responding strongly to small business high wage offers and the impact of inflation has significantly disrupted business operations.” As we have highlighted in recent commentaries, small business appears to have been negatively affected in a disproportionately negative manner relative to their larger counterparts in regard to supply chain disruptions and limited supplies. Small business has been historically the U.S. “engine” of economic growth. A healthy and longer-lasting economic growth trajectory should eventually require a more robust small business community.
U.S. April CPI
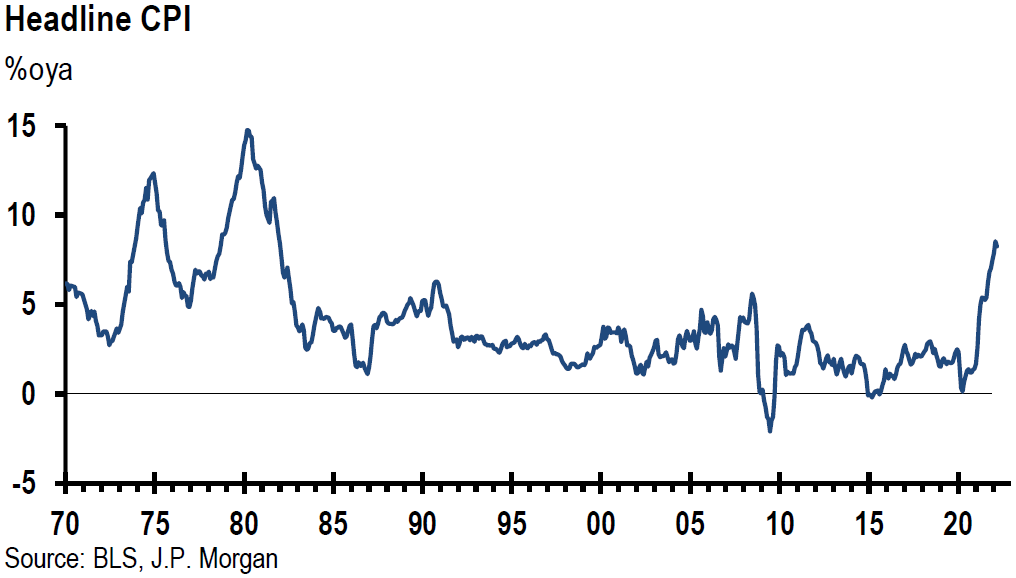
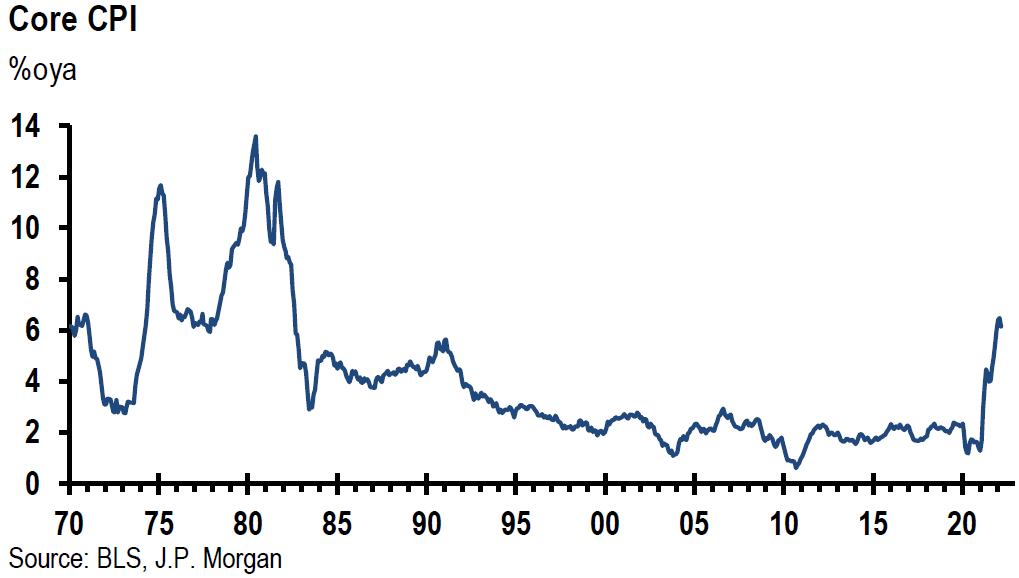
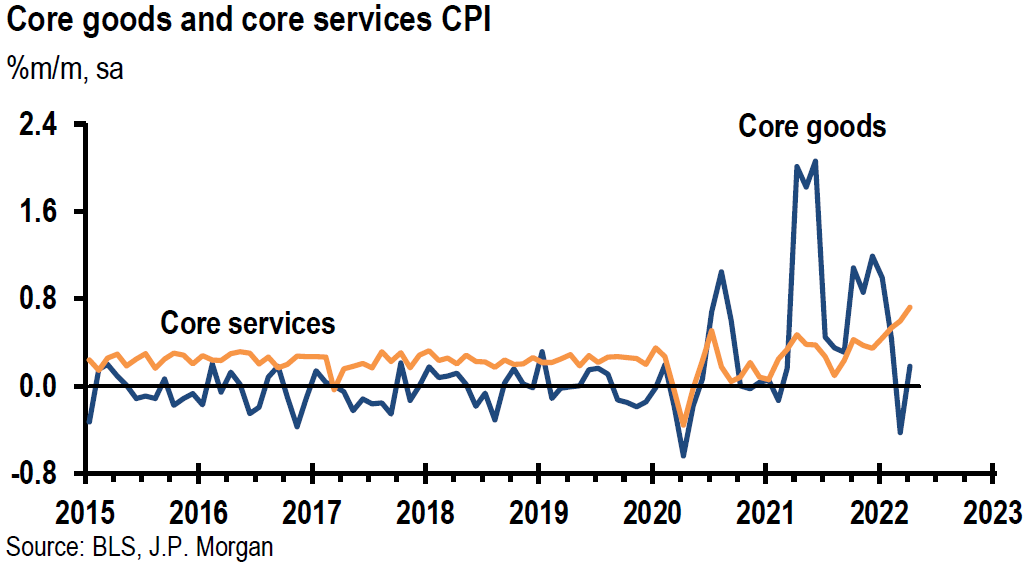
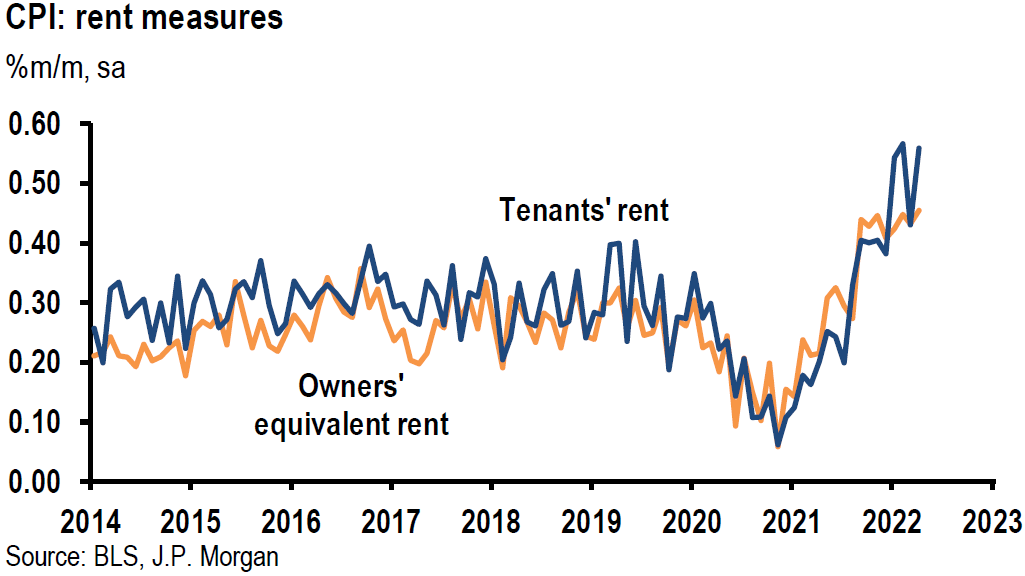
The most anticipated “macroeconomic” data of this week was the April CPI data released mid-week. Many market investors, traders and analysts were looking for any signs as to whether the rate of U.S. inflation had peaked in March and was now ready to start its descent. We thought that whether or not the rate of inflation had peaked in March was a non-issue. Our focus remained on to what extent and for how long elevated rates of inflation would persist. Despite increasing slightly more than the expected 8.1%, the headline CPI for April did in fact register a smaller year-over-increase (y/y) of 8.3% versus the 8.5% increase in March. The headline CPI on a month-over-month (m/m) basis of +0.3% also exceed expectations of +0.2%. The core CPI – which excludes food and energy – increased by 6.2% y/y versus the expectations of 6.0%. On a monthly basis, core CPI rose 0.6% versus an expected increase of 0.4%. The headline CPI m/m change was brought down by a 2.7% decrease in energy versus a monthly increase of 11.0% in March. May is on track for a monthly increase in energy prices. Core services prices were particularly strong as they increased 0.7% m/m in April, which was the largest monthly gain in this component since 1990. Additionally, an 18.6% m/m increase in airfares contributed 0.2% to this component and 0.1% to the overall core. Shelter costs, which are part of core inflation, accelerated – rent increased by 0.56% m/m and owners’ equivalent rent by 0.45%. Hotel lodging increased 1.7% m/m. Other notable changes in the core rate of inflation on a monthly basis included a decrease of 0.4% for used cars, but an increase of 1.1% for new vehicles and a 1.2% increase in auto parts. We view this CPI report as showing still a very elevated measure of the rate of inflation that the Fed will aggressively try to rein in. We remain agnostic on whether we have seen the peak in the rate of U.S. inflation.
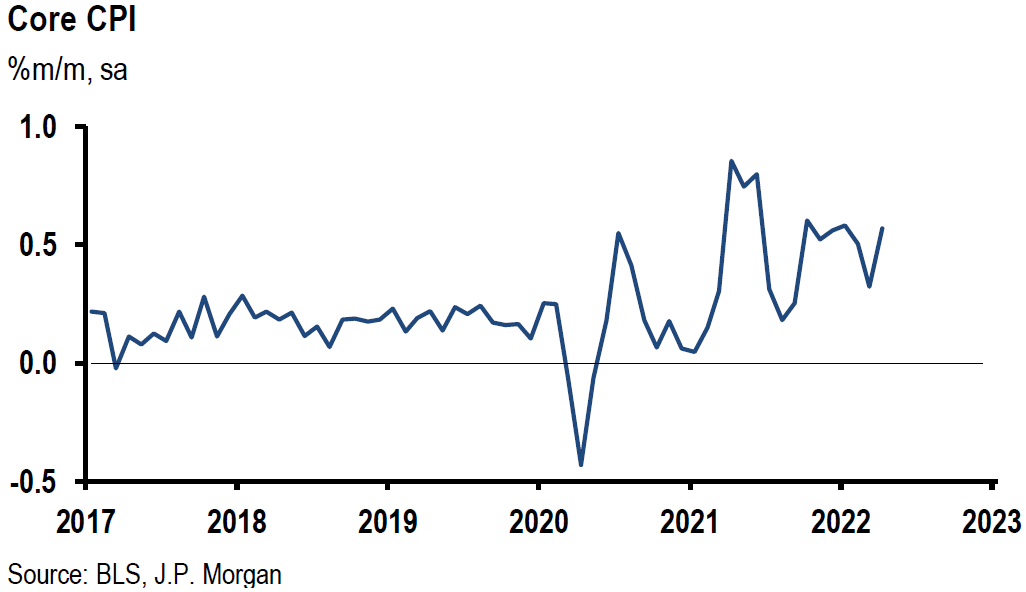
Source: J.P. Morgan, US: Another firm print for core CPI, with 0.6% April gain (5/11/22)
U.S. April PPI
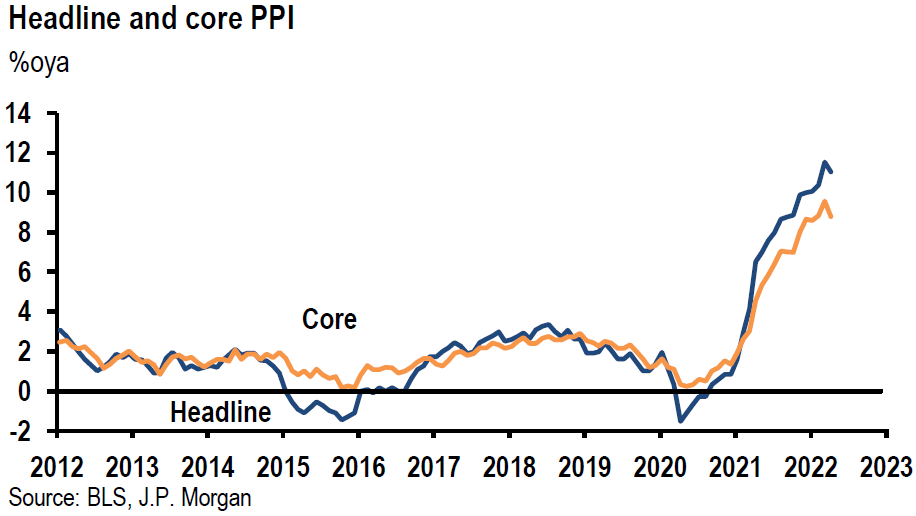
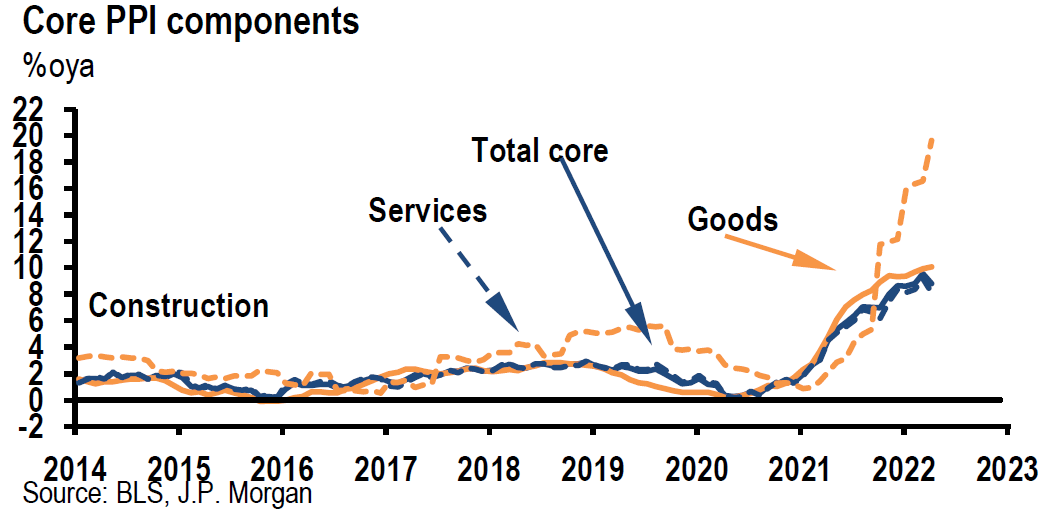
Announced on Thursday, April U.S. PPI was basically as expected. Headline PPI rose 0.5% m/m and 11.0% y/y compared to March’s increase of 11.5%. PPI excluding food and energy increased 0.4% m/m and 8.8% y/y. PPI excluding food, energy and trade services was 0.6% higher m/m in April and 6.9% y/y. We also viewed this as a strong inflation report.
Source: J.P. Morgan, US: PPI rises 0.5% in April (5/12/22)
Bottom Line
We interpret recent trading in U.S. equities to be pricing in an elevated chance of a recession in the next twelve months as more market participants appear to adopt the view that the war will likely persist for quite some time. We share the Fed’s view that decreased liquidity in financial markets will inevitably lead to increased market volatility. Greater levels of uncertainties and lower levels of conviction seem to be playing a role as well.
We assume continued volatility across virtually all financial markets for at least as long as the war persists. Furthermore, we continue to forecast higher interest rates over time as part of a volatile trajectory. We foresee that most global economic growth rates will be revised lower and that most inflation forecasts will be revised higher than previously thought due to the war and Chinese coronavirus related lockdowns. Predictable margins should become increasingly important in evaluating appropriate investments. The strength of the U.S. dollar could make forecasting even more difficult as the number of variables affecting investment decisions continues to multiply.
Our basic investment approach remains the same as expressed in our most recent commentaries. We maintain our preference for high quality stocks in a diversified portfolio with at least some commodity exposure.
Definitions:
Cboe Volatility Index (VIX) – The Cboe Volatility Index (VIX) is a real-time index that represents the market’s expectations for the relative strength of near-term price changes of the S&P 500 Index (SPX). Because it is derived from the prices of SPX index options with near-term expiration dates, it generates a 30-day forward projection of volatility.1 Volatility, or how fast prices change, is often seen as a way to gauge market sentiment, and in particular the degree of fear among market participants.
Headline Consumer Price Index (Headline CPI) – Headline inflation is the raw inflation figure reported through the Consumer Price Index (CPI) that is released monthly by the Bureau of Labor Statistics (BLS). The CPI calculates the cost to purchase a fixed basket of goods to determine how much inflation is occurring in the broad economy. The CPI uses a base year and indexes the current year’s prices, according to the base year’s values.
Core Consumer Price Index (Cor CPI) – Core inflation removes the CPI components that can exhibit large amounts of volatility from month to month, which can cause unwanted distortion to the headline figure. The most commonly removed factors are those relating to the costs of food and energy. Food prices can be affected by factors outside of those attributed to the economy, such as environmental shifts that cause issues in the growth of crops. Energy costs, such as oil production, can be affected by forces outside of traditional supply and demand, such as political dissent.
Headline Producer Price Index (Headline PPI) – The Producer Price Index (PPI) is a family of indexes that measures the average change over time in selling prices received by domestic producers of goods and services. PPIs measure price change from the perspective of the seller. The BLS separates PPI data into three main areas of classification: industry, commodity, and commodity-based final and intermediate demand
Core Producer Price Index (Core PPI) – Core PPI refers to the index of finished goods and is generally what economists refer to when the producer price index is referenced. Footwear, soap, tires, and furniture are among the items included in core PPI.
Realized Volatility – Realized Volatility, also called Historical Volatility, is a statistical measure of the dispersion of returns for a given security or market index over a given period of time. Generally, this measure is calculated by determining the average deviation from the average price of a financial instrument in the given time period.
Implied Volatility – The term implied volatility refers to a metric that captures the market’s view of the likelihood of changes in a given security’s price. Investors can use implied volatility to project future moves and supply and demand, and often employ it to price options contracts. Implied volatility isn’t the same as historical volatility (also known as realized volatility or statistical volatility), which measures past market changes and their actual results.
NFIB – The National Federation of Independent Business is an association of small business owners in the United States. It is headquartered in Nashville, Tennessee, with offices in Washington, D.C., and all 50 state capitals.
NFIB Small business Optimism Index – The National Federation of Independent Business (NFIB) Small Business Optimism Index is a composite of ten seasonally adjusted components. It provides a indication of the health of small businesses in the U.S., which account of roughly 50% of the nation’s private workforce.
Stagflation – Stagflation is characterized by slow economic growth and relatively high unemployment—or economic stagnation—which is at the same time accompanied by rising prices (i.e., inflation). Stagflation can be alternatively defined as a period of inflation combined with a decline in the gross domestic product (GDP).
Recession – A recession is a macroeconomic term that refers to a significant decline in general economic activity in a designated region. It had been typically recognized as two consecutive quarters of economic decline, as reflected by GDP in conjunction with monthly indicators such as a rise in unemployment. However, the National Bureau of Economic Research (NBER), which officially declares recessions, defines a recession as a significant decline in economic activity spread across the economy, lasting more than a few months, normally visible in real GDP, real income, employment, industrial production, and wholesale-retail sales.
IMPORTANT DISCLOSURES
The views and opinions included in these materials belong to their author and do not necessarily reflect the views and opinions of NewEdge Capital Group, LLC.
This information is general in nature and has been prepared solely for informational and educational purposes and does not constitute an offer or a recommendation to buy or sell any particular security or to adopt any specific investment strategy.
NewEdge and its affiliates do not render advice on legal, tax and/or tax accounting matters. You should consult your personal tax and/or legal advisor to learn about any potential tax or other implications that may result from acting on a particular recommendation.
The trademarks and service marks contained herein are the property of their respective owners. Unless otherwise specifically indicated, all information with respect to any third party not affiliated with NewEdge has been provided by, and is the sole responsibility of, such third party and has not been independently verified by NewEdge, its affiliates or any other independent third party. No representation is given with respect to its accuracy or completeness, and such information and opinions may change without notice.
Investing involves risk, including possible loss of principal. Past performance is no guarantee of future results.
Any forward-looking statements or forecasts are based on assumptions and actual results are expected to vary from any such statements or forecasts. No assurance can be given that investment objectives or target returns will be achieved. Future returns may be higher or lower than the estimates presented herein.
An investment cannot be made directly in an index. Indices are unmanaged and have no fees or expenses. You can obtain information about many indices online at a variety of sources including: https://www.sec.gov/fast-answers/answersindiceshtm.html or http://www.nasdaq.com/reference/index-descriptions.aspx.
All data is subject to change without notice.
© 2024 NewEdge Capital Group, LLC


