

Weekly Summary – April 17-21
Key Observations:
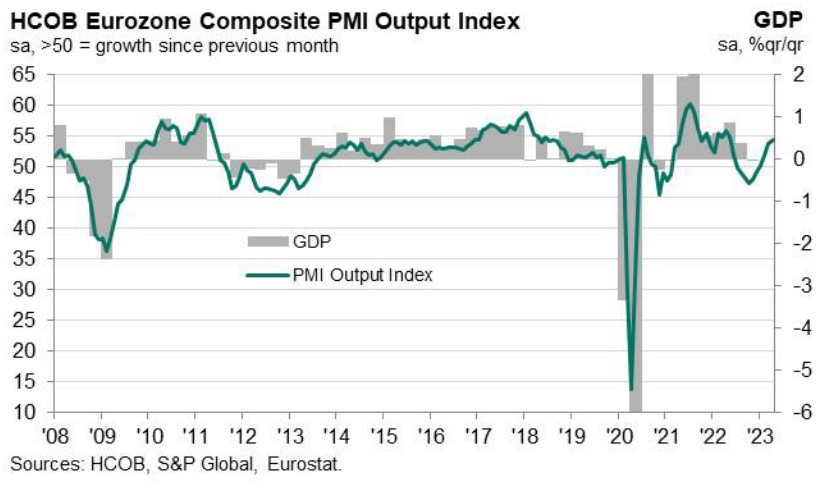
- Although we viewed most of the U.S. economic data that we analyzed this week as mixed to slightly negative in terms of economic growth and tending to a possible disinflationary trend, the overriding theme in regard to the data is one of uncertainty. Our level of uncertainty grew further with the release of preliminary April PMI data that was more robust than expected for the U.S. In contrast, the Eurozone PMIs showed a stark divergence between a robust services sector and a further shrinking manufacturing sector.
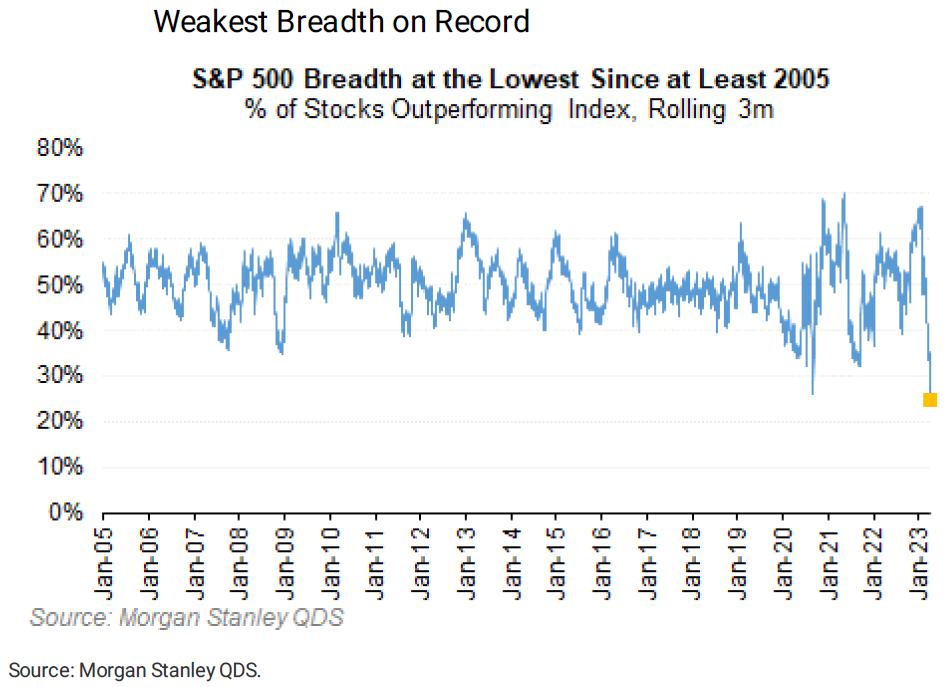
- So far, we viewed earnings announcements as not as bad as “feared.” We characterized the earnings announcements as “mixed.” We have not been surprised that U.S. stocks have shown overall stability over the past three weeks, including this week. We have been surprised somewhat by the general resiliency of U.S. stocks over this time period. But we maintain our view that a risk-reward analysis of many stocks that have outperformed greatly this year, no longer justifies “full” positions in such securities.
- It is our belief that in times of uncertainty and lack of conviction, many investors may chose to “chase” market movements. We advise against not maintaining your investment posture for long term investors. We believe that adherence to a risk-reward approach to investing could perhaps be most beneficial in times of uncertainty and conflicting economic data.
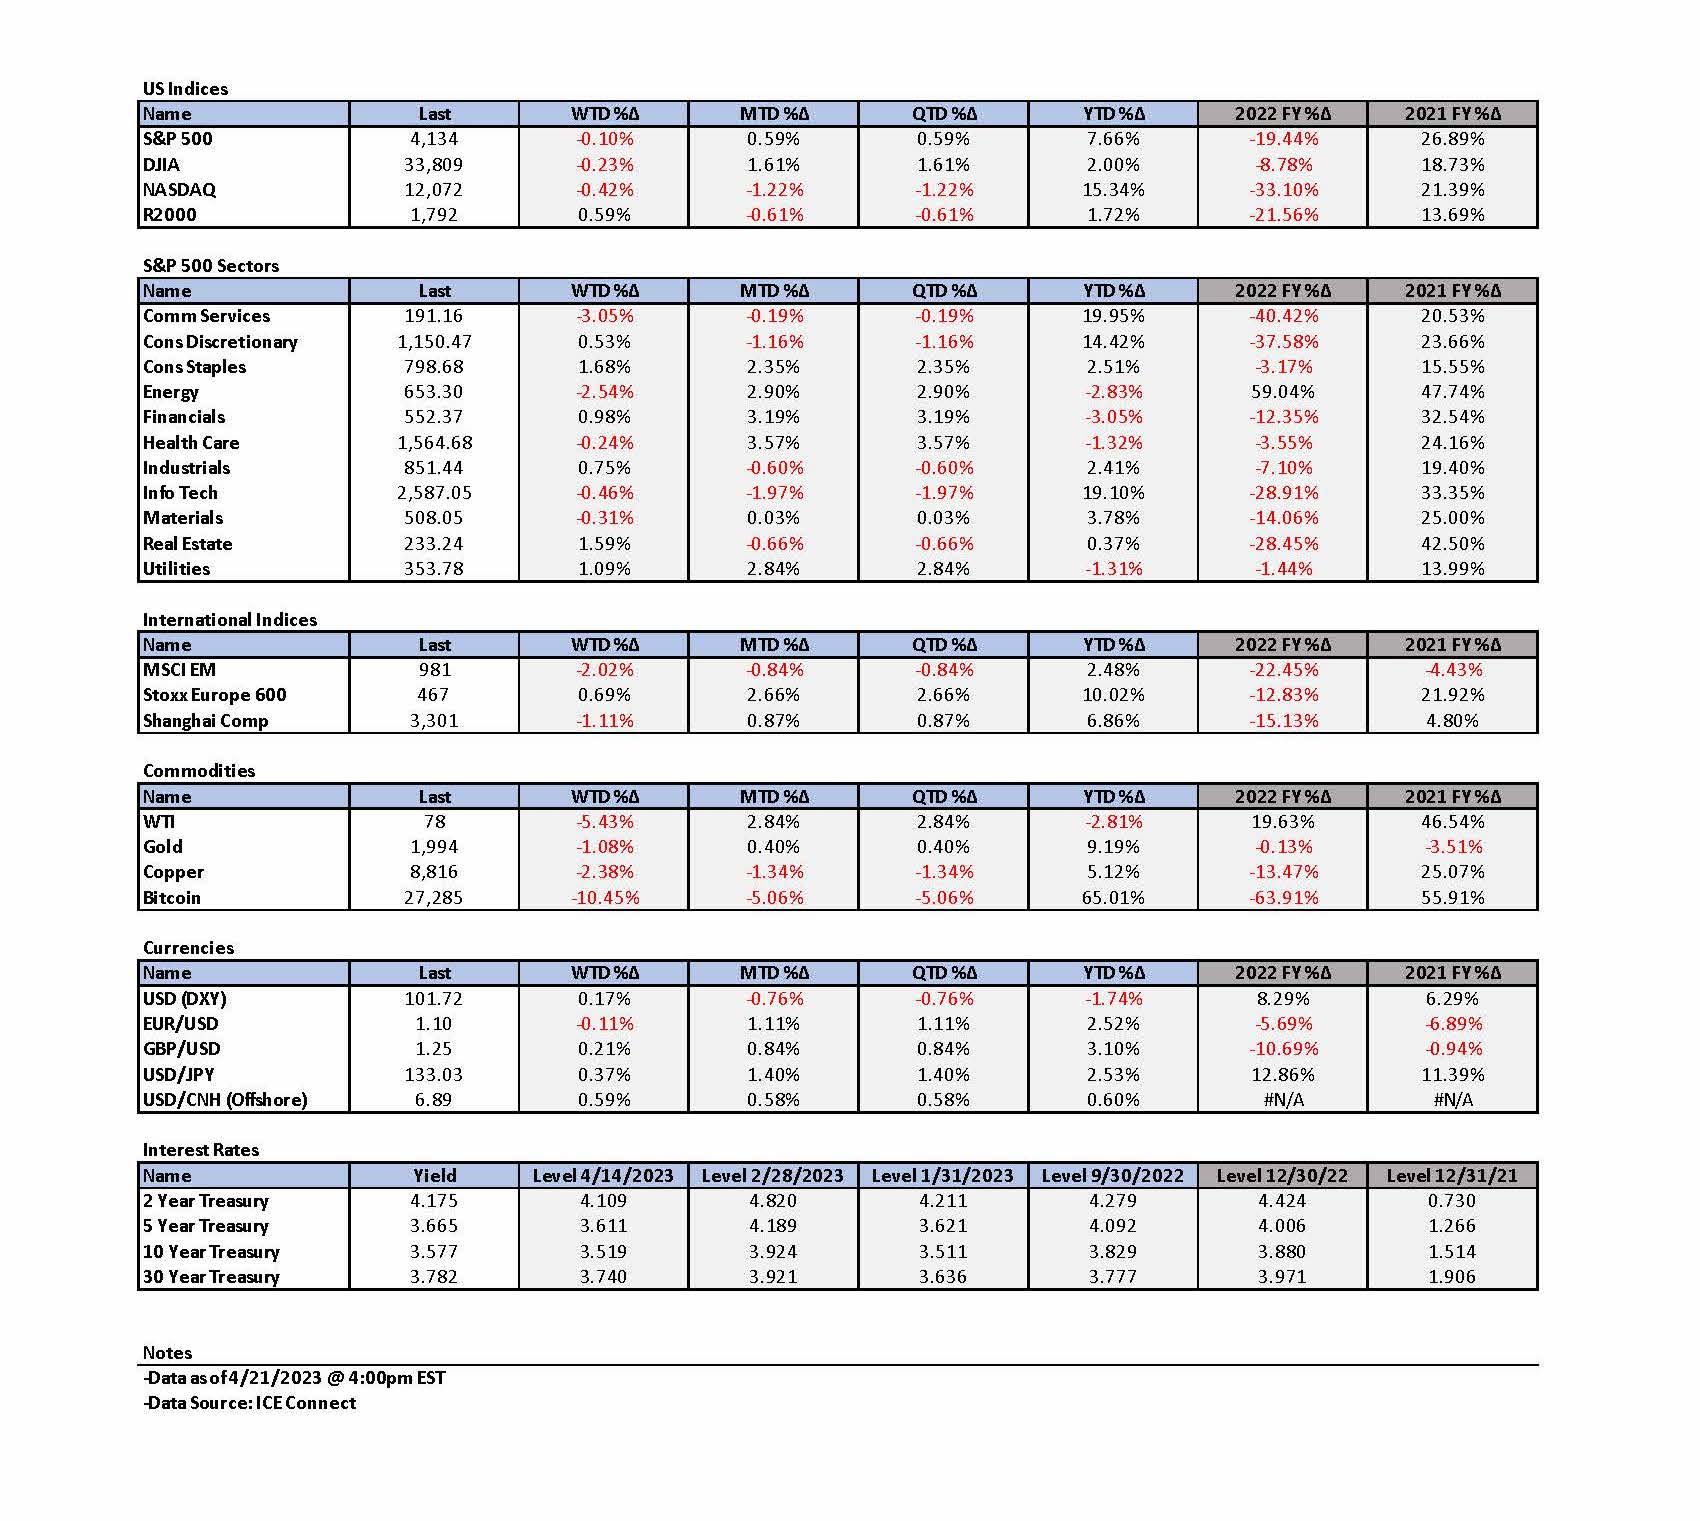
- We continue to try to assess the probability of a sudden financial market dislocation. We view the VIX at a level of roughly 17 and near the lowest level of this year as indicating investor complacency. VIX is a measure of expected one month volatility of the S&P 500. Financial markets have shown recently a proclivity to let the latest economic data be the “controlling” narrative for financial markets. This appears to be true for bond markets in particular as shown by their elevated volatility compared to recent equities’ volatility. We surmise that such an environment lends itself to a heightened risk of a market “dislocation.” One obvious potential dislocation could be the fear that Congress cannot reach a “timely” agreement in regard to the U.S. debt ceiling. We discuss below how a breach of the debt ceiling could be approaching more quickly than we thought previously.
The Upshot: our general investment approach remains the same as depicted in last week’s commentary. We maintain our preference for quality stocks with good balance sheets, relatively stable cash flows with stable margins, volatility across sectors continues to be supportive of a diversified portfolio for long term investors. We continue to stress that stock selectivity in the current environment is of paramount importance. We forecast continued financial market volatility.
We view the current “uncertain” economic environment as being reflected in the increasing divergence of opinions of Fed officials. After reviewing the totality of this week’s economic data, we maintain our stance that the Fed will raise the federal funds rate at its next meeting in early May. We believe that there could be an increased probability of a June hike as well. We assume that a decrease in the federal funds rate is even less likely now given the mixed economic data. The Fed has made it clear that they prefer to err on the side of “overtightening.”
Beige Book Indicates “Little Change” in U.S. Economy as Lending and Loan Demand Declined Generally
On Wednesday, the Federal Reserve (Fed) released its latest Beige Book about current economic conditions across the twelve Fed Districts. The Fed publishes the Beige Book eight times per year. The book is based mostly on qualitative information gathered directly from sources in each District and it aims to depict changes in economic circumstances from the last report. In general, overall economic activity was “little changed” in recent weeks and consumer spending was seen as flat to slightly lower. Manufacturing activity was “widely” reported as being flat to lower, even as supply chains “continued to improve.” It seemed that the “banking crisis” described in our recent commentaries could be beginning to affect credit conditions. “Lending volumes and loan demand generally declined across consumer and business loan types. Several Districts noted that banks tightened lending standards amid increased uncertainty and concerns about liquidity,” the Fed stated in the newly-released Beige Book. Our reaction to financial market performance this week through Thursday was in line broadly with our perception of “little change.” It was almost as if the markets were in a sort of “stall speed.” As we noted in our previous commentary, we continue to see few opportunities to invest at “compelling” entry points. We continue to sense a lack of conviction in many parts of financial markets. Although the economic data over the last few weeks appears to show a weakening economy and slowing rates of inflation, the overriding theme remains one of uncertainty. Increasing divergence of opinions among Fed officials is but one manifestation of this general feeling of uncertainty. As interest rates traded higher through Thursday this week continuing last Friday’s higher rates and as the probabilities for interest rate cuts by the Fed this year appeared to lessen, financial markets seemed to be siding more with the “hawkish” Fed officials.
U.S. Financial Markets Going “Nowhere” Recently Amid “Mixed” Earnings and Conflicting Economic Data – “Runnin’”
This week feels to us like an extension of the last two weeks, as financial markets convey the impression of going “nowhere” while many investors show signs of trying to chase the latest market movements. We find similarities to Beyonce’s song “Runnin’ (Lose It All)” as she is joined by Arrow Benjamin. Investors appear to be asking “Where else can I go? Chasin’ you … Runnin’, runnin’, runnin’, runnin’ … Ain’t runnin’ from myself no more; I’m ready to face it all … If I lose myself, I lose it all.” In our opinion, many investors “chase” market movements when they have little conviction. We observed in last week’s commentary that “uncertainties and lack of conviction appear to be playing a prominent role in ‘surprising’ market movements.” In the recent low volatility equity market, the investors who try to chase rallies with little conviction could feel like they’re “standing still.” In such market environments, “we deem it even more important to rely on a risk-reward analysis.” We recommend that long term investors do not run from their basic investment strategies, but instead be ready to face and embrace their investment philosophies so that they do not “lose” themselves.
Source: Morgan Stanley, Weekly Warm-up: Gradually, Then Suddenly (4-17-2023)
Waiting to See More Credit Contraction — Latest Economic Data “Controls” Narrative
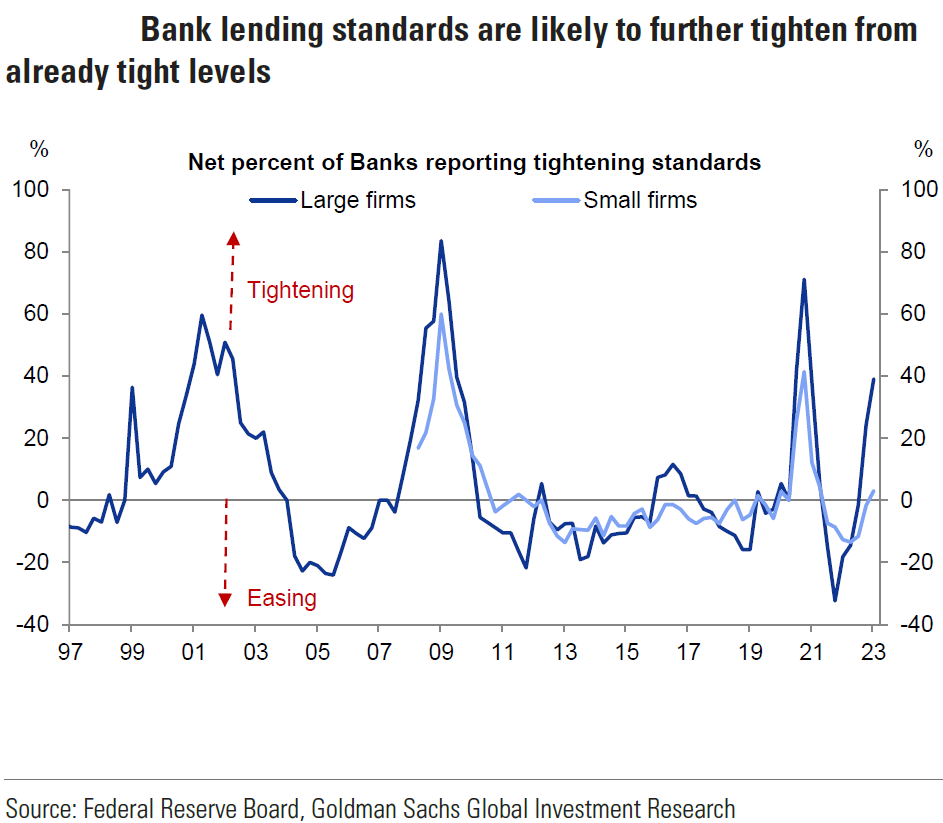
As we wait for additional evidence of credit conditions tightening further, we continued to see amid mixed economic data signs that showed mostly a weakening economy and slowing inflation. We continue to forecast that financial markets will vacillate between expecting the Fed to cut the federal funds rate later this year or increase rates further depending on how markets perceive economic growth and inflation. It seems that recently the latest economic data could be most determinative in regard to market perceptions. We maintain our view of no cuts in the federal funds rate for “some time.” On numerous occasions we have stressed that “rapidity of change” has been the hallmark of the period since the onset of the pandemic. We don’t expect gradual changes. Instead, we contemplate more sudden and abrupt changes, as we saw transpire in the most recent banking crisis. Furthermore, we foresee credit contraction becoming more restrictive. We assume uneven and unpredictable effects in terms of timing, magnitude and specifics.
Source: Goldman Sachs, Macro Credit Views: Back on track (Karoui) (4-20-2023)
Empire State April Manufacturing Survey Showed Strong Rebound
The New York Fed collected responses for the Empire State April Manufacturing Survey between April 3 and April 10. In marked contrast to the recent economic data revealing a weakening economy, the New York Empire State manufacturing survey for April showed an unexpected and surprising rebound as the headline general business conditions index increased 35 points to 10.8. This was the first New York state business activity increase in five months. New orders surged 47 points to 25.1 and shipments rose 37 points to 23.9. In spite of these sharp increases, the index for number of employees remained in negative territory for the third consecutive month. The average workweek also shrank. Input prices moderated as selling prices remained mostly static – indicating a possible improvement in profit margins. Many firms did not expect business conditions to improve over the next six months.
NAHB/Wells Fargo Housing Market Index (HMI) Increases Slightly in April – Builders Cautiously Optimistic
Builder confidence for newly built single-family homes rose one point to 45 versus an expected flat reading of 44. This was the fourth consecutive month of increases for this index and the highest level since September 2022. The chairman of the National Association of Home Builders (NAHB) attributed the increase in builder sentiment to “a lack of resale inventory despite elevated interest rates.” Readings under 50 are considered to show that the majority of builders responding to the survey see conditions as “poor.” NAHB’s chief economist noted that one-third of current housing inventory comprises newly constructed homes versus a more typical level of a “little more than 10%.” Recent data from realtor.com showed March 2023 home inventory levels nearly 60% higher than in March 2022, but still more than 50% below pre-pandemic levels. Builder optimism was also boosted by the modest drop in mortgage rates since early March. The gauge for current sales conditions rose from 49 to 51, and sales expectations for the next six months increased from 47 to 50. This was the first time since June 2022 that both of these components were at least 50. The gauge for traffic of prospective buyers remained unchanged at 31. Some building materials issues remained. The last few months of housing data shows a great sensitivity to the variability of the 30-year fixed mortgage rate.
U.S. March Housing Starts and Building Permits were Mixed
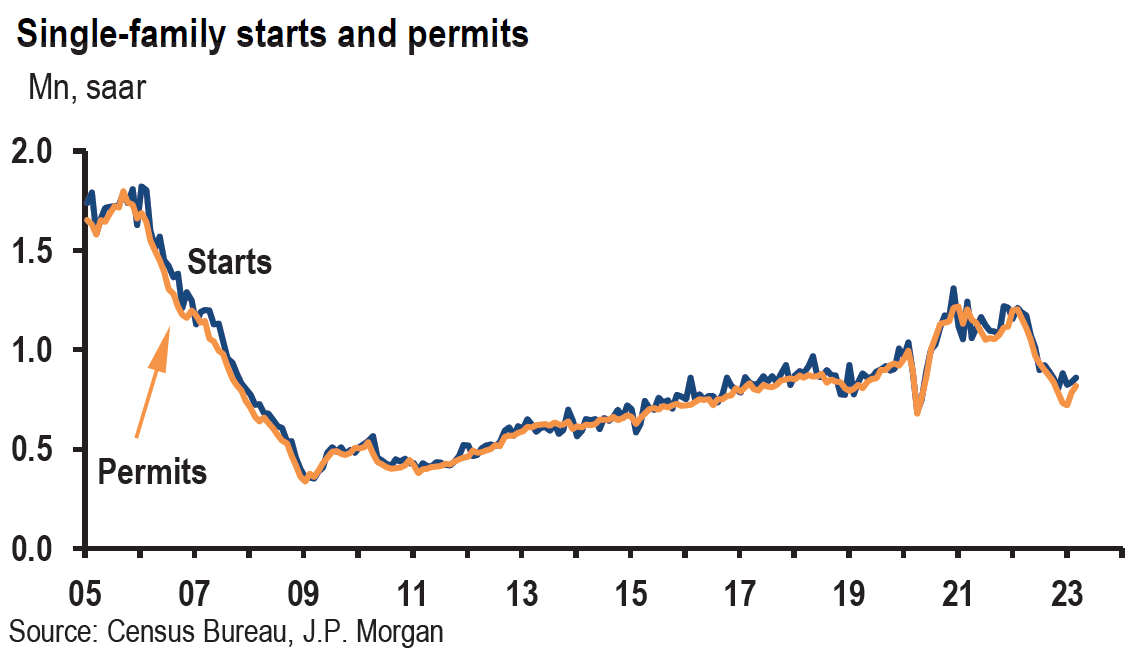
Housing starts fell 0.8% month-over-month (m/m) in March to a seasonally adjusted 1.42 million units, which exceeded slightly an expected 1.40 million units. Multifamily units – five units or more – fell 5.9% m/m as single-family starts increased 2.7%. Building permits dropped from an upwardly revised rate of 1.550 million units in February to the current rate of 1.413 million units. Single family permits rose 4.1% m/m in March versus a 22.1% plunge in multifamily units after a 23.8% surge in February. On an annual basis, housing starts were 17.2% lower and permits were down 23.2%. We view this data as tending to show some stabilization in the U.S. hosing market as mortgage rates have descended off their peak rates. A spike in mortgage rates could cause another round of destabilization.
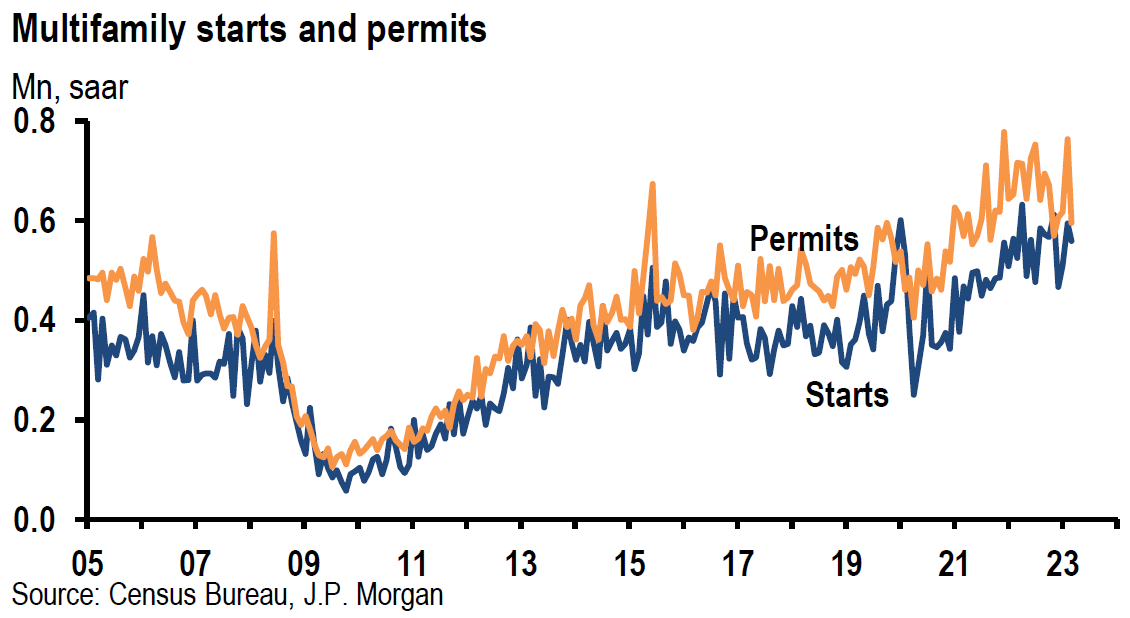
Source: JP Morgan, US: March housing starts point to further stabilization (4-18-2023)
Existing Home Sales for March Resumed Downtrend
According to the National Association of Realtors (NAR), existing home sales fell 2.4% m/m in March versus a downwardly revised gain in February of 13.8% m/m, which was the first monthly gain in one year and the biggest monthly increase since July 2020. The annualized rate of sales for March was 4.44 million units versus an expected 4.5 million. Much of the fluctuations in U.S. housing market data can be attributed to fluctuating mortgage rates. According to CNN on April 20, the rate on a 30-year fixed rate mortgage has fluctuated in the 6.09%-to-6.73% range year-to-date. Inventories of homes for sale were 980,000 at the end of March, which was 1% higher than February’s inventory levels and 5.4% higher year-over-year (y/y). At the March sales pace, it would take 2.6 months to exhaust the March inventories versus 2.0 months in February. A more “healthy” housing market with a more typical balance of supply and demand for homes would require four to seven months to deplete housing inventory levels. Median home prices were 0.9% lower y/y and 65% of homes sold in March were on the market for less than one month. The y/y price decline was the largest since January 2012. This occurred in spite of 28% of March existing home sales going for above list price. First time buyers accounted for 28% of sales versus 27% in February and 30% one year ago. All-cash sales accounted for 27% of sales in March versus 28% a year ago.
New York Fed’s April Business Leaders Survey of Service Firms in New York Area Declined
Between April 3 and 10, the New York Fed also collected survey responses for the Business Leaders Survey of Service Firms in New York Area. Services business activity declined modestly in April for the seventh consecutive month as the headline business activity index changed very little at -9.8. The nine-point decline in the business climate index to -47.7 pointed to one that is much worse than normal. Employment levels were unchanged, failing to rise for the first time in two years. Wage increases moderated “noticeably” as input and selling price increases slowed as well. Wages fell seven points in March and another nine points in April. In general, firms did not expect business conditions to improve over the next six months.
U.S. Jobless Claims Continue to Increase
Initial claims for unemployment insurance benefits increased 5,000 to 245,000 for the week that ended April 15 versus 240,000 expected. Continuing “jobless claims” increased 61,000 to 1.865 million for the week that ended April 8. This was the highest level since November 27, 2021. The latest increases in jobless claims suggest a softening the U.S. labor market.
Philadelphia Fed April Manufacturing Survey Weakens
The Philadelphia Fed collected survey responses for its manufacturing survey from April 10 to April 17. Instead of improving to an expected -19.2 reading, the manufacturing index fell further from -23.2 in March to the most recent reading of -31.3. This was the eighth consecutive negative reading for this survey and was the lowest level since May 2020. The new orders sub-component remained negative at -22.7, but improved from the -28.7 level in March. Similarly, shipments improved from -25.4 to -7.3. The employment index improved from -10.3 to -0.2. Prices paid moderated from 23.5 to 8.2 and prices received dropped from 7.9 to -3.3. Both prices paid and received fell to their lowest levels since mid-2020. Firms expect that growth over the next six months will remain “subdued.”
The Conference Board’s Leading Economic Index (LEI) Declined Further in March
After a 0.5% m/m decline in February to 109.7, the LEI declined another 1.2% to 108.4 in March. This was its lowest level since November 2020. For the six months between September 2022 and March 2023, the LEI was 4.5% lower versus a drop of 3.5% for the prior six-month period. A senior manager of Business Cycle Indicators for The Conference Board viewed these results as “consistent with worsening economic conditions ahead.” That senior manager added that “only stock prices and manufacturers’ new orders for consumer goods and materials contributed positively over the last six months. The Conference Board forecasts that economic weakness will intensify and spread more widely throughout the U.S. economy over the coming months, leading to a recession starting in mid-2023.”
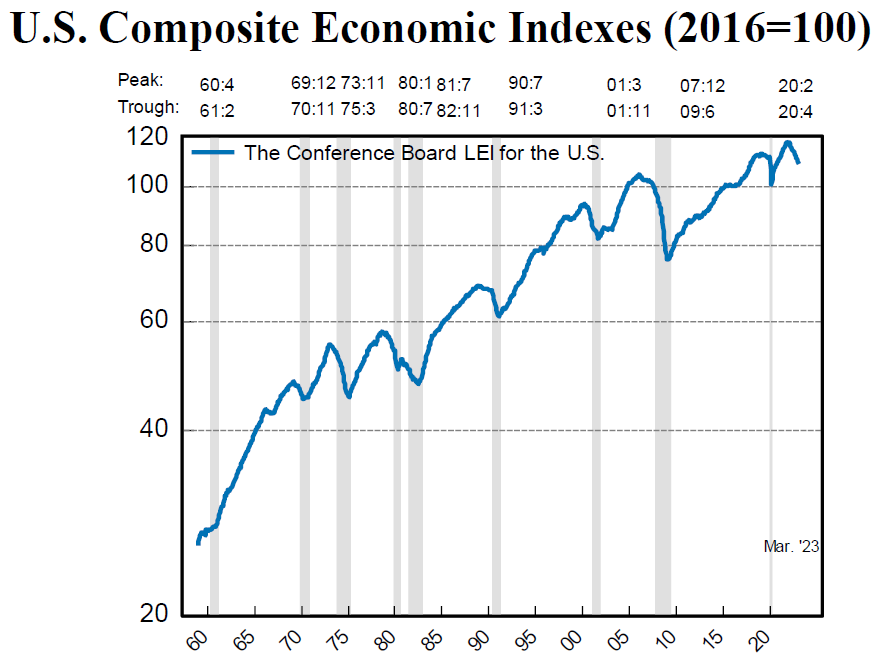
Source: The Conference Board, The Conference Board Leading Economic Index for the United States (4-20-2023)
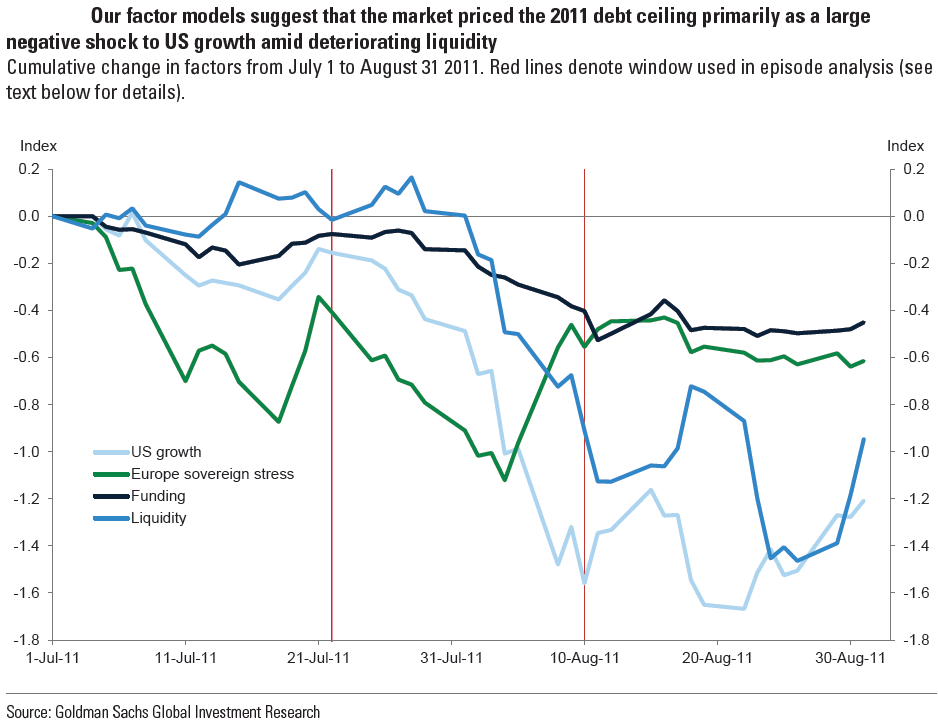
U.S. Debt Limit Could be Reached Sooner than Thought
On April 18, Goldman Sachs (Goldman) postulated that the U.S. could reach its debt limit as early as the first half of June mostly due to weak tax collections so far in April. Previously, Goldman had been predicting that the Treasury could operate without an increase in the debt limit until early August. Goldman still sees the possibility of a debt limit deadline extending into late July due to a mid-June tax deadline, as well as due to further “extraordinary measures” that become available to Treasury on June 30. A “true” June deadline would increase the chances of Congress approving a short-term extension of a debt limit. On April 20, J.P. Morgan (JPM) saw a “non-trivial risk of a technical default on U.S. Treasuries.” The general assumption is that if financial markets began to believe in the “real” possibility of no extension as the debt limit is breached, financial market volatility could increase dramatically and equities could be hit especially hard in the short term. Of course, this would shatter the market’s current malaise. We remain hopeful that this scenario still can be averted.
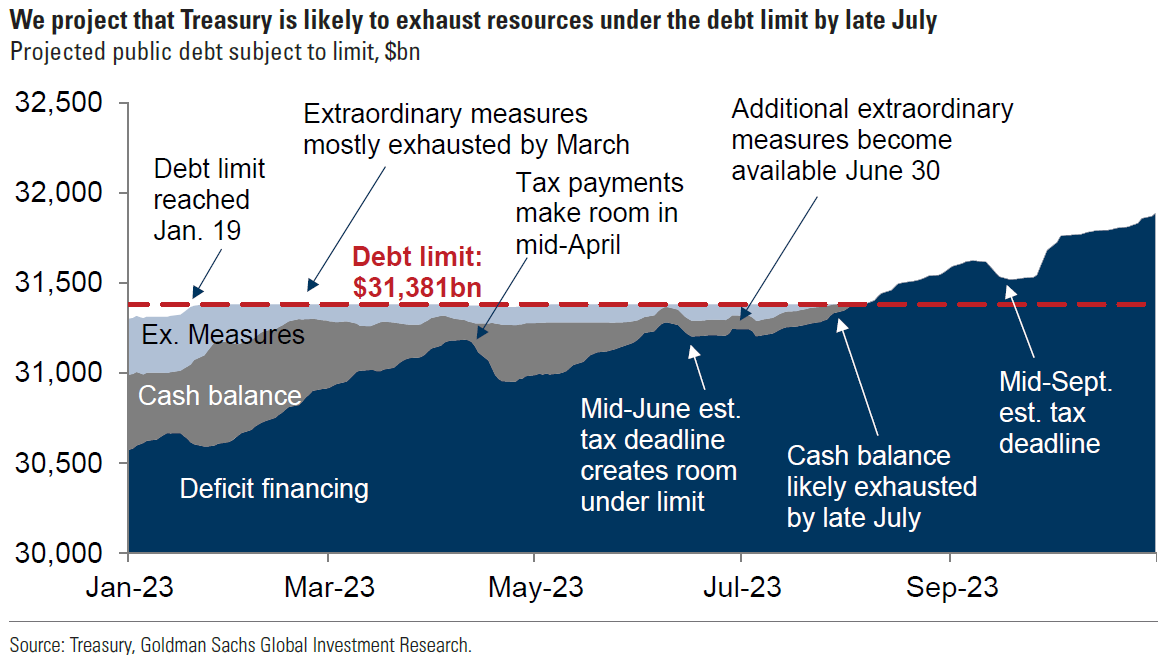
Source: Goldman Sachs, What’s Top of Mind in Macro Research: US debt limit deadline, pricing US growth concerns, tighter central banks in Europe (4-19-2023)
Source: Goldman Sachs, Global Markets Comment: Hedging the Debt Ceiling (Wilson/Chang)
China’s Q1 GDP Grew Faster than Expected as March Economic Data was More Mixed
China’s Q1 GDP grew 4.5% y/y versus an expected 4.0% and versus a 2.9% gain in Q4 2022. The fastest quarterly pace of economic growth in China in a year was driven mostly by household consumption and the services industries. Many analysts upgraded their 2023 China GDP forecasts. JPM increased their estimate to 6.4% from 6.0%, but Goldman maintained their forecast at 6.0% as they downgraded their Q2 GDP forecast. Bank of America raised its forecast to 6.3% from its previous estimate of 5.5%. Retail sales were higher by 10.6% y/y versus an expected 7.5% increase and a 3.5% gain in the January-February period. The services industry output index also showed a significant increase of 9.2% y/y in March versus a gain of 5.5% in the January-February period. Industrial production was 3.9% higher y/y in March, which was slightly less than an expected 4.4% increase. Fixed asset investment showed a solid gain but was slightly below expectations. Infrastructure and manufacturing investment growth also showed healthy gains but slowed relative to January-February growth rates. Perhaps the much higher than expected export growth in March outlined in last week’s commentary will lead to a more solid boost to China’s manufacturing sector, which could be more beneficial to commodity prices.
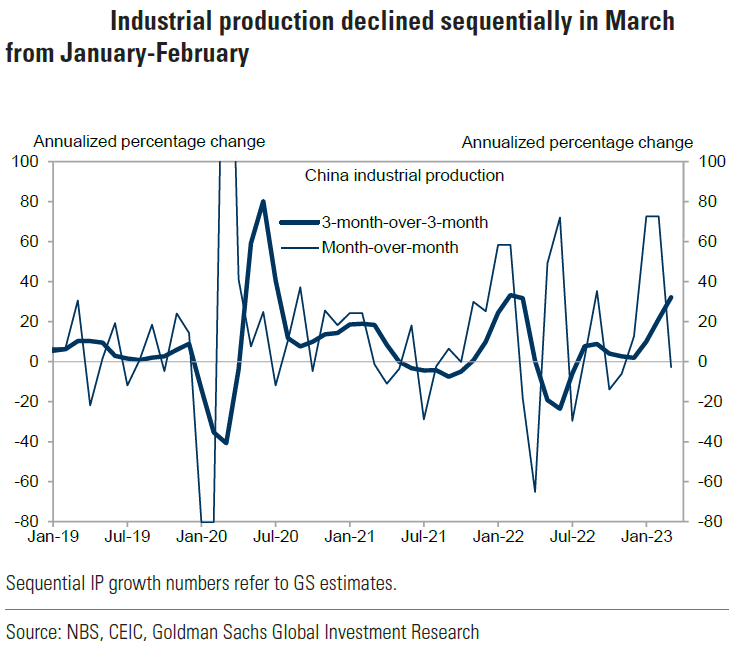
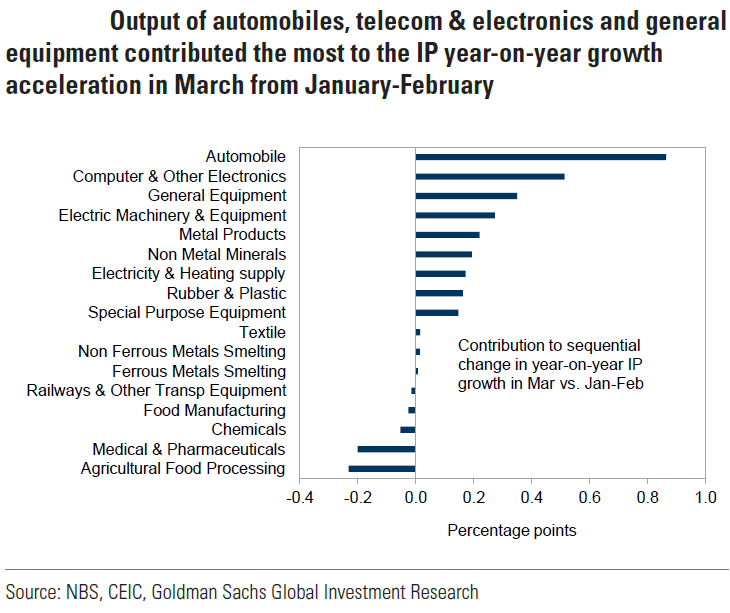
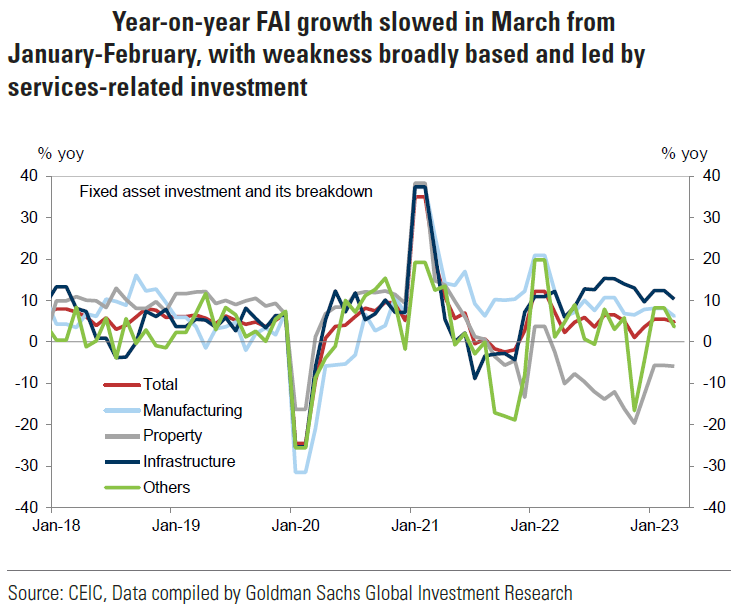
Source: Goldman Sachs, China: Q1 GDP beat expectations amid mixed March activity data (4-18-2023)
BOJ Policy Meeting Next Week
New Governor Kazuo Ueda will chair his first policy meeting at the Bank of Japan’s (BOJ) two-day meeting next week ending on April 28. According to Reuters on Friday, four sources “familiar” with BOJ’s “thinking,” the BOJ is expected to maintain its “ultra-easy” monetary policies, including its yield curve control (YCC) policy. We have discussed the YCC policy in previous commentaries. A relaxation of the YCC policy could have major implications for both currencies and interest rates. There has been much speculation as to whether Ueda will “surprise” financial markets with a change in the YCC policy at next week’s meeting. We assume that this policy will change – it is only a question of timing at this point. We look forward to BOJ’s meeting next week.
S&P Global Flash U.S. Services Purchasing Managers’ Index (PMI) Increases for April
Services PMI increased to 53.7 in April from 52.6 in March and exceeded expectations of 51.5. This was the fastest expansion in the service sector since April 2022. New business rose for the second consecutive month and was the fastest rate since last May. Improved marketing initiatives, greater domestic demand and the acquisition of new customers drove the increase even as new export orders continued to decline. But the decline of export orders was the slowest in the latest eleventh months of declines. Employment levels rose the most since last July. Both input and selling prices rose at a faster pace. Business confidence rose to the second highest level in almost in one year.
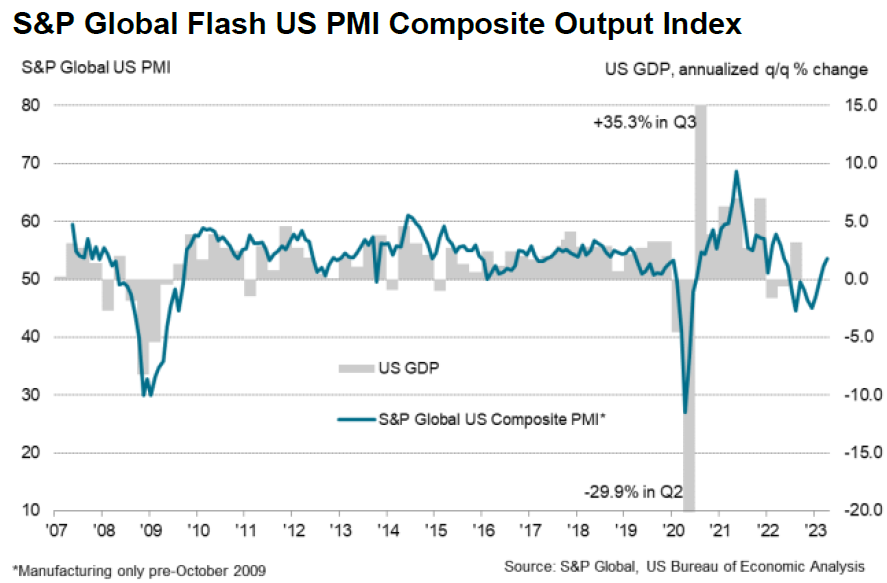
Source: S&P Global, S&P Global Flash US Composite PMI (4-21-2023)
S&P Global Flash U.S. Manufacturing PMI Increases for April
Manufacturing PMI rose to 50.4 in April into expansionary territory from 49.2 in March, exceeding expectations of 49. This was the first expansion of factory activity in six months. Production levels rose modestly in April, but the rate of increase was the fastest since May 2022. New export orders declined at a “solid” pace, which held back the overall expansion. The pace of increases in operating expenses was the “quickest” since last November. Selling prices rose at a “sharp and historically elevated rate” as they were able to partly pass on rising input costs to their customers. Input buying activity increased for the first time in nine months in response to marginal decreases in inventories and “greater” client demand. Supply chain disruptions continued to abate at the quickest rate since May 2007. The rate of job creation accelerated to the fastest since last September.
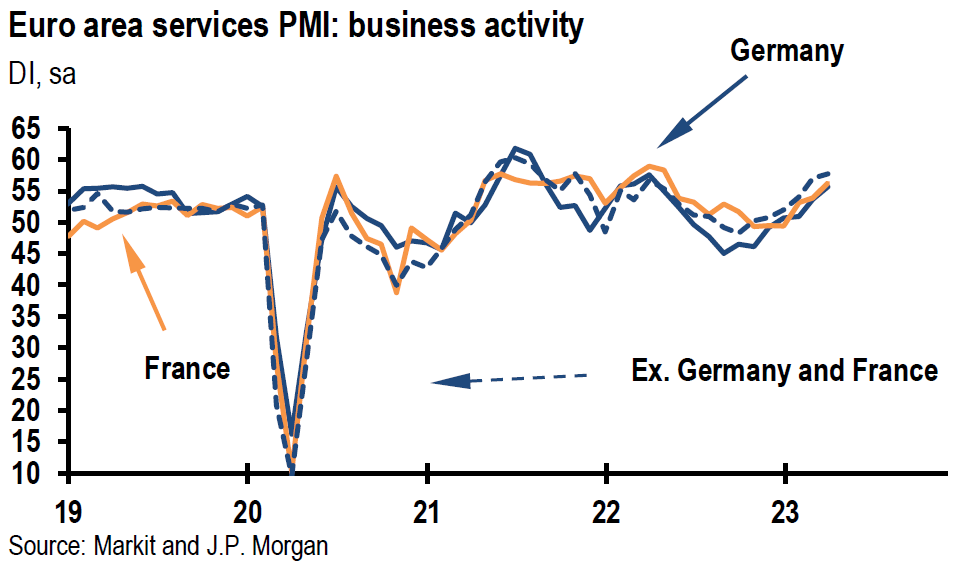
Flash Eurozone April Services PMI Increases
Services PMI rose to 56.6 from 55 in March and above expectations of 54.5. This was the strongest growth in services since last April. New orders also rose at the fastest pace since last April and job growth rose at the fastest pace since July 2007. Input costs moderated slightly to the slowest rate of increase since October 2021. And selling prices hit a 15-month low. Optimism for the next year fell slightly but was still among the highest for the past year.
Source: S&P Global, HCOB Flash Eurozone PMI (4-21-2023)
Source: JP Morgan, Euro area: Strong PMI prompts 2Q GDP upward revision (4-21-2023)
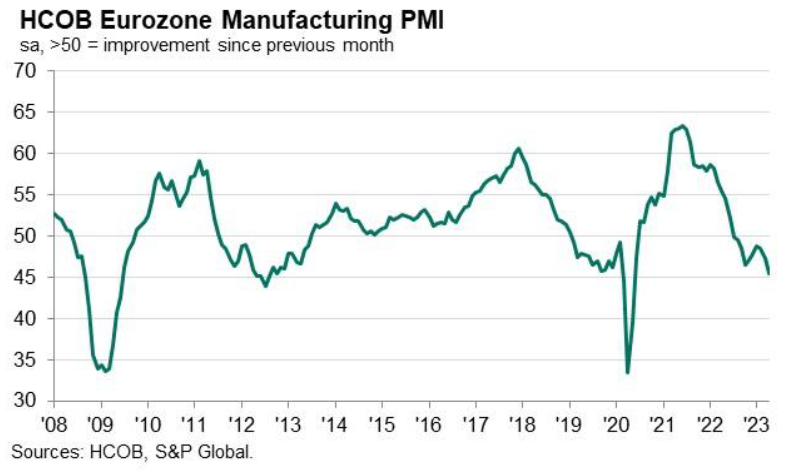
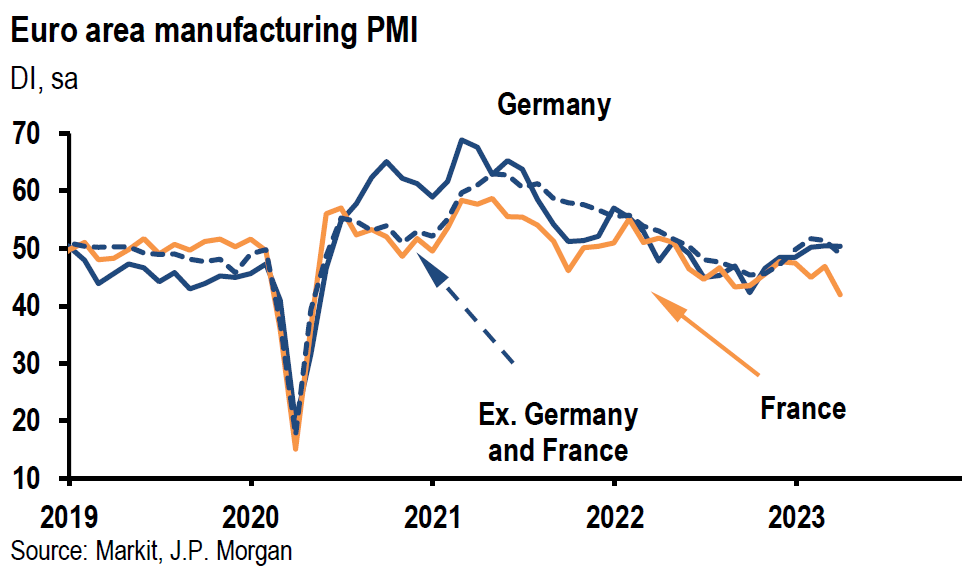
Flash Eurozone April Manufacturing PMI Falls
Manufacturing PMI fell to a four-month low of 45.5 in April from 47.3 in March and below expectations of 48. This reading reflected the biggest contraction in the manufacturing sector since May of 2020. New orders fell the most in four months and employment growth slowed to the lowest rate in 27 months. Input costs dropped for the second consecutive month and at the sharpest rate since May 2020 amid reduced energy costs. The amount of inputs purchased by manufacturers fell at the steepest rate since last November even as supplier delivery times improved for the second month. Selling prices rose modestly.
Source: S&P Global, HCOB Flash Eurozone PMI (4-21-2023)
Source: JP Morgan, Euro area: Strong PMI prompts 2Q GDP upward revision (4-21-2023)
Bottom Line
For the time being we are maintaining our basic investment approach as expressed in last week’s commentary. We continue to prefer high quality stocks that offer good balance sheets, as well as relatively stable cash flows and profit margins. We prefer a global diversified portfolio for long term investors. We continue to stress that stock selectivity in this current environment is of paramount importance. We forecast continued financial markets volatility.
We maintain our view that the Fed will hike the federal funds rate at its next meeting in early May. Given the surprisingly strong U.S. flash PMI readings for April, a June hike might become more likely if future incoming data would support those readings. We think it even less likely that the Fed would cut the federal funds rate for “some time.”
Definitions:
Federal Funds Rate – The term federal funds rate refers to the target interest rate set by the Federal Open Market Committee. This target is the rate at which commercial banks borrow and lend their excess reserves to each other overnight.
S&P 500 – The S&P 500 is a total return index that reflects both changes in the prices of stocks in the S&P 500 Index as well as the reinvestment of the dividend income from its underlying stocks.
Cboe Volatility Index (VIX) – The VIX is a real-time index that represents the market’s expectations for the relative strength of near-term price changes of the S&P 500 Index. Because it is derived from the prices of SPX index options with near-term expiration dates, it generates a 30-day forward projection of volatility. Volatility, or how fast prices change, is often seen as a way to gauge market sentiment, and in particular the degree of fear among market participants.
Composite Purchasing Managers’ Index PMI – A composite Purchasing Managers’ Index (PMI) is the weighted average of manufacturing and service sector PMIs for a given geography or economy.
Services Purchasing Managers’ Index PMI – A services Purchasing Managers’ Index (PMI) is a survey designed to better understand changing business conditions in the wider economy. Coverage includes financial services, consumer services and all other business services.
Manufacturing Purchasing Managers’ Index PMI – A manufacturing Purchasing Managers’ Index (PMI) is a survey-based economic indicator designed to provide a timely insight into changing business conditions in the goods-producing sector.
Fed’s Beige Book – The Beige Book is a qualitative review of economic conditions drawing on reports from 12 district banks. It is published eight times annually before meetings of the Federal Open Market Committee, which uses the results in its planning and decision-making processes.
The NAHB/Wells Fargo Housing Market Index (HMI) – The NAHB/Wells Fargo Housing Market Index is a monthly sentiment survey of members of the National Association of Home Builders. The index measures sentiment among builders of U.S. single-family homes and is a widely watched gauge of the U.S. housing sector.
Federal Reserve Districts – The Federal Reserve officially identifies Districts by number and Reserve Bank city. There are twelve in total, one for each of the twelve Federal Reserve Districts that were created by the Federal Reserve Act of 1913.
US Debt Ceiling – The debt ceiling is the maximum amount that the U.S. government can borrow by issuing bonds. The Treasury Department must find other ways to pay expenses when the debt ceiling is reached otherwise, there is a risk the U.S. will default on its debt.
Conference Board – The Conference Board (CB) is a not-for-profit research organization that distributes vital economic information to its peer-to-peer business members.
Leading Economic Indicators Conference Board – The components of The Conference Board Leading Economic Index for the U.S. include:
- Average weekly hours in manufacturing – The average hours worked per week by production workers in manufacturing industries tend to lead the business cycle because employers usually adjust work hours before increasing or decreasing their workforce.
- Average weekly initial claims for unemployment insurance – The number of new claims filed for unemployment insurance are typically more sensitive than either total employment or unemployment to overall business conditions, and this series tends to lead the business cycle.
- Manufacturers’ new orders for consumer goods and materials – These goods are primarily used by consumers. The inflation-adjusted value of new orders leads actual production because new orders directly affect the level of both unfilled orders and inventories that firms monitor when making production decisions.
- ISM Index of New Orders – This index reflects the levels of new orders from customers. As a diffusion index, its value reflects the number of participants reporting increased orders during the previous month compared to the number reporting decreased orders, and this series tends to lead the business cycle.
- Manufacturers’ new orders for nondefense capital goods excluding aircraft orders – This index, combing with orders from aircraft (in inflation-adjusted dollars) are the producers’ counterpart to consumer goods and materials.
- Building permits for new private housing units – The number of residential building permits issued is an indicator of construction activity, which typically leads most other types of economic production.
- S&P 500 Index of Stock Prices – The Standard & Poor’s 500 stock index reflects the price movements of a broad selection of common stocks traded on the New York Stock Exchange.
- Leading Credit Index – This index is consisted of six financial indicators: 2-years Swap Spread (real time), LIBOR 3 month less 3 month Treasury-Bill yield spread (real time), Debit balances at margin account at broker dealer (monthly), AAII Investors Sentiment Bullish (%) less Bearish (%) (weekly), and Senior Loan Officers C&I loan survey
- Interest rate spread (10-year Treasury bonds less federal funds rate) – The spread or difference between long and short rates is often called the yield curve.
- Average consumer expectations for business condition – This index reflects changes in consumer attitudes concerning future economic conditions.
IMPORTANT DISCLOSURES
The views and opinions included in these materials belong to their author and do not necessarily reflect the views and opinions of NewEdge Capital Group, LLC.
This information is general in nature and has been prepared solely for informational and educational purposes and does not constitute an offer or a recommendation to buy or sell any particular security or to adopt any specific investment strategy.
NewEdge and its affiliates do not render advice on legal, tax and/or tax accounting matters. You should consult your personal tax and/or legal advisor to learn about any potential tax or other implications that may result from acting on a particular recommendation.
The trademarks and service marks contained herein are the property of their respective owners. Unless otherwise specifically indicated, all information with respect to any third party not affiliated with NewEdge has been provided by, and is the sole responsibility of, such third party and has not been independently verified by NewEdge, its affiliates or any other independent third party. No representation is given with respect to its accuracy or completeness, and such information and opinions may change without notice.
Investing involves risk, including possible loss of principal. Past performance is no guarantee of future results.
Any forward-looking statements or forecasts are based on assumptions and actual results are expected to vary from any such statements or forecasts. No assurance can be given that investment objectives or target returns will be achieved. Future returns may be higher or lower than the estimates presented herein.
An investment cannot be made directly in an index. Indices are unmanaged and have no fees or expenses. You can obtain information about many indices online at a variety of sources including: https://www.sec.gov/fast-answers/answersindiceshtm.html or http://www.nasdaq.com/reference/index-descriptions.aspx.
All data is subject to change without notice.
© 2024 NewEdge Capital Group, LLC


