

Weekly Summary: March 28 – April 1, 2022
Key Observations:
- The Russia-Ukraine war (war), along with inflation concerns continues as the predominant focus of financial markets. Markets appear particularly sensitive to Russian “rhetoric.”
- As uncertainties intensify, long-term investors could increase their preference toward diversified portfolios that includes equities and exposure to commodities. Currently, the U.S. economy appears robust but confidence may be waning for future business activity mostly due to inflation and war-related issues.
- U.S. Personal Consumption Expenditure (PCE) Index of inflation hit decade highs on a year-on-year basis. This is the Fed’s preferred measure of inflation. Headline Consumer Price Indexes (CPI) in some European countries hit multi-decade highs as energy and food inflation measures accelerated. Inflation concerns are the same in any language and they often hurt consumer sentiment.
- Treasury yield curve inversions are often good predictors of recessions. The onset of recessions after an “inversion” can differ greatly. Equities may peak typically about one year after an inversion. Current circumstances differ from many preceding yield curve inversions.
The Upshot: Our basic approach remains constant. Many long-term investors could strive to maintain a diversified portfolio of high-quality stocks of companies that have strong balance sheets, somewhat predictable cash flows and an ability to maintain strong profit margins. Additionally, these portfolios could include at least some exposure to commodities. We remain cognizant of the war’s unknown risk and possible further downside to markets at any time. But we will try to take advantage of the very large securities price movements caused by uncertainty and volatility. Our last such recommendation, understanding that recommendations involve risks and uncertainties, occurred on March 15. We strongly recommended that investors should buy at the opening of equity markets that day. After substantial gains from March 15, we forecasted that markets would take a “pause” after the close of Tuesday, March 29. In general, we thought that there would be better entry points to buy selected stocks if we showed some patience. We will be mindful of the possibility that some of the equity weakness and fixed income strength – lower yields – over the last two days of March was due to re-positioning in equity and fixed income positions at month-end and quarter-end. According to J.P. Morgan (JPM) on March 31, April is “seasonally” the strongest month of the year with average returns of 2.4% and a median return of 1.4%. April has been positive for the last nine years and for 16 of the last 21 years. We still anticipate higher interest rates this year. Furthermore, we trust that volatility will continue to characterize equity, fixed income, commodity and currency markets this year.
Source: Goldman Sachs, Global Strategy Views: Why equities are performing so well… and what to do now? (3/31/22)
Russian Rhetoric Affects Financial Markets
The sentiment expressed in Sting’s song “Russians” released in 1985 seems particularly relevant to the war. We remain hopeful that somehow “common sense” will take hold of Vladimir Putin, the president of Russia, so that he will order the Russian military to withdraw from Ukraine. After all: “We share the same biology, regardless of ideology; Believe me when I say to you; I hope the Russians love their children too.” In the meantime, we seem “Conditioned to respond to all the threats; In the rhetorical speeches of the Soviets [Russians].” It has been difficult to watch much of Ukraine’s population displaced, wounded and killed – especially children. Most financial markets appear to be fixated on the war, troop movements and “rhetoric” emanating mostly from the Russians. Major U.S. equity indexes had their largest gains of the week on Tuesday, March 29 when very positive rhetoric was emanating from the “peace talks” between Ukraine and Russia. Commodities were mostly lower that day. Deputy Defense Minister Alexander Fomin said that to increase mutual trust and aid negotiations, a “decision was made to reduce military activity in the Kyiv [Ukraine’s capital] and Chernihiv areas.” The Russian delegation further characterized the talks as “constructive.” Much of the financial market reaction was reversed the following day when Bloomberg reported on March 30 that Russia sees “no breakthrough” in the peace talks and that the Russian pullback from Kyiv “is likely to be limited and tactical.” Even though skepticism appears to accompany every “positive” Russian statement about the war, financial markets continue to trade on relative optimism about the war. We surmise that this inclination is based on the assumption that “common sense” will eventually end this war.
Need for Diversified Portfolios Increases along with Uncertainties
In the meantime, investors might consider diversified portfolios that include equities and commodity exposures for the long term. This could be helpful to be able to withstand relatively the various possible outcomes and the timing of the war’s end while factoring in many other variables, such as inflation, stagflation and recession risks. All these factors are interrelated very much at present. We continue to evaluate possible investments on a risk/reward basis. We considered stocks in all sectors as possibilities for inclusion in diversified portfolios at least from when the war began on February 24. However, we wish to stress again that this does not mean that every sector would be represented in a diversified portfolio. We continue to keep an open mind and consider ourselves to be data dependent. But our present assumptions include higher and more persistent inflation, higher interest rates, higher commodity prices, higher probabilities of economic slowdowns and even higher inflation to the extent that the war persists. In general, this week’s economic data showed a continuation of a robust U.S. economy, characterized by elevated inflation and wages. However, many surveys seem increasingly prone to show less optimism about future economic activity – usually six months out — due to concerns about inflation and the war.
Source: Goldman Sachs, Global Strategy Views: Why equities are performing so well… and what to do now? (3/31/22)
Current Business Activity Diverging from Expected Activity
Perhaps the best survey which illustrated the divergence between consumers’ confidence and assessment of current and future business conditions was the U.S. Conference Board’s Consumer Confidence Index. From its downwardly revised February reading of 105.7, consumers’ view of present business and labor situations rose more than expected to 107.2. This suggested to us that solid job growth was still able to offset inflation concerns. But the expectations index that shows consumers’ six month outlook dropped from 80.8 in February to 76.6, which was the lowest level since 2014. Consumers’ concerns appeared to be intensifying in March as consumers expected prices to rise by 7.9% over the next year. This was an all-time high for this survey. Additionally, there were other worrying signs for future business activity. These signs included the number of consumers expecting to buy a new car in the near future, which dropped to 9.3% from 10.7% in the prior month. Additionally, measures of home buying conditions held at the lowest levels since November as 30-year fixed rate mortgage rates hit a three-year high. In observing these trends, Lynn Franco, senior director of economic indicators at the Conference Board stated: “These headwinds are expected to persist in the short term and may potentially dampen confidence as well as cool spending further in the months ahead.”
Robust U.S. Economy but Uncertainty Rising
Both the March manufacturing and non-manufacturing surveys of the Federal Reserve Bank of Dallas showed similar tendencies. Texas manufacturing continued to expand but at a somewhat reduced pace. The new orders index decreased from 23.1 to 10.5 in March, which was its lowest reading in more than a year. Prices and wages continued to increase strongly in March, with wages and benefits hitting record highs. Texas manufacturing firms were evenly split as to whether future business conditions would be better or worse in six months. The Texas non-manufacturing sector continued to expand at a healthy pace in March. Although perceptions of broader business conditions remained positive overall, they were more muted than in February. The future uncertainty index rose dramatically from 7.6 to 22.5 – highest since 2020. The downturn in March retail sales in Texas was accompanied by Texas retailers’ perceptions of broader business conditions turning pessimistic in March. The March composite Chicago Purchasing Managers’ Index (PMI) – which combines manufacturing and services sectors – substantially exceeded expectations as it reached a level of 62.90. The February reading of 56.3 was the lowest since August 2020. The Chicago PMI has been especially volatile lately. The strong March ADP employment report showed a roughly in-line increase of 455,000 in U.S. nonfarm private sector employment, which confirmed our view that the U.S. economy continues to grow at a robust rate. Yet another indication of a tight labor market was that continuing unemployment claims as a percent of workers covered by unemployment insurance fell below 1% for the first time on record.
U.S. Bureau of Labor Statistics (BLS) Total Nonfarm Payroll Employment Report
The March BLS employment report was released on Friday. Although the March increase in jobs of 431,000 was below consensus of roughly 500,000, it was relatively close to the ADP figure. The unemployment rate dropped more than expected to 3.6%, down 0.2% from February. Job gains were also revised higher for February and January for a combined total increase of 95,000. We viewed this jobs report as very strong, especially given the gain in average hourly earnings of 5.6% y/y. Employment in the leisure and hospitality sector once again led job gains with an increase of 112,000, which was closely followed by job gains of 102,000 in professional and business services. The labor force participation rate of 62.4% was little changed in March. This rate remains well below the 63.4% rate of February 2020. We maintain our conviction that the Fed will raise the federal funds rate by 50 bps at its May meeting. The 2-10 year Treasury yield curve inverted slightly after this release.
U.S. PCE Inflation at Multi-Decade Highs
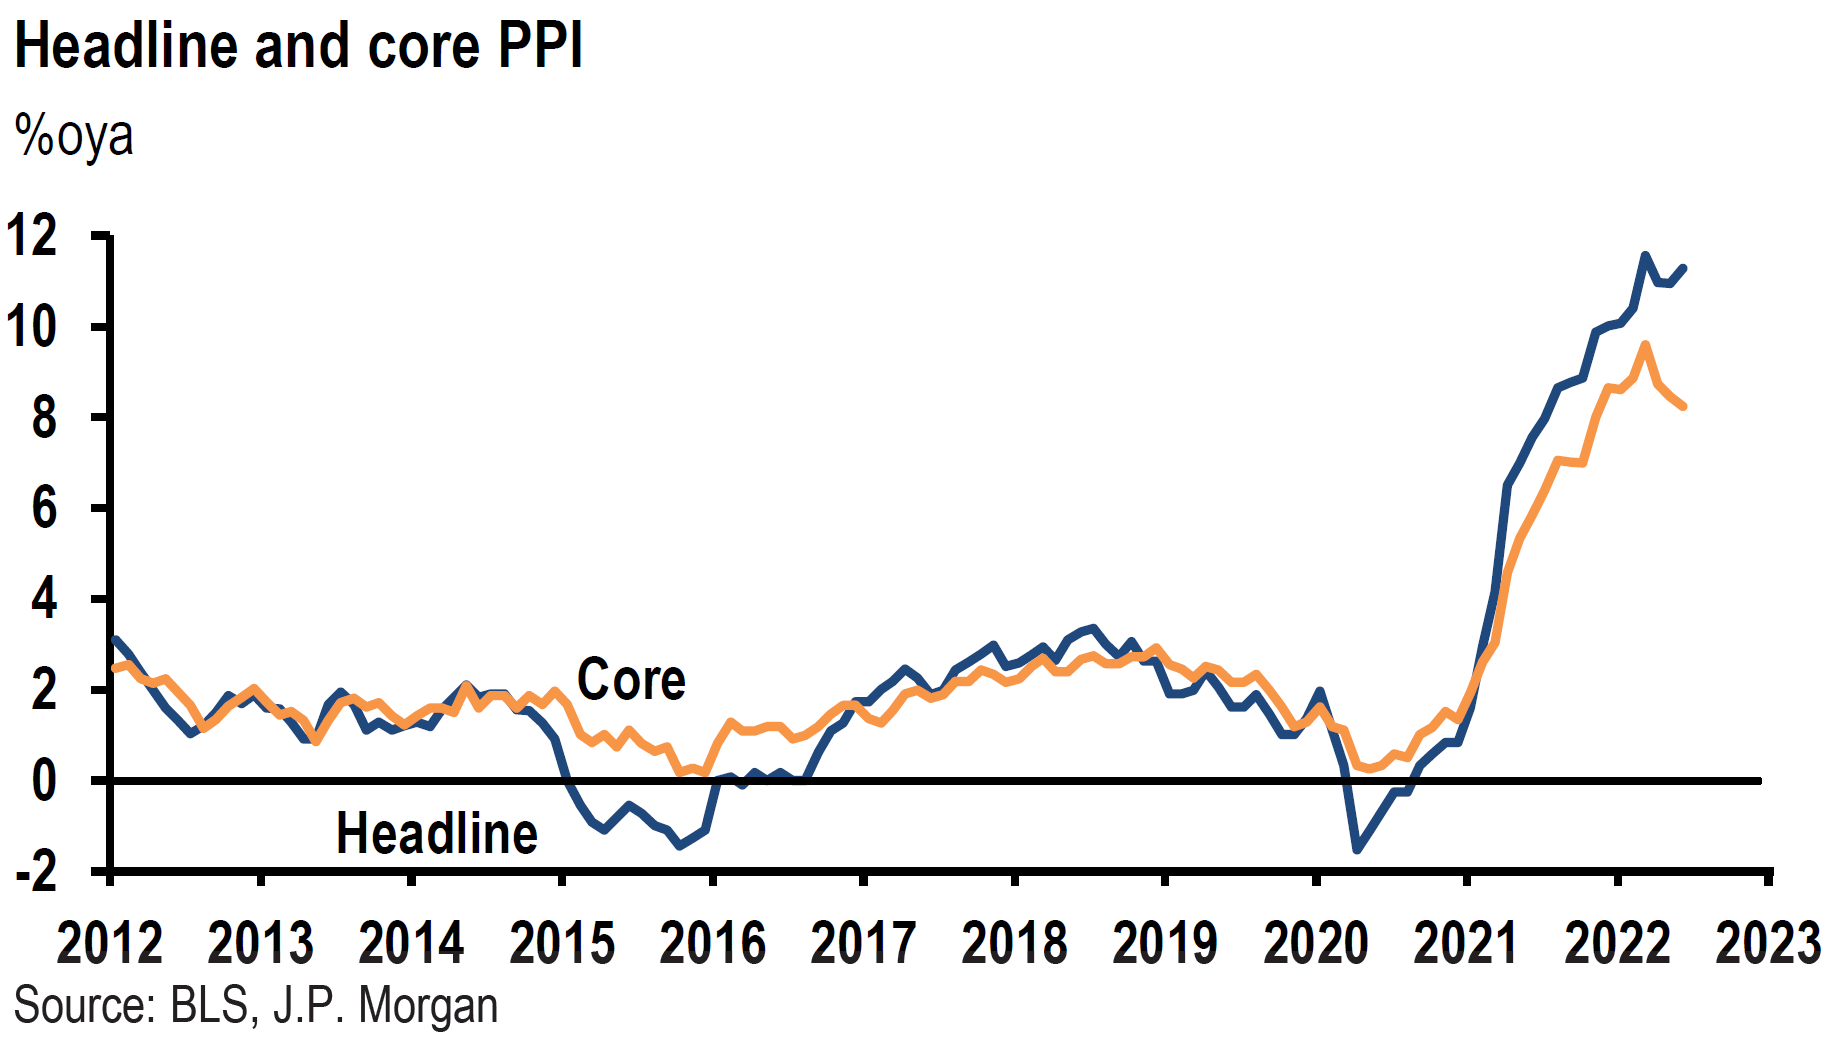
The final U.S. real Q4 2021 GDP released this week was revised down to 6.9% from 7.0%. We considered the underlying composition of these revisions to be weak as the revised lower consumer expenditures were offset by a faster pace on inventory investment. Considered as the Fed’s preferred measure of inflation, the PCE price index was released this week as well. The headline PCE price index was +0.6% month-over-month (m/m) in February and +6.4% year-over-year (y/y) – highest since February 1982. Energy prices rose 25.7% y/y and food prices increased 8.0% y/y. The core PCE – excluding food and energy – rose 0.4% m/m and 5.4% y/y. Although the core y/y PCE inflation rate was the highest since April 1983, the m/m increase was the lowest in five months.
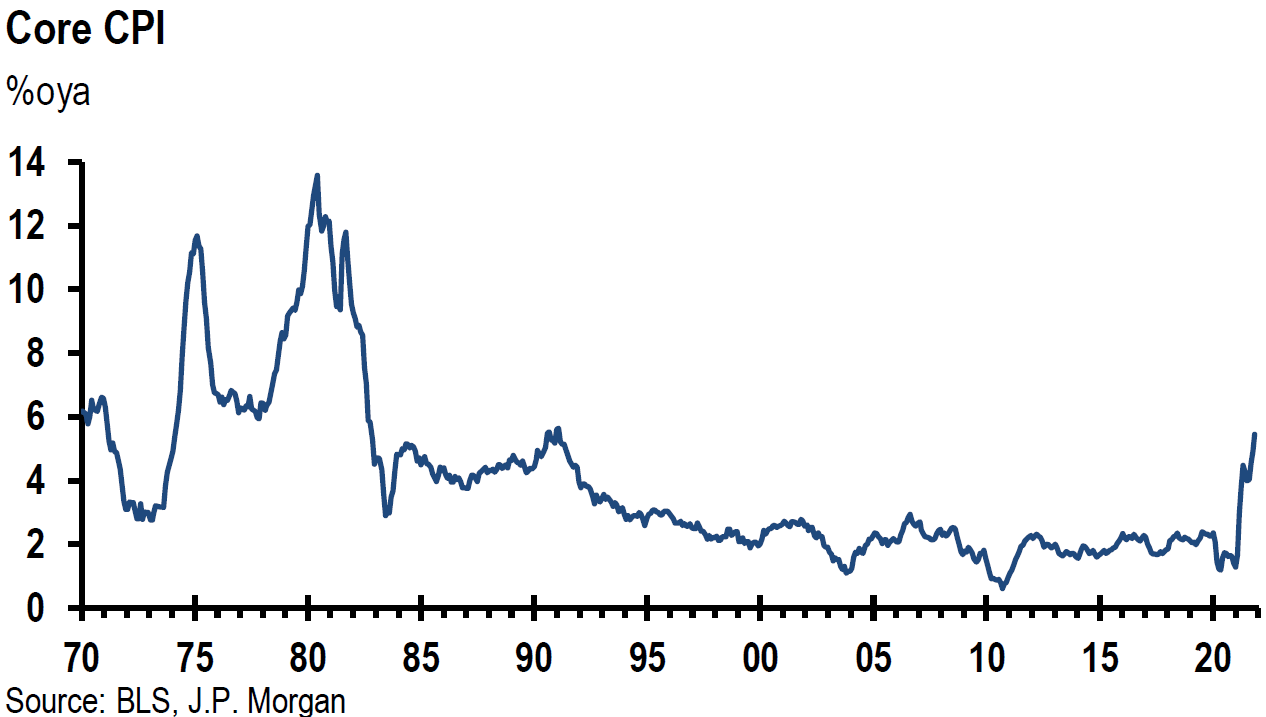
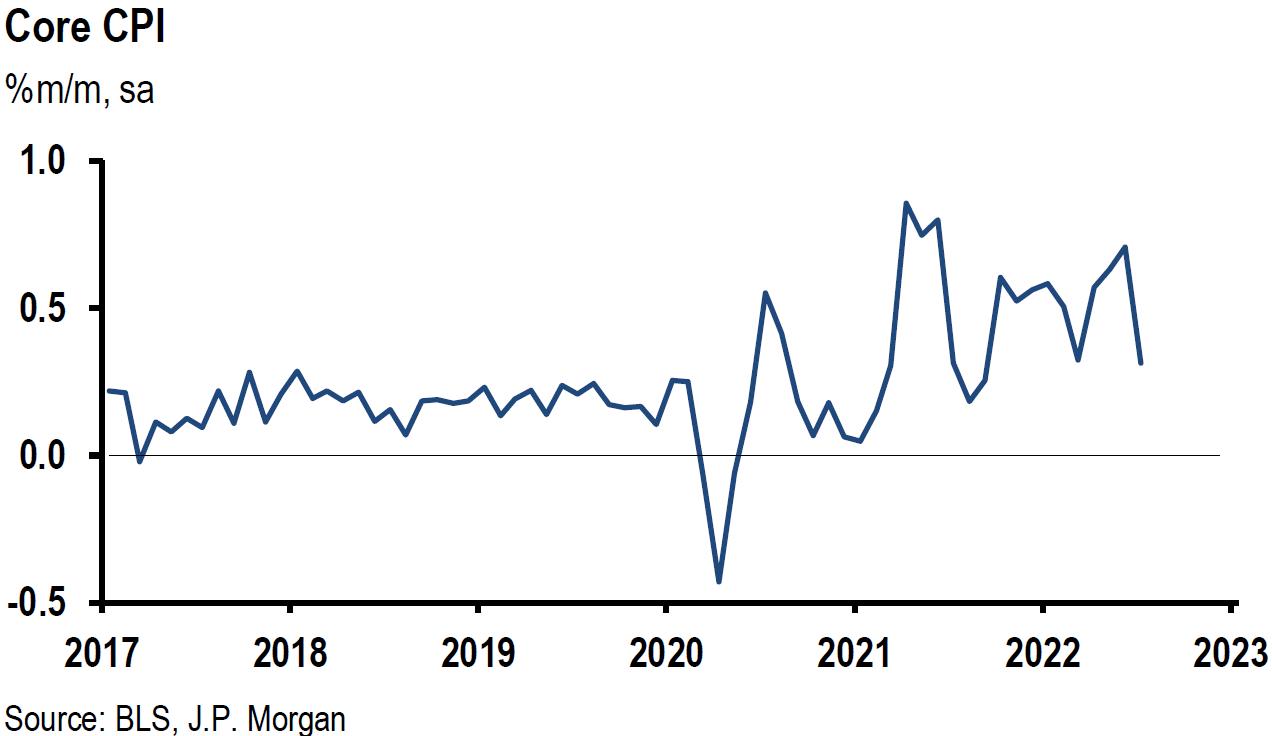
Source: J.P. Morgan, US: PCE price index now up 6.4% oya, with core up 5.4% oya (3/31/22)
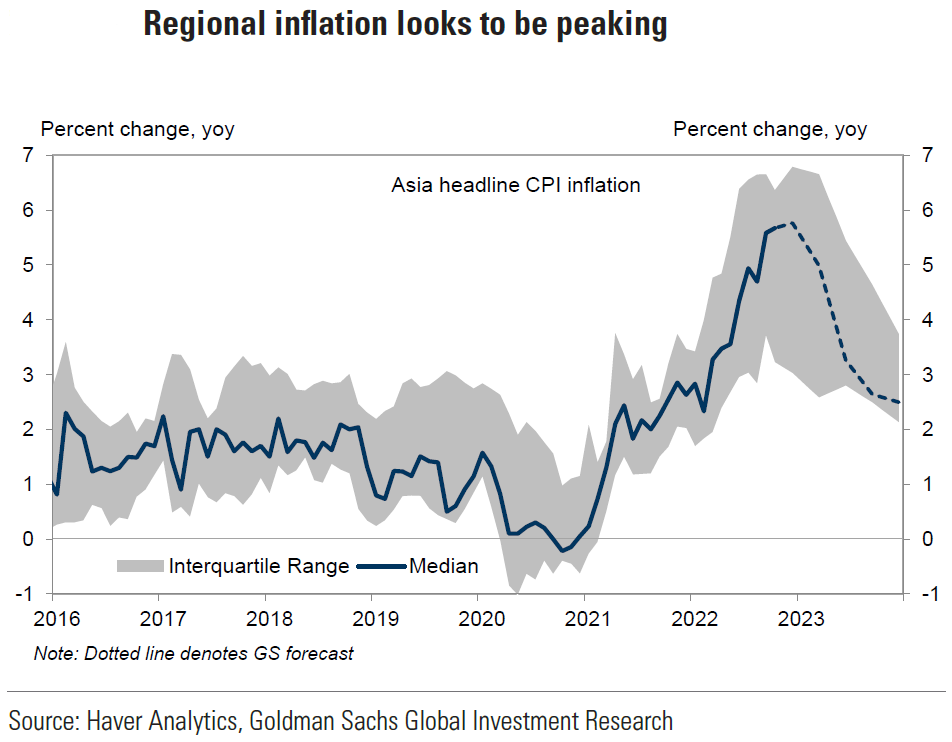
Elevated European Headline Inflation
Headline inflation rates continued to accelerate in Europe as well. As we have previously highlighted, Europe is even more sensitive to higher energy and food prices than the U.S. Spanish inflation for March was 9.8% y/y versus consensus estimate of 8.4%. Spain’s core inflation (excluding non-processed food and energy products) for March was 3.4% y/y. Similarly, Germany’s headline rate of inflation for March hit a 30-year high of 7.3% y/y. This was a substantial increase from February’s y/y rate of 5.1%. The German federal statistics agency Destatis issued the following statement along with the inflation report: “Since Russia’s attack on Ukraine, the prices of natural gas and mineral oil products have markedly increased again and have had a considerable impact on the high rate of inflation.” Due mostly to energy supplies and prices concerns, the German federal government panel of independent economic advisers has reduced its German GDP forecast from its November forecast of 4.6% down to 1.8% for 2022. On March 29, Reuters reported that German consumer sentiment hit its lowest level since February 2021. The Reuters’ story stated as well that French consumer confidence also dropped more than expected in March as “war, inflation hit euro zone recovery hopes.” On Friday, Europe’s statistics office Eurostat reported that Euro zone headline CPI rose by a greater than expected 7.5% in March. Consensus expectation was for a 6.7% increase and February’s increase was 5.9%.
Recession Risk and Treasury Yield Curve Inversion
Although the U.S. economy remains robust currently, the above reports and statistics generally show that concerns are beginning to surface as to the sustainability of the recovery. Many investors are focusing on the probabilities of U.S. stagflation and/or recession. It is our opinion that the risks for both of these outcomes increase to the extent the war persists. Because financial markets participants focus on U.S. Treasury yield curve inversion as a prelude to recessions, we will examine this probability. An inversion in the yield curve occurs when a longer dated Treasury security trades at a lower interest rate than one with a shorter maturity. However, our base case remains that there will not be a recession in 2022. We are currently not forecasting beyond this year as we await more economic data.
Most studies have focused on the two-year and 10-year yield inversion. According to many media reports, the 10-year yield traded very briefly below the two-year yield this week – less than one minute of trading. We will assume that this qualifies for the necessary pre-requisite for a future recession after a yield inversion. We should also emphasize that Fed chair Powell has made clear his belief that the first 18 months of the yield curve is a much better predictor of recession probabilities. This part of the yield curve remains at a “steep” level and far from a risk of inversion. Powell said recently that although he observes the two-year and 10-year yield spread, he prefers to focus on the first 18 months of the yield curve. By making this distinction, we surmise that Powell is really telling us that he will not let the inversion of the two-year and 10-year yield spread dissuade the Fed from a very aggressive monetary tightening cycle to rein in inflation. We take Powell at his word.
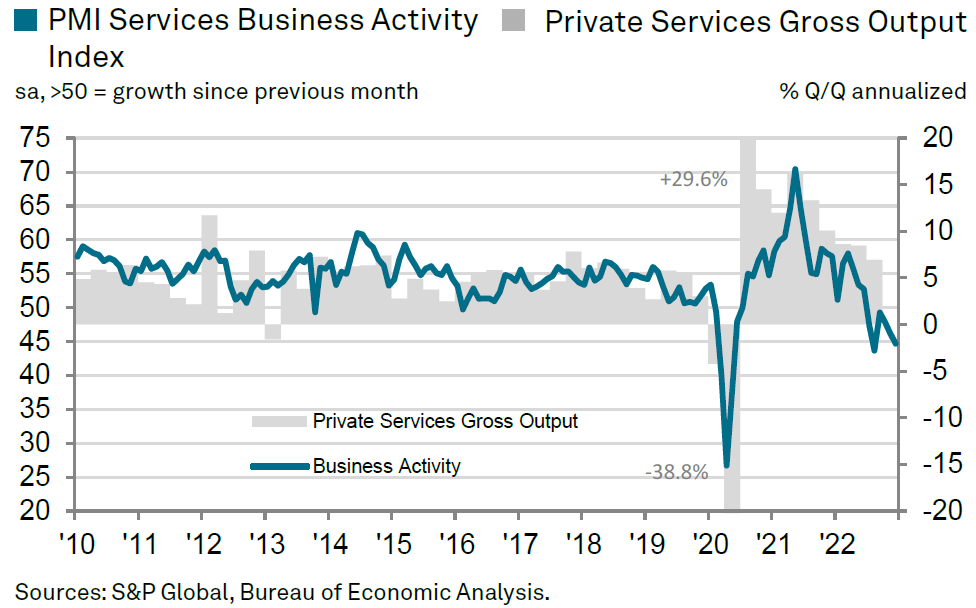
According to Deutsche Bank (DB) on March 30, it has taken seven to 34 months for an economic recession to begin after a yield curve inversion. In DB’s analysis of six recent inversion cases, DB concluded that the S&P 500 took from three to more than 25 months after an inversion before it hit its peak. “On average the S&P 500 returned +19% from the day of the curve inflection to its next peak.” JPM on March 28, cited similar results in noting that the S&P 500 typically peaks “around a year later” – after the inversion and is 15% higher on average. JPM also pointed out how “this time” could be different. Real rates averaged +200 bps at the time of past yield curve inversions. Currently, real rates are still negative. “Crucially, the flat/inverted yield curve was historically a good cycle signal because it would indicate that financing conditions have become highly restrictive…” In contrast, bank lending standards are still easing as we have cited in past commentaries. According to Goldman Sachs on March 31, “credit markets have been relatively stable – reducing systemic risks – cash to asset ratios remain high, and debt servicing capacity is as strong as it has been in 30 years.” We also have highlighted in our commentaries for many months that we will become increasingly concerned about economic contractions when PMIs dip below the 50 demarcation level for economic contractions.
Source: Goldman Sachs, Global Strategy Views: Why equities are performing so well… and what to do now? (3/31/22)
ISM Manufacturing PMI
The Institute for Supply Management (ISM) Manufacturing PMI for March, released on Friday, was 57.1 and was below consensus of 59.0 and below February’s 58.6 reading. The March level was the weakest since September 2020 and suggested a weakening in factory activity. The prices paid subindex showed a steep rise to 87.1 versus expectations of 80.0 and February’s reading of 75.6. Supply chain issues remained a concern. The Employment index rose to 56.3 from 52.0 in February. The production and new orders components declined. Since this PMI reading remained in the high 50’s it does not affect our base case assumption of no recession during 2022.
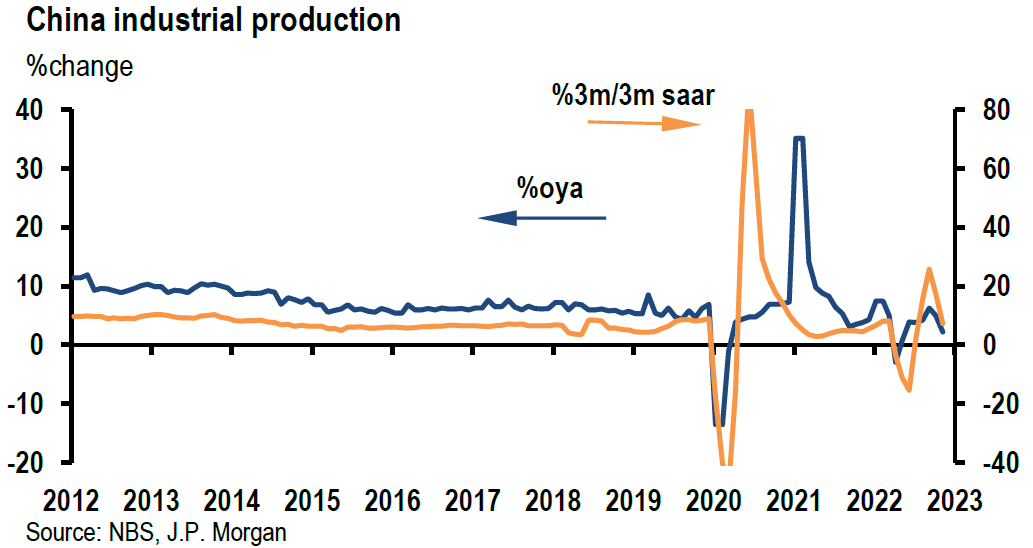
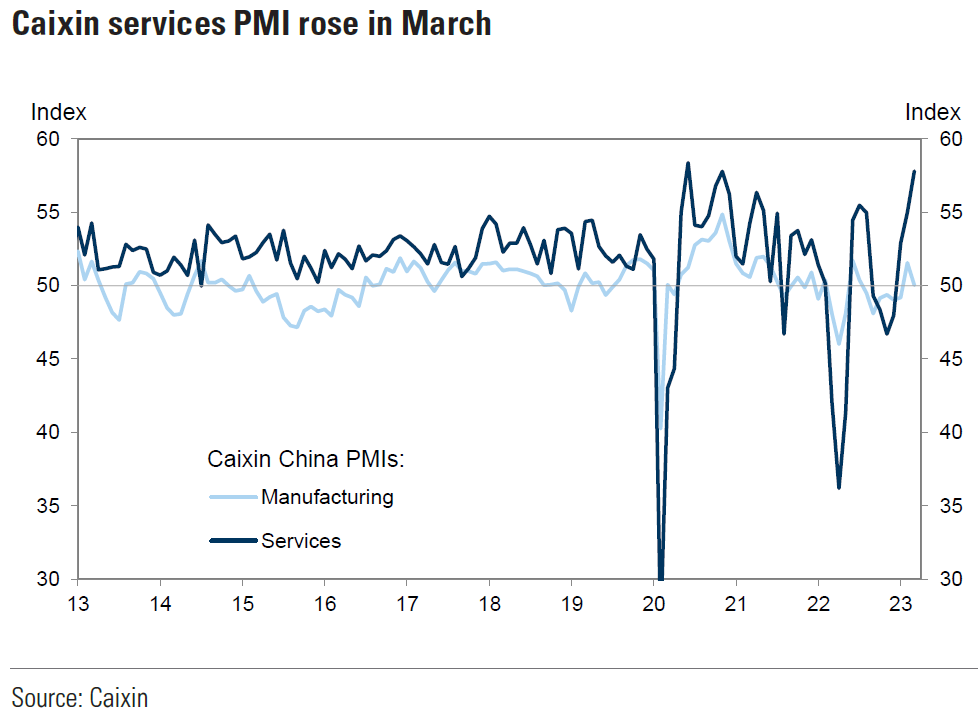
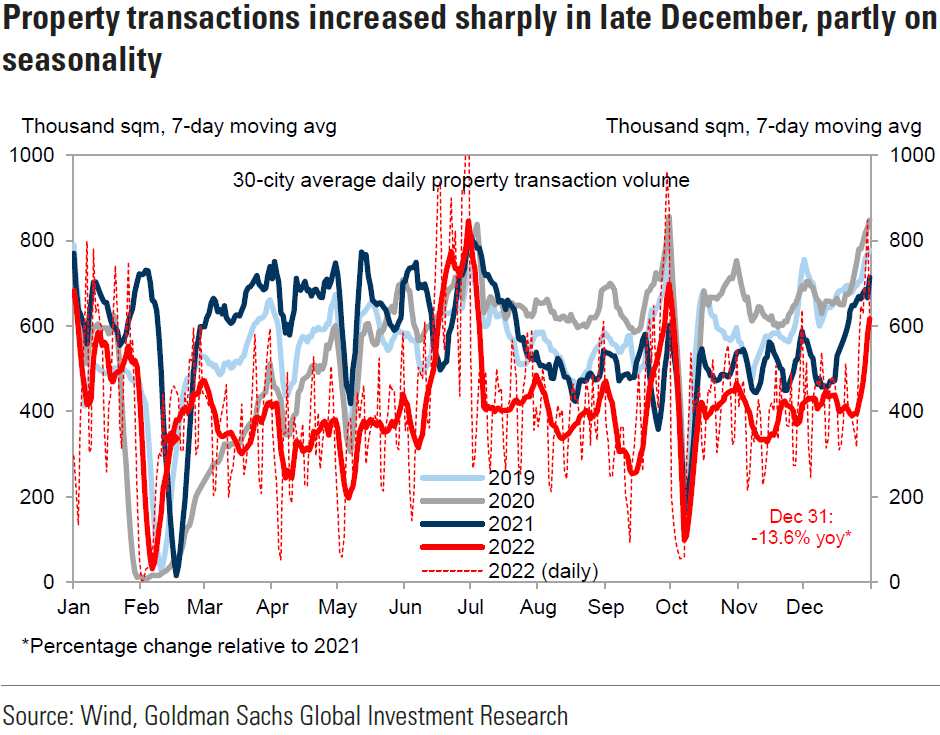
China COVID-19 Related Lockdowns
Apart from the war, China’s zero-COVID-19 policies that often lead to lockdowns continue to be problematic for China’s economic growth. Any announcements of China’s slowing economic growth appear to be a proximate cause recently for oil and other selected commodities to trade lower on fears of slowing demand from China. On Thursday of this week, China revealed that its manufacturing and services PMIs both contacted, (falling below 50), for the first time since February 2020. Recent Chinese lockdowns were a significant factor in the disappointing March economic performance of China. A senior statistician at China’s National Bureau of Statistics (NBS) provided the following explanation: “…recently, clusters of epidemic outbreaks have occurred in many places in China, and coupled with a significant increase in global geopolitical instability, production and operation of China enterprises have been affected.” On March 31, Reuters reported that Shanghai’s COVID-19 lockdown “roiled” auto production. Shenzhen’s earlier lockdown affected semiconductor production. Such lockdowns could continue to affect supply chains that could further exacerbate inflation and lower economic growth. A further contributing factor to the drop in oil prices on Thursday was the announcement by the U.S. that it would release from its Strategic Petroleum Reserves (SPR) 1 million barrels per day for potentially up to six months.
Bottom Line
Our base case is for no U.S. recession in 2022. But we assume continued volatility across virtually all financial markets for at least as long as the war persists. We suppose that a well-diversified portfolio of selected high-quality stocks that includes some commodity exposure could be the best strategy for many long-term investors. Our preferred approach is to anticipate and recognize “tradable bottoms” in equity markets so that we might take advantage of attractive entry points to purchase selected equities.
The economic data and surveys we analyzed this week continued to show a resilient and robust U.S. economy at present. In general, however, we understand that consumers and companies are beginning to have more uncertain outlooks with respect to business activity over the next six months. We suppose that elevated inflation and war-related concerns are at the core of concerns about the future. Moreover, we have little doubt that the Fed will be very aggressive in tightening its monetary policies to rein in inflation.
We foresee that most global economic growth rates will be revised lower and that most inflation forecasts will be revised higher due to the war. Additionally, we assume that downward earnings revisions for many companies might soon reflect these patterns. Predictable margins should become increasingly important in evaluating appropriate investments.
Source: Goldman Sachs, Real Asset Investing: Commodities are an ideal hedge against stagflation (3/31/22)


Definitions
Federal Funds Rate – The term federal funds rate refers to the target interest rate set by the Federal Open Market Committee (FOMC). This target is the rate at which commercial banks borrow and lend their excess reserves to each other overnight.
PCE Price Index (headline) – The PCE Price Index uses the personal consumption expenditures component of the Personal Income and Outlays report to derive the PCE Price Index, which is the third major component of Personal Income and Outlays showing how prices are periodically inflating or deflating.
Core PCE inflation – The “core” PCE price index is defined as personal consumption expenditures (PCE) prices excluding food and energy prices. The core PCE price index measures the prices paid by consumers for goods and services without the volatility caused by movements in food and energy prices to reveal underlying inflation trends.
Consumer Price Index (CPI) – The Consumer Price Index (CPI) is a measure that examines the weighted average of prices of a basket of consumer goods and services, such as transportation, food, and medical care. It is calculated by taking price changes for each item in the predetermined basket of goods and averaging them.
The Purchasing Managers’ Index (PMI) – The Purchasing Managers’ Index (PMI) is an index of the prevailing direction of economic trends in the manufacturing and service sectors. It consists of a diffusion index that summarizes whether market conditions, as viewed by purchasing managers, are expanding, staying the same, or contracting. The purpose of the PMI is to provide information about current and future business conditions to company decision makers, analysts, and investors.
ADP National Employment Report – The ADP National Employment Report is a monthly report of economic data that tracks the level of nonfarm private employment in the U.S. It is published by Automatic Data Processing, a company that handles payroll for about a fifth of all privately-employed individuals in the U.S. The ADP National Employment Report is also known as the ADP Jobs Report or the ADP Employment Report.
S&P 500 Index – The S&P 500 Index, or the Standard & Poor’s 500 Index, is a market-capitalization-weighted index of the 500 largest publicly-traded companies in the U.S. re-positioning
The STOXX Europe 600 Index – The STOXX Europe 600 Index is derived from the STOXX Europe Total Market Index (TMI) and is a subset of the STOXX Global 1800 Index. With a fixed number of 600 components, the STOXX Europe 600 Index represents large, mid and small capitalization companies across 17 countries of the European region: Austria, Belgium, Denmark, Finland, France, Germany, Ireland, Italy, Luxembourg, the Netherlands, Norway, Poland, Portugal, Spain, Sweden, Switzerland and the United Kingdom.
Tokyo Price Index (TOPIX) – TOPIX is a capitalization-weighted index that lists all firms in the “first section” of the Tokyo Stock Exchange (TSE), a section that organizes all large firms on the exchange into one group. The second section of the TSE pools all of the smaller remaining companies.
MSCI Asia Ex-Japan Index – The MSCI AC Asia ex Japan Index captures large and mid-cap representation across 2 of 3 Developed Markets (DM) countries (excluding Japan) and 9 Emerging Markets (EM) countries in Asia. With 1,212 constituents, the index covers approximately 85% of the free float-adjusted market capitalization in each country.
Investment Grade (IG) – Investment grade refers to the quality of a company’s credit. To be considered an investment grade issue, the company must be rated at ‘BBB’ or higher by Standard and Poor’s or Moody’s. Anything below this ‘BBB’ rating is considered non-investment grade.1 If the company or bond is rated ‘BB’ or lower it is known as junk grade, in which case the probability that the company will repay its issued debt is deemed to be speculative.2
High Yield (HY) – High-yield bonds (also called junk bonds) are bonds that pay higher interest rates because they have lower credit ratings than investment-grade bonds. High-yield bonds are more likely to default, so they must pay a higher yield than investment-grade bonds to compensate investors.
Real Interest Rate – A real interest rate is an interest rate that has been adjusted to remove the effects of inflation to reflect the real cost of funds to the borrower and the real yield to the lender or to an investor. The real interest rate reflects the rate of time-preference for current goods over future goods. The real interest rate of an investment is calculated as the difference between the nominal interest rate and the inflation rate.
Gross Domestic Product (GDP) – Gross domestic product (GDP) is the total monetary or market value of all the finished goods and services produced within a country’s borders in a specific time period. As a broad measure of overall domestic production, it functions as a comprehensive scorecard of a given country’s economic health.
Seasonally Adjusted Annual Rate (SAAR) – A seasonally adjusted annual rate (SAAR) is a rate adjustment used for economic or business data, such as sales numbers or employment figures, that attempts to remove seasonal variations in the data. Most data is affected by the time of the year, and adjusting for the seasonality means that more accurate relative comparisons can be drawn between different time periods.
Foreign Exchange (Forex) – Foreign Exchange (forex or FX) is the trading of one currency for another. For example, one can swap the U.S. dollar for the euro. Foreign exchange transactions can take place on the foreign exchange market, also known as the forex market.
Eurozone – The eurozone, officially called the euro area, is a monetary union of 19 member states of the European Union that have adopted the euro as their primary currency and sole legal tender.
Basis Points (bps) – A basis point is one hundredth of one percent, used chiefly in expressing differences of interest rates.
bbl – An abbreviation for oilfield barrel, a volume of 42 galUS [0.16 m3].
RHS – Shorthand for “right hand side.”
IMPORTANT DISCLOSURES
The views and opinions included in these materials belong to their author and do not necessarily reflect the views and opinions of NewEdge Capital Group, LLC.
This information is general in nature and has been prepared solely for informational and educational purposes and does not constitute an offer or a recommendation to buy or sell any particular security or to adopt any specific investment strategy.
NewEdge and its affiliates do not render advice on legal, tax and/or tax accounting matters. You should consult your personal tax and/or legal advisor to learn about any potential tax or other implications that may result from acting on a particular recommendation.
The trademarks and service marks contained herein are the property of their respective owners. Unless otherwise specifically indicated, all information with respect to any third party not affiliated with NewEdge has been provided by, and is the sole responsibility of, such third party and has not been independently verified by NewEdge, its affiliates or any other independent third party. No representation is given with respect to its accuracy or completeness, and such information and opinions may change without notice.
Investing involves risk, including possible loss of principal. Past performance is no guarantee of future results.
Any forward-looking statements or forecasts are based on assumptions and actual results are expected to vary from any such statements or forecasts. No assurance can be given that investment objectives or target returns will be achieved. Future returns may be higher or lower than the estimates presented herein.
An investment cannot be made directly in an index. Indices are unmanaged and have no fees or expenses. You can obtain information about many indices online at a variety of sources including: https://www.sec.gov/fast-answers/answersindiceshtm.html or http://www.nasdaq.com/reference/index-descriptions.aspx.
All data is subject to change without notice.
© 2024 NewEdge Capital Group, LLC


