

Weekly Summary – May 15 – May 19
Key Observations:
- We thought that most of the Federal Reserve (Fed) officials who spoke this week presented rather hawkish views that seemed to favor a possible further hike in June in lieu of a generally assumed pause. Fed chair Powell, however, took a more balanced view on Friday that appeared to favor a pause at the Fed’s next meeting in June. In doing so, Powell conveyed the impression that his focus was on further credit tightening that could be due to the regional banking crisis. Treasury Secretary Janet Yellen indicated that more bank mergers may be needed “after a series of bank failures. Combining Yellen’s anticipation of further bank mergers and Powell’s focus on further credit tightening due to the regional bank crisis has raised our suspicion that the regional banking crisis might be far from being “over.”
- It appeared on Friday that the disagreements between Republicans and Democrats have led to at least a short term “pause” on talks to resolve the debt ceiling crisis as some Republicans accused the Democrats of having “unreasonable” demands. We remain hopeful that this impasse will be short-lived and therefore prevent people from being further “stressed out.”
- We should not assume that resolution of the debt ceiling crisis will lead to a “clear sailing” environment for U.S. equities as many uncertainties will remain. Bloomberg News on Friday published a report indicating that upon resolution of the debt ceiling crisis, the U.S. Treasury could issue as much as $1 trillion worth of Treasury securities to replenish the Treasury’s “coffers.” Such an issuance could drain liquidity from financial markets, thereby pressuring “riskier” assets. Less liquidity could further increase the risk of more regional bank failures that could lead to further credit tightening and a slower U.S. economy.
- The New York Fed’s Q1 report on household debt and credit showed an increase in household debt and delinquencies. So far, the U.S. consumer has shown an amazing resiliency and capacity to spend. A combination of “too heavy” debt loads and an increase in unemployment levels could cause an abrupt slowdown in U.S. consumer spending. Recent earnings reports have also shown many shoppers are beginning to “trade down.” This tendency is already having an effect on spending patterns.
The Upshot: Our general investment approach remains the same as depicted in last week’s commentary. We maintain our preference for quality stocks with good balance sheets, relatively stable cash flows with stable margins. Volatility across sectors continues to be supportive of a diversified portfolio for long term investors. We continue to stress that stock selectivity in the current environment is of paramount importance.
We remain hopeful that the debt ceiling will be resolved in a “timely” manner. If it is not, we expect extreme volatility in financial markets. But we also expect volatility even if the U.S. debt ceiling issues are resolved in a timely way. Due to an expected large issuance of Treasury securities after a debt resolution, we expect that liquidity could be drained from financial markets. In our opinion, less liquidity should lead to more volatility. Many uncertainties remain. We now feel more strongly in our forecast that the regional banking crisis is not over and that credit conditions will tighten even more.
Fedspeak – Pause or Hike in June – Fed Chair Powell Weighs In
Through Thursday, this was another week of “mixed” economic data and earnings reports. We continue to see much uncertainty among economists, analysts and investors around inflation and economic trajectories. But the tone of many Fed officials seems to be more hawkish even as a potentially more-evident split among Fed officials might be developing. In reference to the Fed’s assumed “pause” in its rate hike policies at its next June 13-14 meeting, president of the Dallas Fed Lorie Logan stated on Thursday that “the data in coming weeks could yet show that it is appropriate to skip a meeting … [but] as of today, though, we aren’t there yet.” Earlier this week, Atlanta Fed president Raphael Bostic stated that “inflation is not going to come down very quickly … [and that] if there’s going to be a bias toward action, for me it would be a bias to increase a little further as opposed to a cut.” He also acknowledged the pressures and “stress” that the Fed would endure at their June meeting. “There’s going to be tension and pressure and stress coming from a lot of different circles, and we are collectively going to have to … be willing to be resolute and hold the course.” James Bullard, St. Louis Fed president, echoed Logan’s view when he stated this week that “data does not yet show that a June pause is appropriate,” but that he will keep an open mind. Cleveland Fed president Loretta Mester indicated on Tuesday that she thought more rate hikes might be appropriate when she denoted that we were possibly still short of a sufficiently-restrictive fed funds rate that would warrant pausing the efforts to bring down inflation to the Fed’s 2% target. She said: “Have we gotten to that rate yet? At this point, given the data we’ve gotten so far, I would say no.” Subsequent to this hawkish “Fedspeak,” and economic data showing a still resilient U.S. consumer and economy, financial markets started to price an increasing probability of a June Fed hike. On Thursday, The CME Group’s FedWatch tool showed at least a 36.7% probability that the Fed hikes again in June, compared to only a 10% chance one week ago. In our April 28 commentary, we acknowledged the possibility of a Fed’s federal funds rate hike in June even though our base case was an “elongated pause” after the Fed’s May meeting. In that weekly summary we stated that “if the U.S. economy shows resilience and inflation remains elevated, we would not be surprised to see another hike” in June.
On Friday, Powell appeared to take the other side of the hawkish Fedspeak earlier in the week. He stated that an assessment of whether to hike in June “will be an ongoing one. As we move ahead meeting by meeting having come this far, we can afford to look at the data and the evolving outlook and make careful assessments.” Powell seemed to be making his points in a force-full manner. “We’ve come a long way in policy tightening and the stance of policy is restrictive and we face uncertainty about the lagged effects of our tightening so far and about the extent of credit tightening from recent banking stresses.” Powell then added “[Banking sector developments] are contributing to tighter credit conditions and are likely to weigh on economic growth, hiring and inflation.” We found it curious that Powell seemed to focus on tightening credit conditions from the banking crisis in comparison to other Fed officials until we read a May 19 Reuters report that “said U.S. Treasury secretary Janet Yellen told bank CEOs on Thursday that more bank mergers may be necessary after a series of bank failures.” This raises our suspicion that Yellen might know something not reflected in the markets. Namely, that more banks will need to be “rescued.”
Debt Ceiling Talks Hit a Snag on Friday – “Wrong Pause,” More ”Stressed Out”
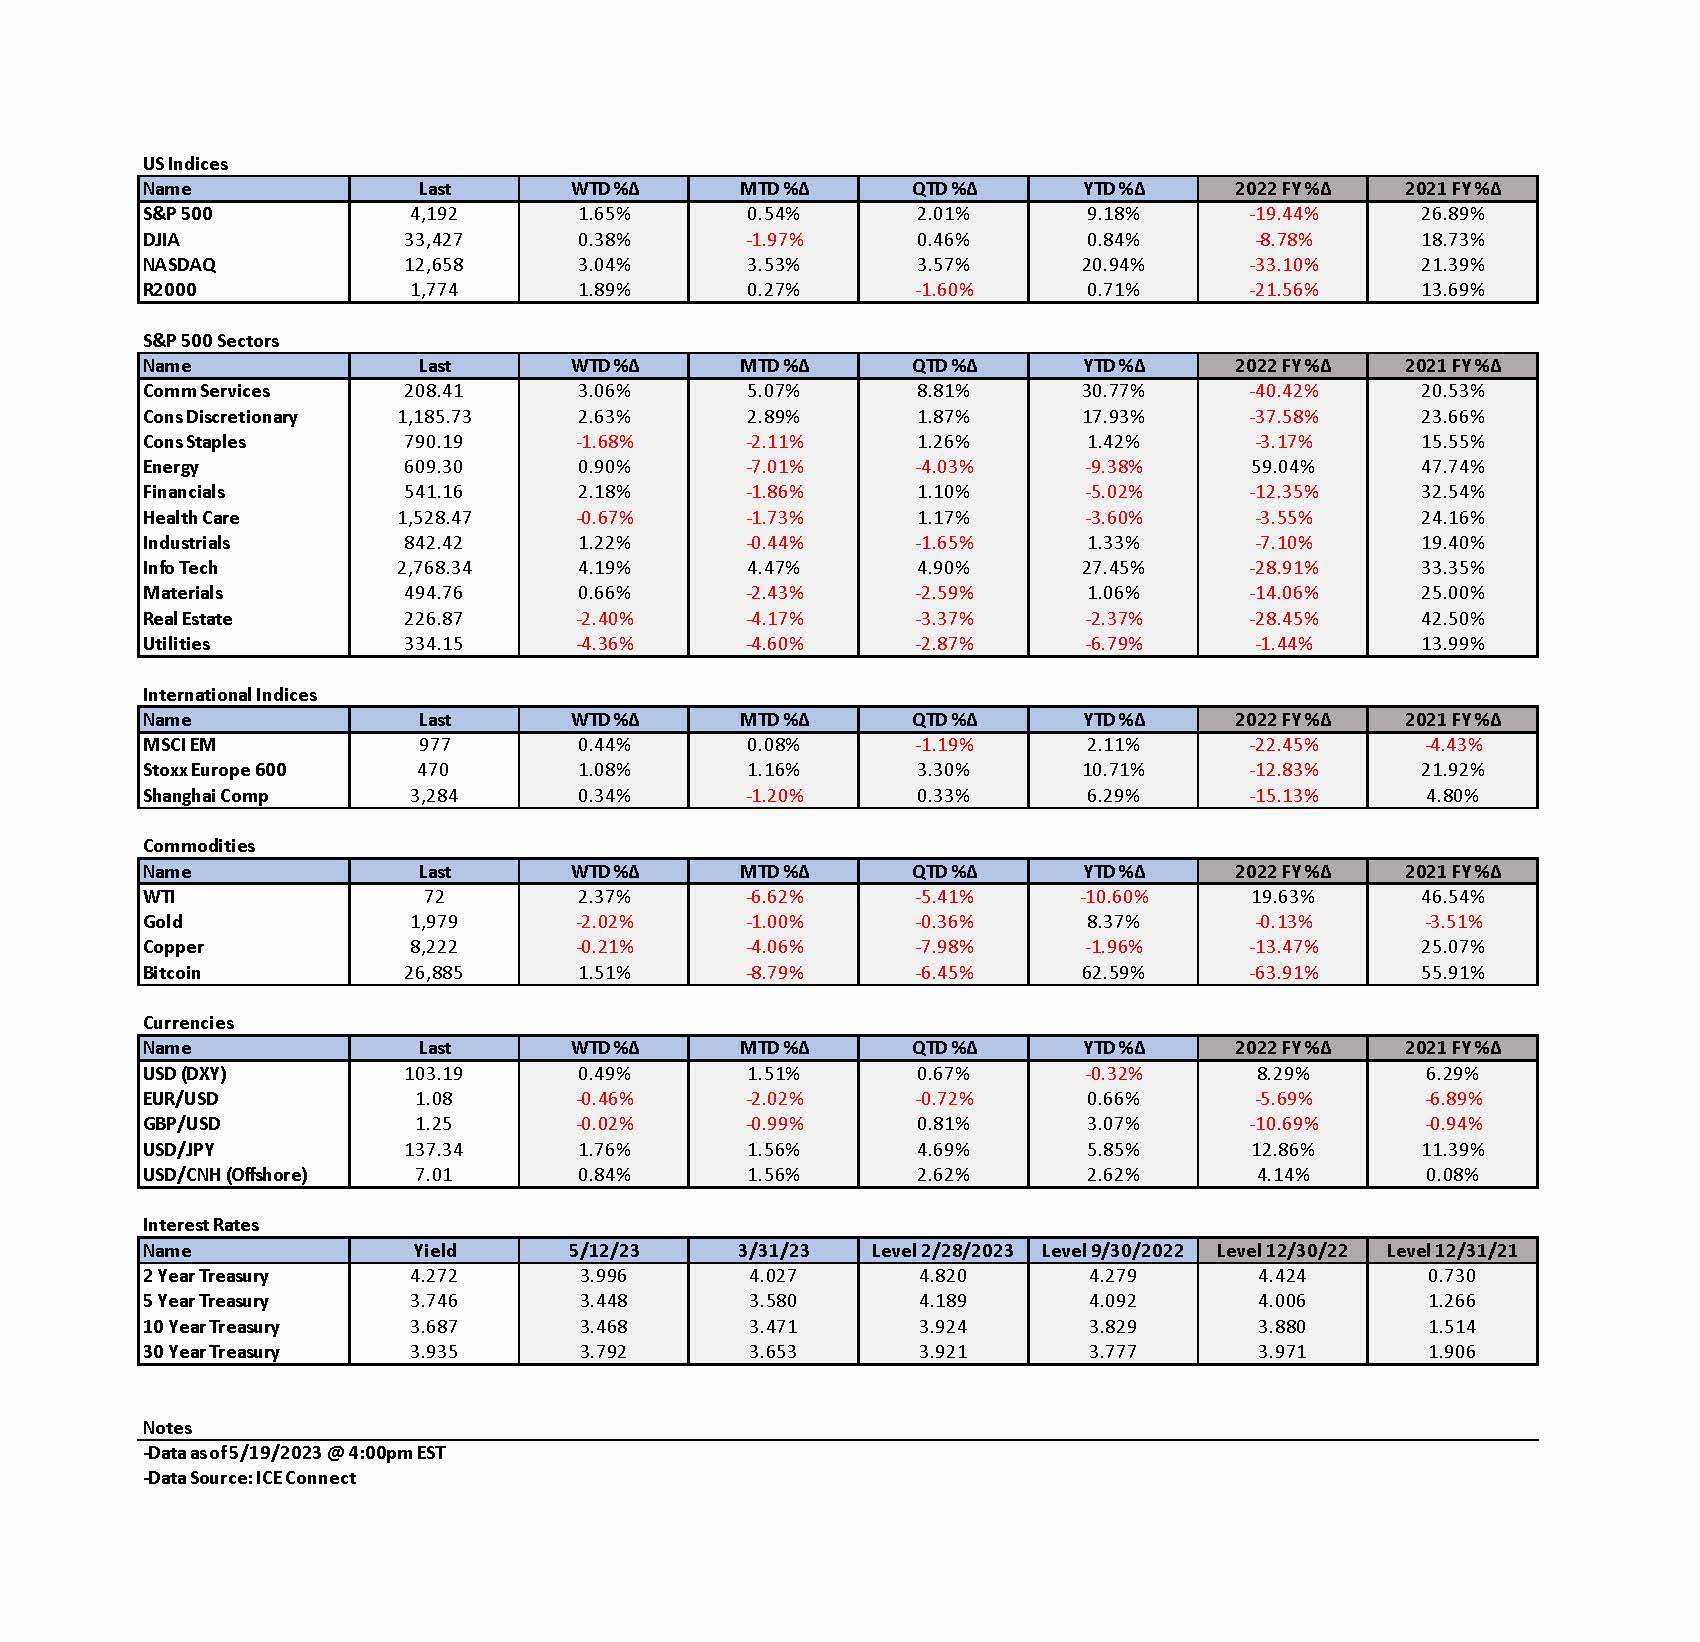
Although much uncertainty surrounds the timing and details of the U.S. debt ceiling resolution, financial markets appear to be increasingly confident that the U.S. will avoid a default on its debt obligations. In last week’s commentary, we were able to point out promising developments we found encouraging that the U.S. could resolve its debt ceiling issues in a “timely way.” This was especially evident from U.S. equity rallies of Wednesday and Thursday. The United States dollar (USD) and interest rates also rose, and the two-to-10-year Treasury yield curve became more inverted. We have shown in our recent commentaries the many uncertainties that we must confront in navigating financial markets. Moreover, we also will show that the reliability of some financial data that we continue to analyze and rely on has been increasingly called into question. We believe that many investors and analysts can relate to Bostic’s feeling of stress referenced above. In these times, we thought that a more lighthearted approach to stress might be welcomed. The Twenty One Pilots song “Stressed Out” seemed to be fitting in this regard. In times of great uncertainty, most people seem to long for “simpler” times. We should note that most “past times” seem to be simpler in general. “Wish we could turn back time; To the good old days; When our mama sang us to sleep; But now we’re stressed out.” Unfortunately, we don’t have that luxury. We must deal with “reality.” We have found that deciphering what is the “real” economic data is sometimes not very straightforward. On Friday, we got the wrong “pause” and more reason to be “stressed out.” Rep. Garret Graves (Louisiana), who had been “tapped” by Speaker of the House Kevin McCarthy to lead the debt ceiling talks for the Republicans, stated that “it’s time to press pause because it’s just not productive” to continue debt ceiling talks as some Republicans branded Democrat demands as “unreasonable.”
Reliability of Economic Data
On May 17, Goldman Sachs (Goldman) questioned the reliability of the Job Openings and Labor Turnover Survey (JOLTS). Along with the Fed, we have relied on this survey as an indication of the extent of U.S. labor market “tightness.” Although we have focused mainly on the number of job openings or vacancies, we have also considered the “quits” rate, hirings and separations data as well. Goldman observed that the response rate to the JOLTS has “plummeted” almost 30 percentage points (pp) since the start of the pandemic to just over 30%. A smaller sample size presumably makes this less reliable. The U.S. Bureau of Labor Statistics cites “the increase in remote work as one of the key drivers of nonresponse.” Goldman found that “job openings have declined 7 pp more at companies with flexible working arrangements over the last year.” Incorporating this bias into the non-responders, we assume that job openings should have a tendency to be overstated.
Another key barometer in assessing the tightness of the U.S. labor market has been the jobless claim data, and in particular the initial claims for unemployment benefits. Initial claims for the week that ended May 13 reversed some of the prior week’s surprising increase in initial jobless claims. The latest initial claims data showed a decrease of 22,000 to 242,000 – back down to the level of two weeks ago. This was the largest weekly drop since 2021. It was expected that 254,000 initial claims would have been filed for the latest available week’s data. But a number of analysts observed that initial jobless claims from the prior week were at least partially inflated by some fraudulent claims in Massachusetts. The Massachusetts Department of Unemployment Assistance has acknowledged that it “is experiencing an increase in fraudulent claim activities.” These fraudulent claims for the week that ended May 6, drove initial jobless claims to their highest level since October 30, 2021. Bank of America Securities estimated that Massachusetts accounted for 45.6% of the increase in unadjusted claims for that first week of May. We were encouraged last week by the rather large jump in these claims that we surmised was suggesting a less-tight labor market. Now knowing that the prior week’s numbers were inflated, makes us less troubled that the latest data showed a tighter labor market. Continuing jobless claims for the week that ended May 6 dropped another 8,000 from the previous week’s level that was revised down already by 6,000 to 1,799,000, and compared to an expected level of 1.818 million. This was the lowest level of continuing claims since the week that ended March 4. At this point, we also would like to remind the reader that we have commented often on the distortions embedded in seasonally adjusted economic data mainly due to the severe swings caused by the pandemic and the Russian-Ukraine war. The possible distortions in any one month’s data have made us rather reluctant to change our opinions or forecasts based on just one month’s data.
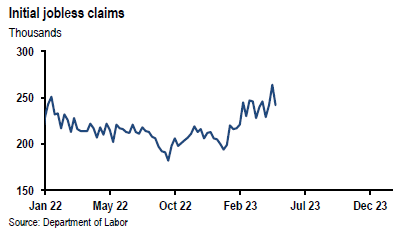
Source: JP Morgan, Thursday data wrap-up (5-18-2023)
April U.S. Retail Control or Core Retail Sales Exceeded Expectations
The April retail control group rose 0.7% month-over-month (m/m) exceeding consensus expectations of a 0.4% increase. Control group sales exclude autos, gasoline, building materials and food services. The online-heavy non-store category rose 1.2%, which accounted for more than half of the gain in core sales. We interpreted the solid increase in core retail sales as a sign of sustained consumer demand. The Bureau of Economic Analysis (BEA) estimate of real monthly consumer spending is mostly based on control retail sales. Therefore, control retail sales correspond most closely to the consumer spending component of GDP. Consumer spending accounts for more than two-thirds of U.S. GDP. Headline retail sales increased 0.4% m/m – lower than the expected 0.8% increase – but was the first positive monthly increase since January. The prior month was revised slightly lower to -0.7%. Retail sales excluding autos increased 0.4% as expected. Additionally, retail sales excluding autos and gas rose 0.6%, above the median estimate of 0.2%. Some anomalies appeared in retail sales, such as nominal retail sales at vehicle dealers increased 0.4% even as automakers’ unit sales increased 7.2% m/m. Furthermore, gas station sales declined 0.8% while gasoline prices rose 3.0%.
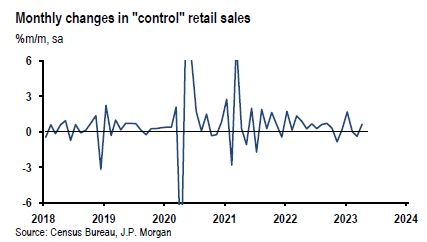
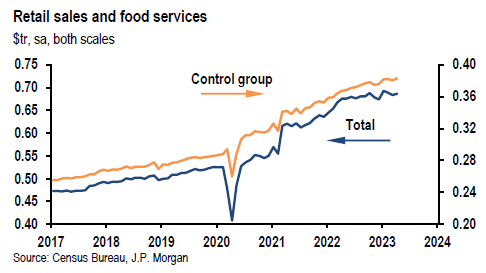
Source: JP Morgan, Tuesday data wrap-up (5-16-2023)
Earnings Reports from Large U.S. Retailers Show a Tendency for Consumers to “Trade Down”
Walmart Inc. (WMT) noted that its Q1 results got a “boost” from more wealthy customers shopping at its stores. WMT’s CFO John David Rainey observed that “as consumers have less purchasing power, less buying power, we’re seeing more of their income, their wallets being devoted towards food, and less towards general merchandise.” WMT saw strength in its grocery sales as well as health and wellness that was partially “offset” by weakness in general merchandise. Target Corporation’s (TGT) CEO Brian Cornell conveyed similar impressions: “(Consumers are) investing more in those household essentials and food and beverage items, and they’re shopping more cautiously when it comes to all things discretionary.”
New York Fed’s Q1 Report on Household Debt and Credit Showed Increases as Delinquencies Rose
According to the NY Fed’s Q1 report, total U.S. household debt rose $148 billion in Q1 – a 0.9% increase quarter-over-quarter – to reach $17.05 trillion. This debt load is $2.9 trillion more than it was at the end of 2019. Mortgage balances rose $121 billion to reach $12.04 trillion. New mortgage originated debt including refinancings rose $324 billion in Q1. This was the lowest level since Q2 2014. Credit card balances were flat at the end of Q1 at $986 billion. In contrast to a typical down trend for Q1, auto loan balances increased $10 billion. “The share of current debt becoming delinquent increased for most debt types. The delinquency transition rate for credit cards and auto loans increased by 0.6 and 0.2 percentage points, respectively approaching or surpassing their pre-pandemic levels.” Total delinquency rates rose to 43% – the highest since Q3 of 2020. We view this data as confirming the U.S. consumers’ determination to spend, but we question the sustainability of the increasing trend to spend. We surmise that the very low U.S. unemployment rate has been a critical component of this trend. A rise in the unemployment rate could bring an abrupt halt to resilient consumer spending.
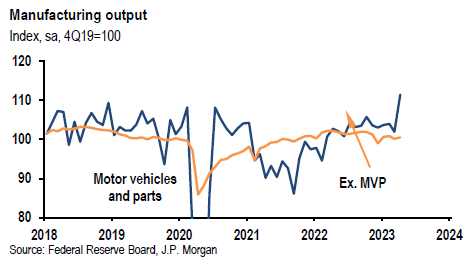
April U.S. Industrial Production Exceeded Expectations
Industrial production rose 0.5% m/m exceeding expectations of a flat reading. March was revised to show a flat reading from a previous estimate of a 0.4% increase. Manufacturing production increased 1.0% versus an expected 0.1% increase m/m. Vehicle production increased 9.3% as the 11.4 million seasonally adjusted annual rate (saar) on vehicle assemblies was the highest since July 2020. Manufacturing excluding motor vehicles was 0.3% higher. The mining index rose 0.6% and the utilities index dropped 3.1% m/m due to mild April temperatures that reduced heating demand.
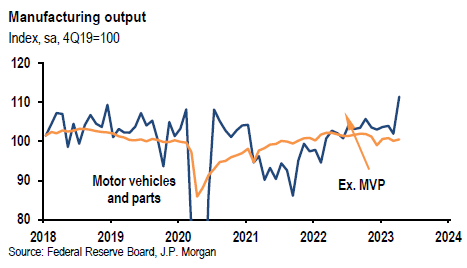
Source: JP Morgan, Tuesday data wrap-up (5-16-2023)
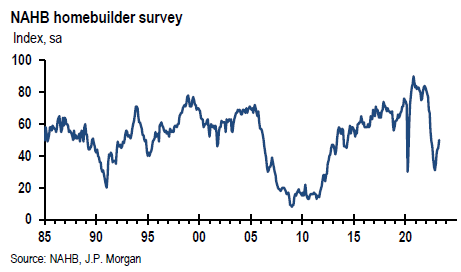
U.S. Homebuilders Confidence Rises More than Expected in May
The National Association of Home Builders (NAHB) housing market index rose five points to 50, above an expected reading of 45. This was the fifth consecutive month of increases in homebuilder confidence and was the highest level since last July. We suspect that the continued increase in homebuilder confidence is being driven by still strong housing demand due to limited inventories, and in spite of higher mortgage rates. The gauge for current single-family sales rose five points to 56, home sales over the next six months increased seven points to 57 and the gauge for prospective buyers rose two points to 33.
Source: JP Morgan, Tuesday data wrap-up (5-16-2023)
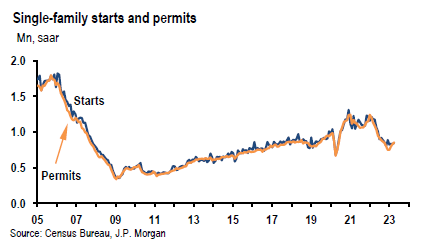
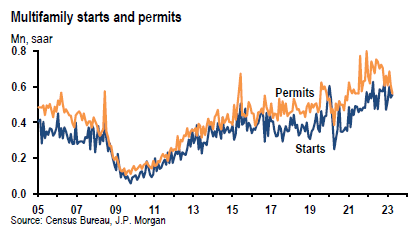
U.S. April Housing Starts Rebound Off a Downwardly Revised March Level and Building Permits Were Less than Expected
Housing starts increased 2.2% in April m/m to a 1.401 million saar pace versus an expected decline of 1.4%, but because the April gain was off a lowered March level the actual 1.4 million pace in line with the expected level. March was revised lower by 4.5%. single family starts increased 1.5% m/m in April and the more volatile multi-family starts were 3.2% higher. Building permits declined 1.5% to 1.416 million saar in April versus an expected flat reading. This was the second consecutive monthly decline in building permits. Permits for single family homes increased 3.1% to a seven-month high of 855,000 but permits for multifamily homes dropped 7.7% m/m to a rate of 561,000, the lowest since July 2021. Given the relative stability in the more important single-family data, we interpret housing starts and permits taken together as trying to at least form a base for housing activity.
Source: JP Morgan, Tuesday data wrap-up (5-17-2023)
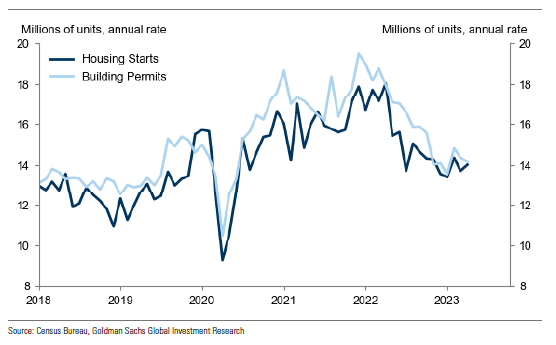
Source: Goldman Sachs, USA: Housing Starts Level in Line With Expectations in April (5-17-2023)
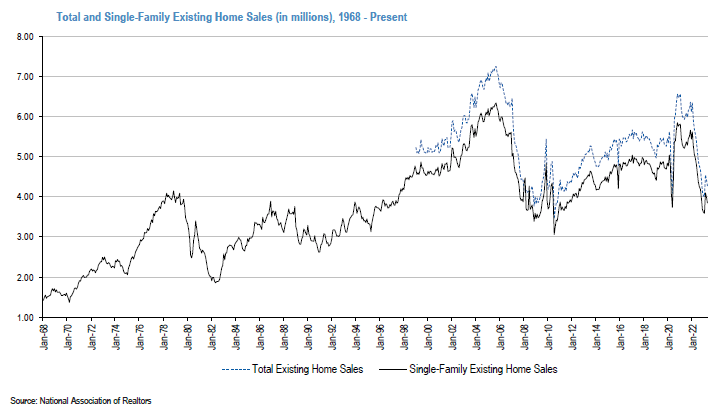
U.S. April Existing Home Sales Fall Close to Expectations
Existing home sales, which include completed transactions of single-family homes, town houses, condominiums and co-ops, declined 3.4% m/m to 4.28 million saar. April as the second consecutive month of declining home sales but was preceded by a 14% monthly increase in February. January’s annual sales pace of 4.0 million was the cycle low and the recent cycle high was 6.56 million. Total inventory was 7.2% higher m/m to 1.04 million units. At the current sales pace, inventories would be exhausted after 2.9 months, compared to a 2.6-month supply in March. The chief economist at National Association of Realtors (NAR), Lawrence Yun stated that “home sales are bouncing back and forth but remain above recent cyclical lows. The combination of job gains, limited inventory and fluctuating mortgage rates over the last several months have created an environment of push-pull housing demand.” We view the housing data that we presented as an indication that the U.S. housing market is beginning to stabilize.
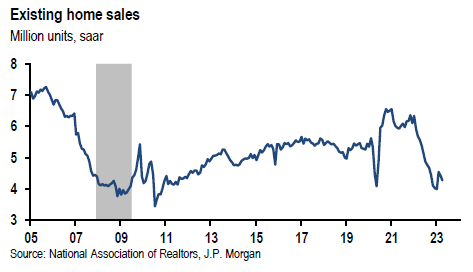
Source: JP Morgan, Thursday data wrap-up (3-18-2023)
Source: Goldman Sachs, Homebuilding (5-18-2023)
U.S. Mortgage Applications Declined Last Week
Mortgage applications to purchase a home declined 4.8% last week from the prior week. According to Mortgage Bankers’ Association, the average 30-year fixed rate mortgage rose to a two-month high last week of 6.57% from 6.48% the prior week. This compares to a 5.49% rate for the same week one year ago.
The Conference Board’s Leading Economic Index (LEI) Continued to Decline in April
The LEI dropped 0.6% in April to 107.5 after a 1.2% decline in March. It is now 4.4% lower over the six-month period between October 2022 and April versus a 3.8% decline during the preceding six months. The Senior Manager, Business Cycle Indicators at The Conference Board summarized the survey’s data. “Weaknesses among underlying components were widespread – but less so than March’s reading, which resulted in a smaller decline. Only stock prices and manufacturers’ new orders for both capital and consumer goods improved in April. Importantly, the LEI continues to warn of an economic downturn this year. The Conference Board forecasts a contraction of economic activity starting in Q2 leading to a mild recession by mid-2023.”
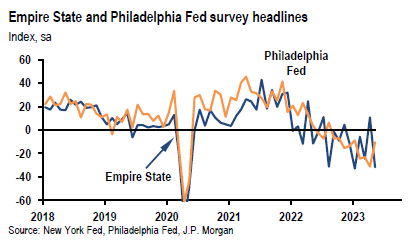
Regional Fed Surveys Released this Week Continue to Show Weakness
The New York Fed’s Empire State manufacturing survey of headline general business conditions dropped sharply by 43 points to a negative -31.8. New orders and shipments also plunged after rising “significantly” last month. Many firms do not expect business activity to improve over the next six months. Capital spending plans fell to 0.8, the lowest level in three years. Reponses for this survey were collected between May 2 and 9. Responses for the N.Y. Fed’s Business Leaders survey were also collected during this same time period. This is a survey of services firms in the New York area. The headline business activity index declined seven points to a negative -16.8. The business climate index was little changed at a negative -45.8, indicating a business climate much worse than normal. Responses for the Philadelphia Fed’s manufacturing index were collected from May 8 to May 15. This index improved by a more than expected increase of 20.9 points but rose to a still negative reading of -10.4. this index has been in negative territory since last summer, but May’s readings were the least “bad” since January. Shipments and new orders increased into positive territory, but the employment index was little changed in negative territory. Future expectations were “muted.”
Source: JP Morgan, Tuesday data wrap-up (5-16-2023)
Source: JP Morgan, Thursday data wrap-up (5-18-2023)
Bottom Line
For the time being we are maintaining our basic investment approach as expressed in last week’s commentary. We continue to prefer high quality stocks that offer good balance sheets, as well as relatively stable cash flows and profit margins. We prefer a global diversified portfolio for long term investors. We continue to stress that stock selectivity in this current environment is of paramount importance. We foresee continued financial market volatility.
After the U.S. debt ceiling is resolved we expect issuance of a very large amount of Treasury securities that should “drain” liquidity from financial markets. In our opinion, less liquidity should increase volatility. After analyzing Powell’s and Yellen’s comments towards the end of this week we now feel more strongly in our forecast that the regional banking crisis is not over and that we foresee further tightening of credit conditions.
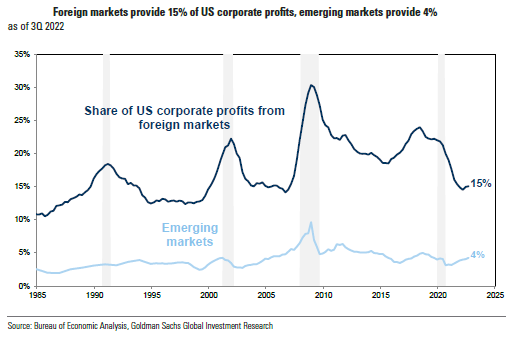
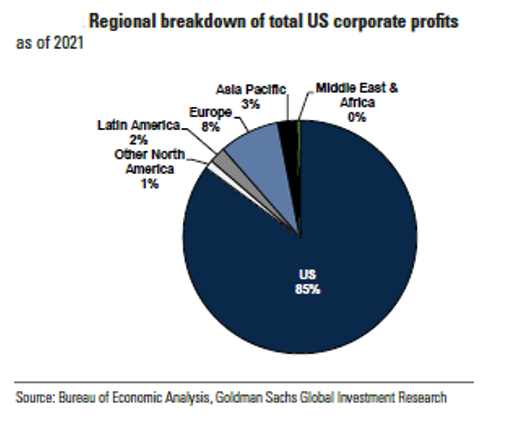
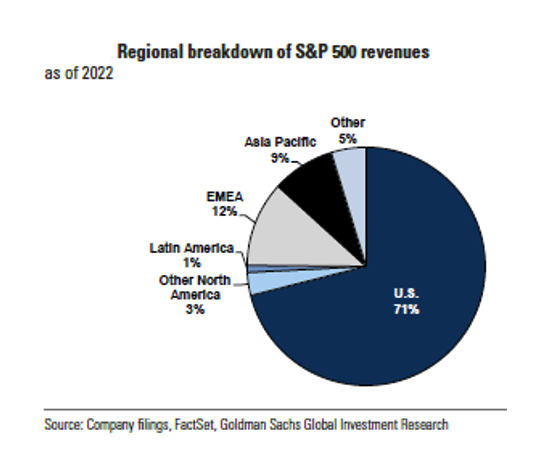
Source: Goldman Sachs, 2023 Portfolio Passport: Analyzing foreign sales exposure of US firms (5-17-2023)
Definitions:
Federal Funds Rate – The term federal funds rate refers to the target interest rate set by the Federal Open Market Committee. This target is the rate at which commercial banks borrow and lend their excess reserves to each other overnight.
CME FedWatch Tool – This tool acts as a barometer for the market’s expectation of potential changes to the fed funds target rate while assessing potential Fed movements around FOMC meetings.
Retail Sales – Retail sales represent a key macroeconomic metric that tracks consumer demand for finished goods. It acts as a key economic barometer and whether inflationary pressures exist. Retail sales are measured by durable and non-durable goods purchased over a defined period of time.
Housing starts – Housing starts are a measure of new residential construction and are considered a key economic indicator.
US Debt Ceiling – The debt ceiling is the maximum amount that the U.S. government can borrow by issuing bonds. The Treasury Department must find other ways to pay expenses when the debt ceiling is reached otherwise, there is a risk the U.S. will default on its debt.
Housing Permits – Housing permits are a type of authorization that must be granted by a government or other regulatory body before the construction of a new or existing home can legally occur.
Existing home sales – Existing home sales transaction data measure and report sales and prices of existing single-family homes, condos, and co-ops for the United States, and is broken down by region: West, Midwest, South, and Northeast.
Basis Points (bps) – A basis point is one hundredth of one percent, used chiefly in expressing differences of interest rates.
Leading Economic Indicators Conference Board – The components of The Conference Board Leading Economic Index for the U.S. include:
- Average weekly hours in manufacturing – The average hours worked per week by production workers in manufacturing industries tend to lead the business cycle because employers usually adjust work hours before increasing or decreasing their workforce.
- Average weekly initial claims for unemployment insurance – The number of new claims filed for unemployment insurance are typically more sensitive than either total employment or unemployment to overall business conditions, and this series tends to lead the business cycle.
- Manufacturers’ new orders for consumer goods and materials – These goods are primarily used by consumers. The inflation-adjusted value of new orders leads actual production because new orders directly affect the level of both unfilled orders and inventories that firms monitor when making production decisions.
- ISM Index of New Orders – This index reflects the levels of new orders from customers. As a diffusion index, its value reflects the number of participants reporting increased orders during the previous month compared to the number reporting decreased orders, and this series tends to lead the business cycle.
- Manufacturers’ new orders for nondefense capital goods excluding aircraft orders – This index, combing with orders from aircraft (in inflation-adjusted dollars) are the producers’ counterpart to consumer goods and materials.
- Building permits for new private housing units – The number of residential building permits issued is an indicator of construction activity, which typically leads most other types of economic production.
- S&P 500 Index of Stock Prices – The Standard & Poor’s 500 stock index reflects the price movements of a broad selection of common stocks traded on the New York Stock Exchange.
- Leading Credit Index – This index is consisted of six financial indicators: 2-years Swap Spread (real time), LIBOR 3 month less 3 month Treasury-Bill yield spread (real time), Debit balances at margin account at broker dealer (monthly), AAII Investors Sentiment Bullish (%) less Bearish (%) (weekly), and Senior Loan Officers C&I loan survey
- Interest rate spread (10-year Treasury bonds less federal funds rate) – The spread or difference between long and short rates is often called the yield curve.
- Average consumer expectations for business condition – This index reflects changes in consumer attitudes concerning future economic conditions.
IMPORTANT DISCLOSURES
The views and opinions included in these materials belong to their author and do not necessarily reflect the views and opinions of NewEdge Capital Group, LLC.
This information is general in nature and has been prepared solely for informational and educational purposes and does not constitute an offer or a recommendation to buy or sell any particular security or to adopt any specific investment strategy.
NewEdge and its affiliates do not render advice on legal, tax and/or tax accounting matters. You should consult your personal tax and/or legal advisor to learn about any potential tax or other implications that may result from acting on a particular recommendation.
The trademarks and service marks contained herein are the property of their respective owners. Unless otherwise specifically indicated, all information with respect to any third party not affiliated with NewEdge has been provided by, and is the sole responsibility of, such third party and has not been independently verified by NewEdge, its affiliates or any other independent third party. No representation is given with respect to its accuracy or completeness, and such information and opinions may change without notice.
Investing involves risk, including possible loss of principal. Past performance is no guarantee of future results.
Any forward-looking statements or forecasts are based on assumptions and actual results are expected to vary from any such statements or forecasts. No assurance can be given that investment objectives or target returns will be achieved. Future returns may be higher or lower than the estimates presented herein.
An investment cannot be made directly in an index. Indices are unmanaged and have no fees or expenses. You can obtain information about many indices online at a variety of sources including: https://www.sec.gov/fast-answers/answersindiceshtm.html or http://www.nasdaq.com/reference/index-descriptions.aspx.
All data is subject to change without notice.
© 2024 NewEdge Capital Group, LLC


