

Don’t you call this a regular jam
I’m gonna rock this land
I’m gonna take this itty-bitty world by storm
And I’m just getting warm
I’m gonna knock you out (Huuh)
Mama said knock you out (Huuh)
– Mama Said Knock You Out, LL Cool J
In a brisk about-face in February, the bond market decided to agree with the Fed. Recent unexpectedly strong economic data knocked out expectations for coming Fed easing that were far too benign, resulting in yields now fully adjusting to the Fed’s published path of interest rates from December.
Looking ahead, what is the risk of an even larger knockout from strong data for yields (pushing yields higher)? The market and the Fed may finally be in an agreement but that could be short-lived. Fed members are recognizing that there is a possibility the economy, and thereby inflation, are running away from them and that may require a higher Fed funds rate.
It underscores several important themes for bonds in the year ahead.
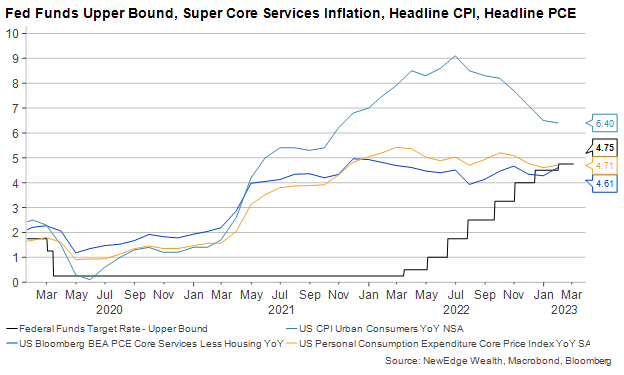
Despite a record pace of tightening, the Fed is still not ahead of the curve. The Fed funds rate is just barely above the Fed’s newly preferred “super core” inflation, which measures core services inflation without accounting for rent and housing.
Compared to headline inflation, Treasury yields are still well below the headline CPI and PCE, suggesting that rates are not yet “restrictive”, the level of interest rates that slows down the entire economy.
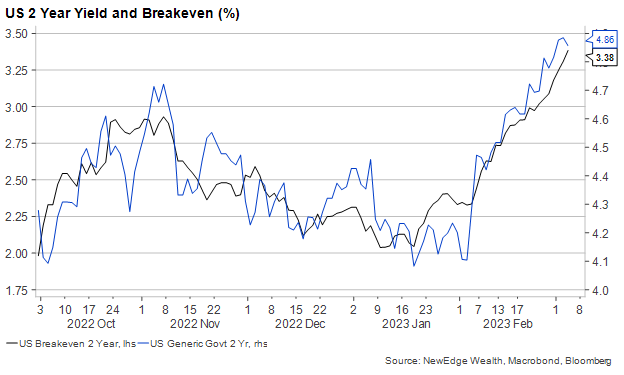
In the inflation-linked bond market, 2-Year real yields (the nominal Treasury yield minus inflation), have recently declined while the 2-Year nominal Treasury yield rose sharply. As a result, inflation expectations for the next few years are now above 3 percent.
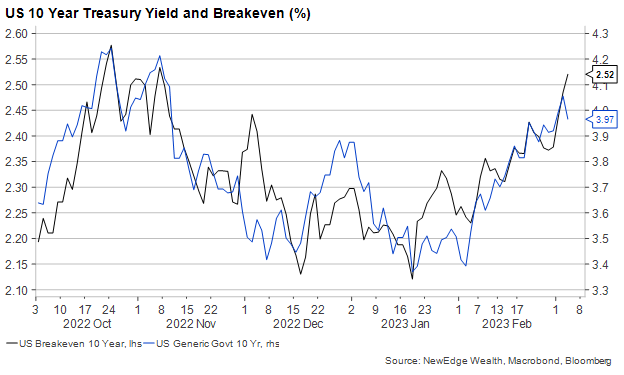
At the longer end of the yield curve, 10-Year yields have risen in tandem with the rise of inflation expectations. The bond market is pricing an inflation risk premium to account for a stronger economy that is also not experiencing as consistent and broad of a “disinflation” dynamic as previously thought.
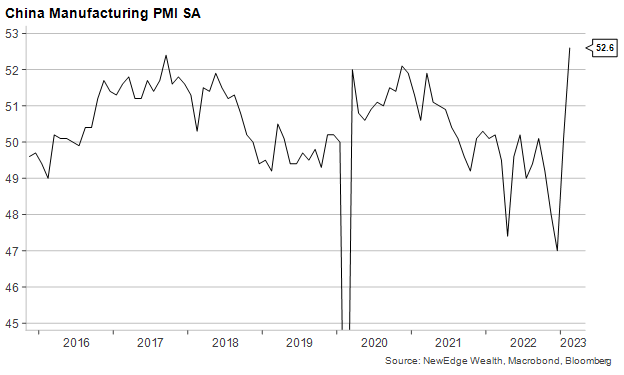
A major factor playing in all of this is the reopening of the Chinese economy which, despite initial doubts, is gaining steam rapidly. The Purchasing Manager Indices (PMI) in China showed strength across the board in February, and we can begin to see this strength filtering through in Asian and European PMIs, which have moved back into expansionary territory.
The China reopening is pushing out the prospect of a global recession, while inflation is showing signs of a potential renewed momentum to the upside. A vivid example was the ISM manufacturing prices paid which jumped above 50 for the first time since September, knocking out the entire disinflationary period from the Fall when 10-Year yields peaked. The ISM services index showed strength in all categories, including prices, further lifting the inflation risks ahead.
As Fed governor Waller (following Forrest Gump) framed it, inflation is like a box of chocolates, you never know what you’re going to get. The uncertainty about the peak in inflation has the bond market carefully pricing a higher terminal rate (which is the funds rate the market thinks will be the peak of the tightening cycle).
The yield curve could experience a period of “bear steepening” which means that longer-maturity yields rise more than short-term rates. The impact of such a steepening is almost immediate in the housing market where mortgage rates above 7 percent have seen a collapse in new home mortgage applications to a 28-year low.
But the broader economy has so far coped with higher rates. Coupled with a swift reopening of China, there is torque under the economy that may result in a scenario of Treasury yields higher than what was envisioned.
For a fixed-income strategy, it requires paying extra attention to the diversification of “duration” which measures the sensitivity of the value of the portfolio to the change in interest rates. Even though yields are rising by about the same across the curve, there are differentiated opportunities in to capture returns.
We believe fixed income has six potential return opportunities in 2023:
- Reinvestment return: The rolling of 1-month to 6-month Treasury bills can capture a positive reinvestment return, provided that in the next six months the Fed raises rates. An additional benefit of laddering of 1-month to 6-month T-bills is portfolio volatility is reduced.
- High-quality return: Bonds issued by companies that can sustain margins by passing on higher prices to end consumers, therefore generating a high free cash flow and presenting an attractive alternative to Treasuries.
- Tax-equivalent return: Municipal bonds issued by states that have a budget surplus and large rainy-day funds are at a tax-equivalent yield average of 5% for 1 to 3-year maturities.
- Selective return: High Yield offers opportunities in economically sensitive sectors such as consumer discretionary and energy while emerging markets such as Brazil offer double-digit yields.
- Alpha return: As yields are likely to rise, we recommend to remain underweight portfolio duration relative to the benchmark index by allocating less to long-maturity Treasury and corporate bonds and more to short-maturity Treasuries and T-bills.
- Dislocation opportunistic return: There is a dislocation building in high-quality, high-rated long-maturity bonds that are trading at $0.60 to $0.80 cents on the dollar which is considered distressed prices. The underlying default risk is low because the companies issuing these bonds have abundant liquidity, positive free cash flow, and are A-rated or better.
These six return categories are not without risks, but we believe they provide potential opportunities for investors that seek stability and income. Those are the two prime characteristics of fixed income that have historically proven to deliver consistently, “knock-out” type performance over a long period of time.
Top Points of the Week
By Cameron Dawson, Jay Peters, and Ben Emons
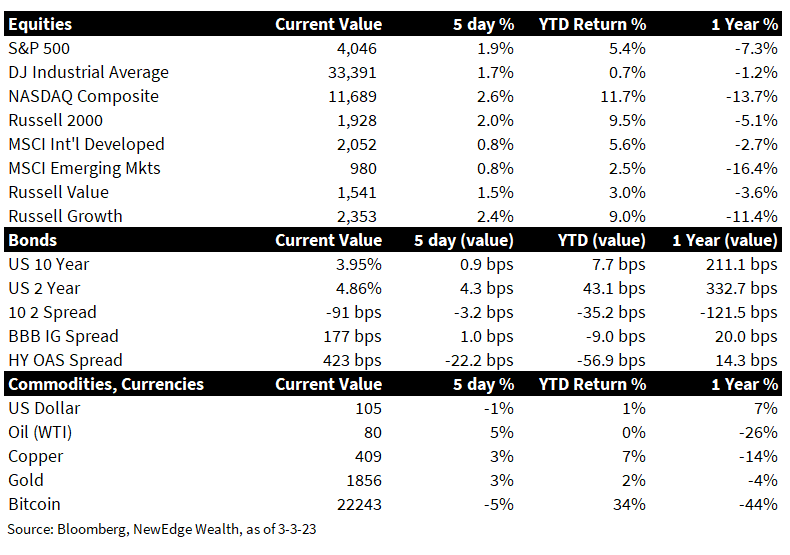
- Stocks Rally: Stocks regained their footing this week, snapping their weeks-long losing streak with positive returns across the board for global markets. U.S. indices outperformed non-U.S. developed and emerging markets. The U.S. market was led higher by the NASDAQ, which is a notable divergence given the rise in yields this week as well (NASDAQ and Growth stock valuations have historically been more negatively sensitive to increases in yields).
- Yields Rise above 4%: Treasury yields rose above 4 percent across the yield curve for the first time since October. The significance that yields rising for every maturity is that the bond market prices in a Fed that will stay at 4 percent or higher for a prolonged period. The yield curve inversion reached more than 90 basis points and the 1Y Treasury note yield reached 5.22%. The pricing of Fed hikes saw a terminal rate, the funds rate the market thinks when tightening ends, hit 5.5% after the stronger ISM.
- U.S. Earnings Season: 98% of the S&P companies have reported earnings, with 68% beating estimates (below the 10-year average of 73%). Aggregate EPS was -4.7% in 4Q22, while revenues rose +5.4%, displaying the impact of 100 bps of margin compression in the quarter. The Energy sector was the largest contributor to the top and bottom-line growth in 4Q22, while the S&P 500 would have posted -9% YoY EPS ex-Energy. For 1Q23, analysts now expect a -6% decline. For full year 2023, analysts expected a -2% decline to $223. On guidance, 78% of companies have provided negative quarter guidance for 1Q23, well above the average of 59% over the past 5 years.
- Fed and ECB speakers: Several Fed members like Bostic, Waller and Logan signaled the Fed may go further than what is currently priced in by Fed funds futures. A nuance appeared, however, between a non-voting member such as Bostic who continues to see a case for pause once rates reach 5 to 5.25% and Waller, who is concerned that inflation may resurge and that would require further tightening. ECB speakers warned a second consumer price shock may be underway from higher wages, fiscal stimulus, and lower gas prices.
- Strong ISM Data: The China PMI surprised expectations with a major rebound in manufacturing and services (52.6 and 56.3 respectively compared to 50. 7 and 54.9 expected). A similar jump in PMI was seen in Asia and even in Italy where manufacturing rose back into expansionary territory. The ISM manufacturing prices paid—the gauge of what purchasing managers expect where input prices will be—hit 51.5 and 56.5, the highest in six months. The surveys indicate that purchasing managers expect a further rebound in activity, defying recession expectations.
- Hot US Jobs and Wages: The U.S. job market remains tight with this week’s initial jobless claims yet again coming in below expectations (190k vs. 195k consensus), while continuing claims remained benign and below expectations as well (1.655m vs. 1.669m consensus). Labor inflation remains hot, with unit labor costs for 4Q22 coming in well above expectations (3.2% vs. 1.6% consensus).
- China reopening: The second-largest economy is reopening quicker and activity data, including traffic and congestion indicators, are back to pre-pandemic. The upcoming data in retail sales, industrial production, and trade by mid to late March are of key focus to gauge if the swift reopening momentum is sustained.
- Central banks ahead: Next week kicks off the next round of major central bank meetings, starting in Australia, Canada, and Japan. The Bank of Japan is of interest to markets as it is the final meeting of the current bank governor Kuroda. Although he is expected to announce changes in current policy ahead of the new governor Ueda, he could, nonetheless, surprise markets by providing views on how long yield curve control may continue in the wake of rising inflation.
- Coming Up Next Week (Payrolls): The non-farm payrolls will be of focus. The January report of 517K jobs was an outlier and economists forecast for February less than half the gains at 200K. The labor markets indicators such as weekly jobless claims and ISM employment point to robust growth, and the releases of job openings (JOLTS) and payroll processing ADP are of equal relevance for the momentum of the labor market.
- Coming Up Next Week (Powell): The Fed chair testifies before the Senate Banking Committee on Tuesday. The monetary policy flagged a determination to achieve price stability at the least expense of durable employment. Powell is likely to address current inflation that is still too high and therefore the Fed’s job is not done and why pausing or even cutting rates is premature.
IMPORTANT DISCLOSURES
Abbreviations: 10 2 spread: 10-2 Year Treasury Yield Spread; Bostic: Raphael Bostic, President of the Federal Reserve Bank of Atlanta; CPI: Consumer Price Index; ECB: European Central Bank; EPS: Earnings per Share; ISM Manufacturing PMI: Institute for Supply Management Purchasing Managers Index; JOLTS: Job Openings and Labor Turnover Survey; Kuroda: Haruhiko Kuroda, Governor of the Bank of Japan; Logan: Lorie Logan, President of the Federal Reserve Bank of Dallas; PCE: personal consumption expenditures; Powell: Jerome Powell, Chair of the Board of Governors of the Federal Reserve System; Ueda: Kazuo Ueda, nominee for governor of the Bank of Japan; Waller: Christopher Waller, member of the Federal Reserve Board of Governors.
Index Information: All returns represent total return for stated period. S&P 500 is a total return index that reflects both changes in the prices of stocks in the S&P 500 Index as well as the reinvestment of the dividend income from its underlying stocks. Dow Jones Industrial Average (DJ Industrial Average) is a price-weighted average of 30 actively traded blue-chip stocks trading New York Stock Exchange and Nasdaq. The NASDAQ Composite Index measures all NASDAQ domestic and international based common type stocks listed on the Nasdaq Stock Market. Russell 2000 is an index that measures the performance of the small-cap segment of the U.S. equity universe. MSCI International Developed measures equity market performance of large, developed markets not including the U.S. MSCI Emerging Markets (MSCI Emerging Mkts) measures equity market performance of emerging markets. Russell 1000 Growth Index measures the performance of the large- cap growth segment of the US equity universe. It includes those Russell 1000 companies with relatively higher price-to-book ratios, higher I/B/E/S forecast medium term (2 year) growth and higher sales per share historical growth (5 years). The Russell 1000 Value Index measures the performance of the large cap value segment of the US equity universe. It includes those Russell 1000 companies with relatively lower price-to-book ratios, lower I/B/E/S forecast medium term (2 year) growth and lower sales per share historical growth (5 years). The BBB IG Spread is the Bloomberg Baa Corporate Index that measures the spread of BBB/Baa U.S. corporate bond yields over Treasuries. The HY OAS is the High Yield Option Adjusted Spread index measuring the spread of high yield bonds over Treasuries. ISM manufacturing prices paid is a diffusion index of ISM Manufacturing PMI calculated by adding the percent of responses indicating they paid more for inputs plus one-half of those responding that they paid the same for inputs. The Services ISM Report on Business is based on data compiled from purchasing and supply executives nationwide. Membership of the Services Business Survey is diversified by NAICS, based on each industry’s contribution to gross domestic product (GDP).
The views and opinions included in these materials belong to their author and do not necessarily reflect the views and opinions of NewEdge Capital Group, LLC.
This information is general in nature and has been prepared solely for informational and educational purposes and does not constitute an offer or a recommendation to buy or sell any particular security or to adopt any specific investment strategy.
NewEdge and its affiliates do not render advice on legal, tax and/or tax accounting matters. You should consult your personal tax and/or legal advisor to learn about any potential tax or other implications that may result from acting on a particular recommendation.
The trademarks and service marks contained herein are the property of their respective owners. Unless otherwise specifically indicated, all information with respect to any third party not affiliated with NewEdge has been provided by, and is the sole responsibility of, such third party and has not been independently verified by NewEdge, its affiliates or any other independent third party. No representation is given with respect to its accuracy or completeness, and such information and opinions may change without notice.
Investing involves risk, including possible loss of principal. Past performance is no guarantee of future results.
Any forward-looking statements or forecasts are based on assumptions and actual results are expected to vary from any such statements or forecasts. No assurance can be given that investment objectives or target returns will be achieved. Future returns may be higher or lower than the estimates presented herein.
An investment cannot be made directly in an index. Indices are unmanaged and have no fees or expenses. You can obtain information about many indices online at a variety of sources including: https://www.sec.gov/fast-answers/answersindiceshtm.html.
All data is subject to change without notice.
© 2024 NewEdge Capital Group, LLC


