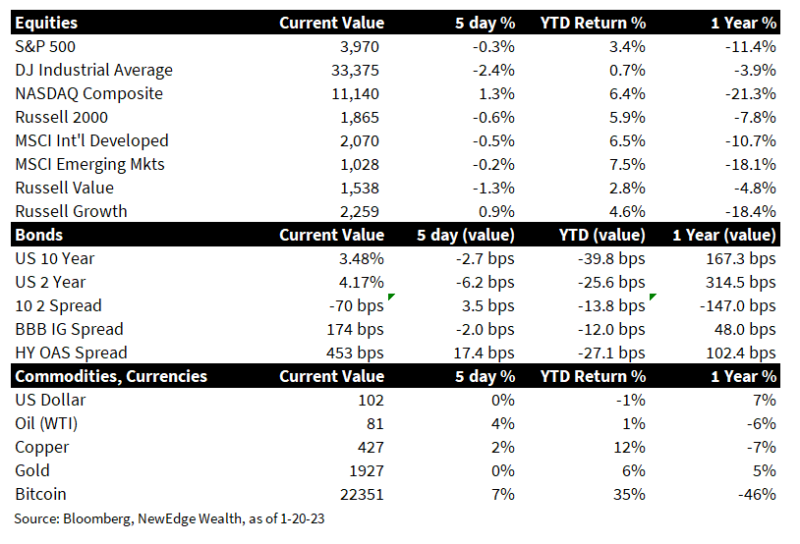
1. Stocks Stall: After a roaring rally for the first two weeks of 2023, global equity markets stalled, posting their first down week of the year. U.S. markets fared the worst, while International Developed and Emerging Markets were relatively resilient, continuing the late-2022 run of non-U.S. outperformance.
2. Yields Fall: U.S. Treasury yields fell slightly on the week, partially due to rising recession fears (Treasury yields often fall leading up to a recession as investors flock to safe assets and price in easier monetary policy).
3. U.S. Earnings Season: The 4Q22 earnings season continued this week, with 11% of the S&P 500 now having reported. 55% of companies have beat on sales, while 70% of companies have beat on earnings (EPS). According to FactSet, the 10-year average beat rate for EPS is 77%. Over half of the S&P 500 will report earnings over the next two weeks.
4. The Return of Bad News is Bad News?: In the first two weeks of 2023, investors seemed to cheer weaker data as a sign of coming Fed support (bad news is good news), but there was a marked shift this week when weak retail sales data sparked a sell-off in equities. Retail Sales for December declined more than expected (Retail Sales Ex Autos and Gas -0.7% month-over-month vs. 0.0% consensus). The regional Empire Manufacturing survey showed acute weakness (-32.9 vs. -8.7 consensus), falling to the same low level experienced during the Great Financial Crisis in 2009. There were slight silver linings in both the Empire and Philadelphia manufacturing surveys, with both indices showing an improvement in the six-month forward outlook.
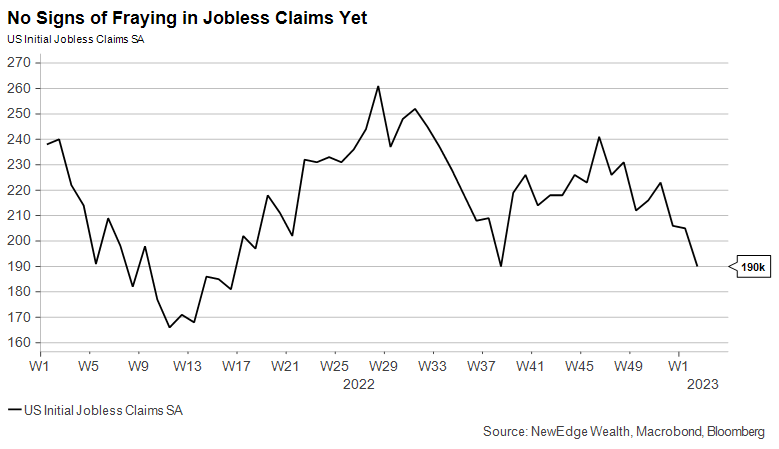
5. The U.S. Labor Market Remains Tight: Despite pockets of weaker data, the U.S. labor market remains resilient and notably tight. This week’s Initial Jobless Claims of 190k (vs. 214k consensus) hit a multi-year low for this time of the year, even below the very tight labor markets of 2018, 2019, and 2022. Continuing Jobless Claims came in below expectations as well (1.647M vs. 1.655M). We have yet to see the impact in the broad data of high-profile layoffs concentrated in the Technology sector (there were two more announcements this week, with Google and Microsoft both adding to job cuts).
6. Inflation Data Continue to Slow: U.S. Producer Price Index (PPI) data for December came in below expectations and showed continued signs that pandemic-era inflation is abating. The year-over-year Final Demand PPI slowed to 6.2% (vs. 6.8% consensus and down from a peak of 11.2% in March 2022), while the month-over-month fell -0.5% (vs. -0.1% consensus). Notably, the majority of this month-over-month decline was due to falling energy prices, resulting in the Core PPI (ex food and energy) still increasing +0.1% (vs. +0.1% consensus).
7. Fed Speakers Sticking to Their Hawkish Guns: The week was filled with Fed speak from multiple Governors (Williams, Bostic, Harker, Brainard, Collins, Logan, and Waller). The Fed speak was all-together hawkish with members continuing to emphasize that the Fed’s job is not done on inflation, the intention/need to get rates to or above 5%, and no desire to prematurely cut rates in 2023 (unlike current bond market pricing for a sub-5% terminal rate and ~40 bps of cuts in 2H23). Governors did signal a desire to slow hikes going forward, likely to 25 bps at the next meeting (the bond market is pricing in a 25 bps hike). Stocks rallied late Friday after Waller signaled that rates were close to being in restrictive territory
8. U.S. Debt Ceiling Showdown: The U.S. hit its debt limit on Thursday, causing fears that a repeat of 2011’s ugly debt ceiling fight could be repeated in 2023. The Treasury is currently using “extraordinary measures” to prevent breaching the debt limit, but there is uncertainty about how long these measures can be employed. Wells Fargo estimates that these measures will be exhausted as soon as July. This July showdown timing is reflected in bond market pricing, with Treasury Bill (T-Bill) yields for July jumping higher. The 2011 Debt Ceiling debate was a short-term negative for stocks (the S&P dropped -15% that summer during the showdown).
9. Bank of Japan Surprises with No Change to Yield Curve Control Despite Rising Inflation: The Bank of Japan (BOJ) surprised the market by announcing no change to its Yield Curve Control (YCC) policy (a stimulative monetary policy tool that works to peg the Japanese 10 Year bond yield to 1% through the central bank’s buying of bonds). This caused a slight weakening in the Yen vs. the U.S. Dollar. Japan’s Nationwide Consumer Price Inflation (CPI) rose to 4% in December, the highest level since 1981.
10. Coming Up Next Week: All eyes will be on earnings next week, with 89 S&P 500 companies reporting their 4Q22 earnings (it is a heavy week for Industrial companies, which can provide insight into the health and outlook of cyclical manufacturing and construction industries). There is no Fed speak next week, with the Fed in its blackout period prior to its policy meeting the following week. One economic data, watch for the initial read on 4Q22 U.S. GDP on Thursday (2.6% cons vs. Atlanta Fed GDPNow currently at 3.5%), while PCE inflation data will be released on Friday (PCE MoM 0.0% cons, YoY 5% cons). We will continue to watch labor data for any sign of Tech layoffs showing up in the broad numbers.

Views from the CIO Office
Can the “Last Shall Be First” Trade Last?
Cameron Dawson, CFA®
Often at the beginning of a new calendar year the prior year’s winners lag coming out of the gate, while the prior year’s losers stage a relief rally and outperform.
One reason that this rebound regularly happens is because investors repurchase positions that they sold for tax losses at the end of the prior year. There is an aspect of “mean reversion”, where assets that got oversold (they moved too far too fast to the downside) into year-end stage a temporary rebound and shorts (bets that the stock will go down) are covered.
This has certainly happened to begin 2023, with those parts of the market that were bludgeoned in 2022 now posting the best performance to start the year. For example, YTD the NASDAQ Composite +5%, ARKK Innovation +15%, and Bitcoin +29%. These rallies hardly make a dent recovering recent losses, however, following the abysmal 2022 with NASDAQ Composite -33%, ARKK Innovation -67%, and Bitcoin -65%.
We also see last year’s winners lagging to start the year, such as the more Value-oriented Dow Jones Industrial -0.7% YTD, after having declined (only) -9% in 2022.
The question as we look to the remainder of 2023 is: has enough changed in the macro environment that the recent relief rallies in last year’s losers can continue?
We don’t think so and the reason is continued tight liquidity.
First, we note that 2023 may not see the same degree of price drops as 2022 simply because a great deal of the bubbly air that was in speculative asset class prices was already let out over the course of 2022’s deep market rout.
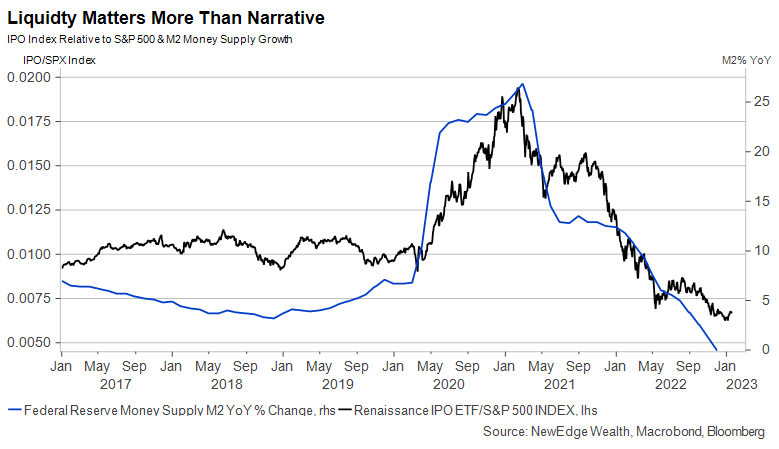
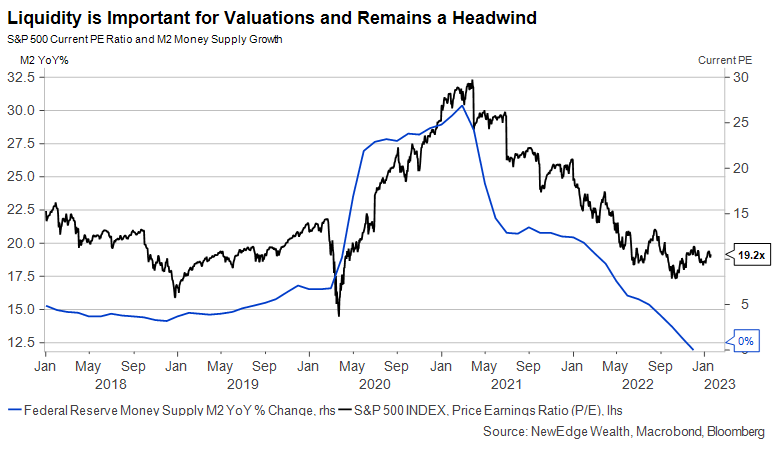
Ultra-loose liquidity was the most powerful tailwind for speculative, high valuation, high Growth, low/no earnings assets in 2020 and 2021, while tightening liquidity in 2022 was the biggest headwind to these same assets. To start 2023, we do not see signs that the liquidity backdrop is improving enough to drive a sustained recovery in these assets (meaning rallies that go beyond just short covering and technical bounces).
To put this in perspective, in 2020-2021, the Fed Funds rate was 0%, the Fed’s balance sheet expanded nearly $5T, and M2 money supply growth reached a peak of 27%. Today the Fed Funds rate is likely on its way to 5%, the Fed’s balance sheet is set to shrink $1T over the course of 2023, and M2 Money Supply Growth is 0%.
It is no coincidence that the peak in money supply growth in March 2021 coincided precisely with the peak in relative performance vs. the S&P 500 of speculative assets like ARKK, the IPO index, and Bitcoin. Further, the peak in M2 growth also coincided with the peak in the S&P 500’s trailing PE multiple. Liquidity matters more than narrative and is a key driver of valuations.
So, as we start 2023, we see no change to the liquidity backdrop that would spark us to chase recent rallies in liquidity-sensitive parts of the market.
Relief rallies are commonplace in downtrends and can be disorienting. Take the NASDAQ in the early-2000’s for an example. Over the course of a bruising nearly 80%-down bear market, the NASDAQ staged five massive relief rallies of over 30% (one as high as 51% in late 2001, which brought the NASDAQ above its all-import 200 day moving average, only to roll over and continue the bear for another 9 months).
We are always on the look out for early signs of trend changes, and when markets move sharply, we always ask ourselves the question, “has anything changed?” and if so, “should we change?”. For now, not enough has changed in the liquidity environment to suggest that recent strength in 2022’s laggards is anything more than short-term relief rally driven by technicals and positioning.
And so, we keep top of mind the recent words from Chris Verrone, Strategas’ Technical analyst and a true market sage: “don’t confuse mean reversion for trend change”.
Charts of the Week


The Weekly Summary:
A Deeper Dive into the Past Week

“Anticipation”
persistent and “sticky.” We trust that evidence of slowing wage growth and a “cooling” U.S. labor market has begun to emerge. In last week’s commentary, we highlighted the reasons why we thought that the Fed most likely would “skip” hiking the federal funds at its June 13-14 meeting. Financial markets mostly have priced in now this probability, and the consensus now is that a July hike is most likely. Nevertheless, a lack of conviction has fostered many divergent opinions. The minutes of the Fed’s last meeting continue to show that the Fed’s staff continues to “anticipate” a mild U.S. recession. Many analysts and investors seem to agree. Others – including Fed chair Powell – think a recession can still be averted.
IMPORTANT DISCLOSURES
Abbreviations: 10 2 spread: 10-2 Year Treasury Yield Spread; EPS: Earnings per Share; Fedspeak: refers to speeches about monetary policy given by members of the U.S. Federal Reserve Bord of Governors. PCE: personal consumption expenditures; ARKK Innovation is an ETF that focuses on disruption innovation (the introduction of a technologically enable new product or service that potentially changes the way the world works); IPO Index is is a stock market index based upon a portfolio of newly public companies listed on non-U.S. exchanges; M2 is the Federal Reserve’s estimate of the total money supply including all of the cash people have on hand plus all of the money deposited in checking accounts, savings accounts, and other short-term saving vehicles.
Index Information: All returns represent total return for stated period. S&P 500 is a total return index that reflects both changes in the prices of stocks in the S&P 500 Index as well as the reinvestment of the dividend income from its underlying stocks. Dow Jones Industrial Average (DJ Industrial Average) is a price-weighted average of 30 actively traded blue-chip stocks trading New York Stock Exchange and Nasdaq. The NASDAQ Composite Index measures all NASDAQ domestic and international based common type stocks listed on the Nasdaq Stock Market. Russell 2000 is an index that measures the performance of the small-cap segment of the U.S. equity universe. MSCI International Developed measures equity market performance of large, developed markets not including the U.S. MSCI Emerging Markets (MSCI Emerging Mkts) measures equity market performance of emerging markets. Russell 1000 Growth Index measures the performance of the large- cap growth segment of the US equity universe. It includes those Russell 1000 companies with relatively higher price-to-book ratios, higher I/B/E/S forecast medium term (2 year) growth and higher sales per share historical growth (5 years). The Russell 1000 Value Index measures the performance of the large cap value segment of the US equity universe. It includes those Russell 1000 companies with relatively lower price-to-book ratios, lower I/B/E/S forecast medium term (2 year) growth and lower sales per share historical growth (5 years). The “BBB IG Spread” is the Bloomberg Baa Corporate Index that measures the spread of BBB/Baa U.S. corporate bond yields over Treasuries. The HY OAS is the High Yield Option Adjusted Spread index measuring the spread of high yield bonds over Treasuries. The Empire Fed Manufacturing Survey is a monthly survey of manufacturers in New York State conducted by the Federal Reserve Bank of New York with readings above 50 signaling expansion and below 50 contraction.
The views and opinions included in these materials belong to their author and do not necessarily reflect the views and opinions of NewEdge Capital Group, LLC.
This information is general in nature and has been prepared solely for informational and educational purposes and does not constitute an offer or a recommendation to buy or sell any particular security or to adopt any specific investment strategy.
NewEdge and its affiliates do not render advice on legal, tax and/or tax accounting matters. You should consult your personal tax and/or legal advisor to learn about any potential tax or other implications that may result from acting on a particular recommendation.
The trademarks and service marks contained herein are the property of their respective owners. Unless otherwise specifically indicated, all information with respect to any third party not affiliated with NewEdge has been provided by, and is the sole responsibility of, such third party and has not been independently verified by NewEdge, its affiliates or any other independent third party. No representation is given with respect to its accuracy or completeness, and such information and opinions may change without notice.
Investing involves risk, including possible loss of principal. Past performance is no guarantee of future results.
Any forward-looking statements or forecasts are based on assumptions and actual results are expected to vary from any such statements or forecasts. No assurance can be given that investment objectives or target returns will be achieved. Future returns may be higher or lower than the estimates presented herein.
An investment cannot be made directly in an index. Indices are unmanaged and have no fees or expenses. You can obtain information about many indices online at a variety of sources including: https://www.sec.gov/fast-answers/answersindiceshtm.html.
All data is subject to change without notice.
© 2024 NewEdge Capital Group, LLC


