

Weekly Summary: November 28 – December 2
Key Observations:
- Federal Reserve (Fed) chair Powell enunciates new “balancing of risk” approach to determine pace of further hikes in federal funds rate and to determine how long to hold rates at a “sufficiently restrictive” level to achieve the Fed’s targeted 2% rate of inflation. We view this new focus as diminishing the risk of the Fed “over-tightening.” Powell appears more adverse to over-tightening. He wants to avoid being put in a position where a rate cut would be needed.
- The general trends of a slowing U.S. economy, along with signs of dissipating inflation trends that we have highlighted in many of our commentaries, were evident again this week. The most striking data this week, was the dramatic and very unexpected drop in Chicago’s [manufacturing] November PMI data. This is an example of why we anticipate more examples of “rapidity of change” that we have described as a “hallmark” of the period after the beginning of the pandemic and Russia’s attack of Ukraine. It is also an example of why more than one month’s data should be required before assumptions can be made.
- U.S. Q3 GDP data was revised higher to 2.9% from 2.6%. GDI (Gross Domestic Income) indicated a much lower rate of economic growth of 0.3%. We suspect that a more accurate reading of U.S. economic growth in Q3 probably lies somewhere in between. The distortions in economic data due to the effects from the pandemic and the Russia-Ukraine war have taught us to shy away from premature economic conclusions.
- The stronger than expected U.S. November nonfarm payroll data initially drove interest rates and USD higher and equities lower. As the day progressed, these initial responses became more muted. In our opinion, the initial response was exacerbated by financial markets having priced in a much weaker employment report. It appeared to us that the risk/reward dynamics no longer justified fully long 10-year Treasury positions with close to 3.5% yields. Likewise, we thought a DXY (USD index) level under 105 no longer justified a “fully” short USD stance. In general, we thought that financial markets’ later reactions were very encouraging for markets, at least in the short term. DXY closed lower on the day, with a close under 105. The 2-year Treasury yield rose only marginally on the day. Both the 10-year and 30-year Treasury yields closed lower on the day – the 10-year under 3.5% and the 30-year only marginally above 3.5%. The 2-10 year-yield curve inverted more on the day and closed close to its highest most recent inverted levels. Equities recouped most of their early losses, with two major U.S. equity indexes closing higher on the day.
The Upshot: Our general investment approach remains the same as depicted in last week’s commentary. We maintain our preference for big cap quality stocks with good balance sheets, relatively stable cash flows and stable margins. Volatility across sectors continues to be supportive of a diversified portfolio for long term investors. We continue to assume that the Fed will not cut the federal funds rate in 2023 unless there are very dramatic changes. We will not hesitate to change our opinion if circumstances change. In our November 18 commentary we explained why we saw a more challenging trading environment early next year. “During 2022, our principal concern revolved around inflation trends and the extent of the Fed’s monetary tightening. We now anticipate entering a period in the not-too-distant future of concerns over inflation and the Fed’s monetary tightening policies on the one hand, and escalating concerns over the extent of economic slowdown and the effect that a slowdown will have on margins and earnings.” Since shifts in sectors and asset classes could occur very swiftly, we continue to recommend well diversified portfolios for long term investors. We maintain our belief that U.S. inflation could dissipate in a more rapid manner than has been anticipated by the Fed and many investors and analysts. In our discussions below, we attempt to show that much of the current economic data could be subject to various interpretations. A flexible mindset will be a key to navigating financial markets.
Powell’s Speech Compared to Fed Minutes
This week was filled with a myriad of economic data that was “overwhelmed” by Federal Reserve chair Powell’s much-anticipated speech given at the Brookings Institution Wednesday afternoon. We thought on Wednesday morning that the financial markets were pricing in a more hawkish Powell speech. But as we indicated in our November 4 weekly, we thought that Powell was rather hawkish in his press conference after the Federal Open Market Committee (FOMC) monetary policy announcement on November 2, and was more hawkish than the official FOMC statement issued on that same day. We had a hard time imagining an even more hawkish Powell in his speech. In other words, we thought that the equity market had priced in a very hawkish Powell and was poised to rally at any sign of a less hawkish Powell. That is in fact what transpired. During and after Powell’s speech, equities had substantial rallies led by the tech sector, interest rates fell, the two-to-10-year Treasury yield curve extended its less-inverted trend of the prior few days even as it remained very inverted and the U.S. dollar (USD) fell as exemplified by the DXY USD index. Moreover, we characterized the minutes of the FOMC early-November meeting released mid last week as more dovish than Powell’s rhetoric of November 2. Those minutes indicated that “a substantial majority of participants judged that a slowing in the pace of increase would likely be appropriate.” The minutes also showcased the participants’ focus on the “lags” of their monetary policy changes. “Participants noted that, with regard to both real economic activity and inflation, it would take time for the full effects of monetary restraint to be realized and that these lags complicated an assessment of the effects of monetary policy.” As monetary policy approached a sufficiently restrictive level to rein in inflation, participants emphasized that the terminal federal funds rate was becoming more important than the pace of tightening. “Members [of the FOMC] agreed that, in determining the pace of future increases in the target range, they would take into account the cumulative tightening of monetary policy, the lags with which monetary policy affected economic activity and inflation, and economic and financial developments.” Much of Powell’s Brookings speech echoed most of the sentiments expressed in the minutes.
New Approach by Powell
As we highlighted in our November 4 weekly, the Powell of that week made it clear “that it would be preferable to err on the side of over-tightening. Powell remained confident that the Fed had the tools to ‘forcefully’ correct an over-tightening circumstance.” The Powell of this week was much more circumspect. This Powell was more about assessing and balancing the risks associated with over-tightening. Powell now believed that a “good” way to balance risks was to slow the pace of tightening and to “hold” rates for “sometime” when they were sufficiently restrictive to help the rate of inflation come back down to the Fed’s targeted 2% rate of inflation. This is the first time that we heard Powell speak in terms of managing risks. The slowing in the pace of hiking the federal funds rate and then “holding” at a “sufficiently restrictive level” was Powell’s new risk management technique. This Powell expressly stated that he wanted to avoid over-tightening and wanted to avoid a circumstance where the Fed would have to cut rates to correct for over-tightening.” Powell acknowledged that the path ahead for inflation remained “highly uncertain” and that he was skeptical of forecasts. Given the long and variable lag of policies, slowing the pace of rate hikes was a “good” way to take account of the difficulty forecasting. We characterize this new focus of Powell’s as his new “risk management” approach. We view this new approach as dramatically different from Powell’s prior statements. This new approach should reduce the chance of the Fed over-tightening and should make the Fed more data dependent. Powell also echoed the Fed minutes when he agreed that the terminal federal funds rate was now more important than the rate of hikes. At the same time, Powell acknowledged that he anticipated ongoing rate hikes and that the Fed “will stay the course until the job is done” of reaching the 2% targeted rate of inflation. The Fed had “more ground to cover,” i.e., more rate hikes.
Powell Views Core Inflation in Three Segments
For the first time, Powell also shared how he views core Personal Consumption Expenditures (PCE) inflation. He breaks it down into three pieces. The first two pieces are core goods inflation that was diminishing and housing services inflation, including rents and leases. Powell observed that new lease rates were falling sharply since mid-year and that he expected that rental inflation diminishing would be more evident next year. The third element of core PCE inflation was core services inflation, excluding housing. Wages make up most of the cost of this third segment and Powell therefore views this segment as perhaps the most “sticky” part of inflation. Powell thought that the current wage growth needs to decline between 1.5% and 2% to roughly a 3.5% wage growth to be consistent with a 2% inflation rate. Powell also commented briefly on the 353,000 decrease of job vacancies that was just released on the morning of his speech as part of the Job Openings and Labor Turnover Survey (JOLTS). The latest JOLTS report reflected data as of the last business day in October. The total number of job vacancies was now about 10.3 million, which is still high by historical standards but well off its recent high of more than 11.8 million from March 2022. Powell characterized the latest decrease in job vacancies as in line with expectations and as relatively “good” news for the labor market, as it indicates a less-tight labor market. Powell also was hopeful somewhat that perhaps the labor market could be brought better into balance between the demand and supply for workers as the job vacancies diminish. This might obviate part of the “need” to achieve a higher rate of unemployment so as to better balance the labor market.
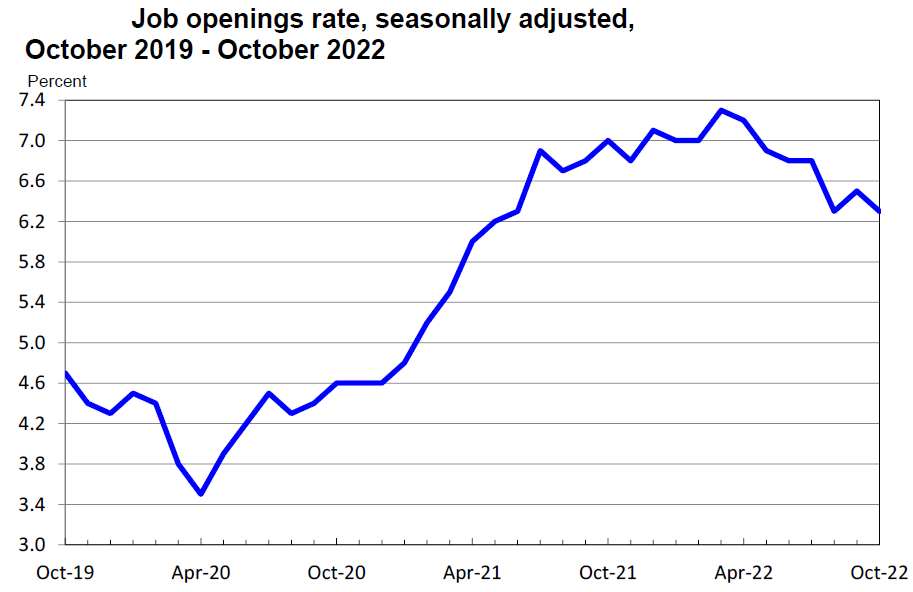
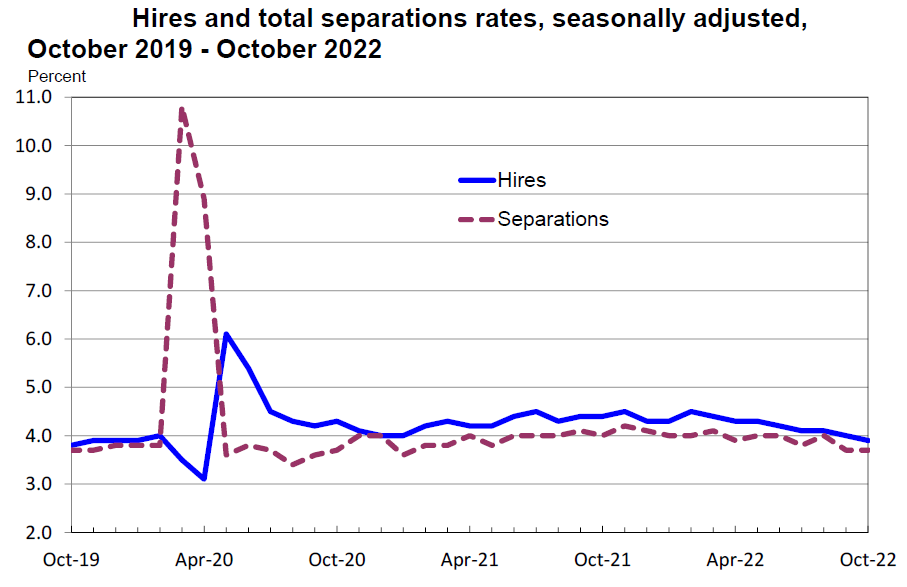
Source: US Department of Labor, Job Openings and Labor Turnover – October 2022 (11-30-2022)
Powell Seems Willing to Adapt – “Try Everything”
Powell’s willingness to change his approach in formulating the “correct” monetary policy reminded us of Shakira’s song “Try Everything.” In our opinion, this Fed has “gotten it wrong” many times. But Powell has shown a willingness to adapt. We hope that the lyrics “Nobody learns without getting it wrong” is applicable to the Fed. We can imagine that Powell could be thinking: “I won’t give up, I won’t give in; ‘Til I reach the end, and then I’ll start again; No, I won’t leave, I wanna try everything; I wanna try even though I could fail.”
Chicago PMI Vastly Disappoints
The general trends of a slowing U.S. economy, along with signs of dissipating inflation trends that we have highlighted in many of our commentaries, were evident again this week. The most striking data of the week was the dramatic and unexpected downturn in Chicago’s Purchasing Managers’ Index (PMI) that covers the business conditions across Illinois, Michigan and Indiana. Chicago’s November PMI tumbled from 45.2 in October to 37.2, and was significantly below an expected level of 47.0. This was the lowest reading of this series since May 2020. This is yet another example of “rapidity of change” that has been prevalent since the beginning of the pandemic. We will continue to expect more such examples that could occur at any time. Historically, this survey typically is interrelated with the Institute for Supply Management (ISM) manufacturing PMI that is a nationwide survey.
ISM Manufacturing PMI
The November ISM manufacturing PMI for the U.S. also disappointed, but on a less-drastic scale. This PMI dropped from 50.2 in October to 49, and also was lower than the expected level of 49.8. This was the first month since May 2020 that indicated a contraction of U.S. factory activity. New orders came in at 47.2 versus an expected 49.2 and the backlog of orders fell to 40. The employment index fell from 52.3 to 51.5. Price pressures eased again, dropping from 46.6 to 43.
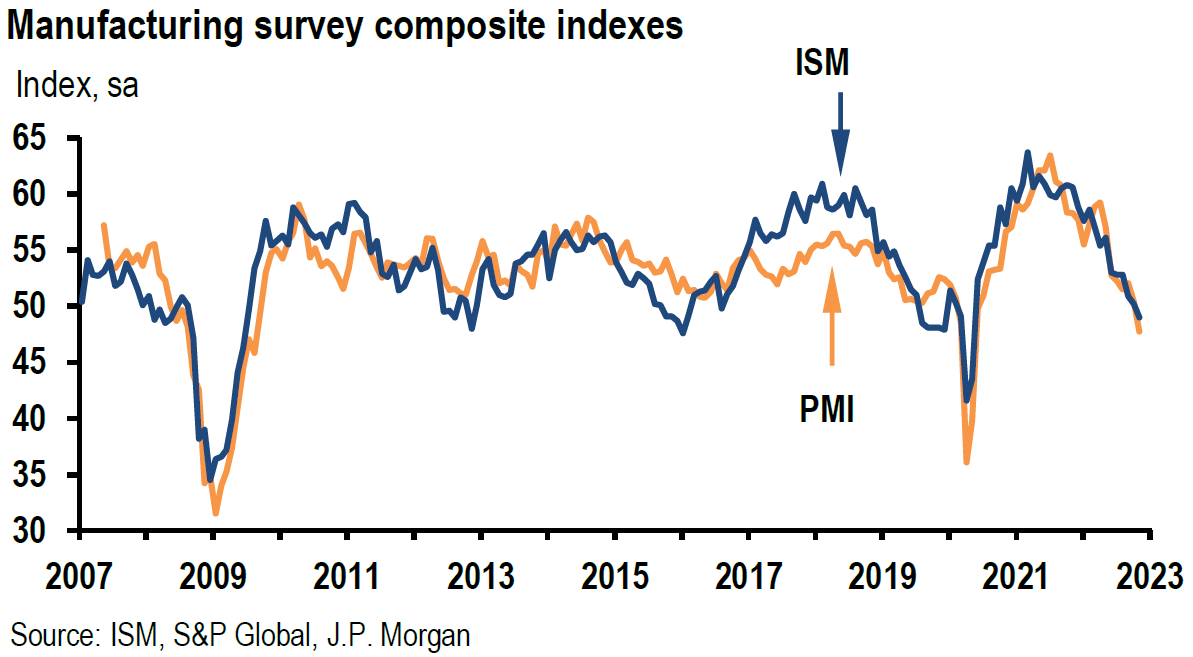
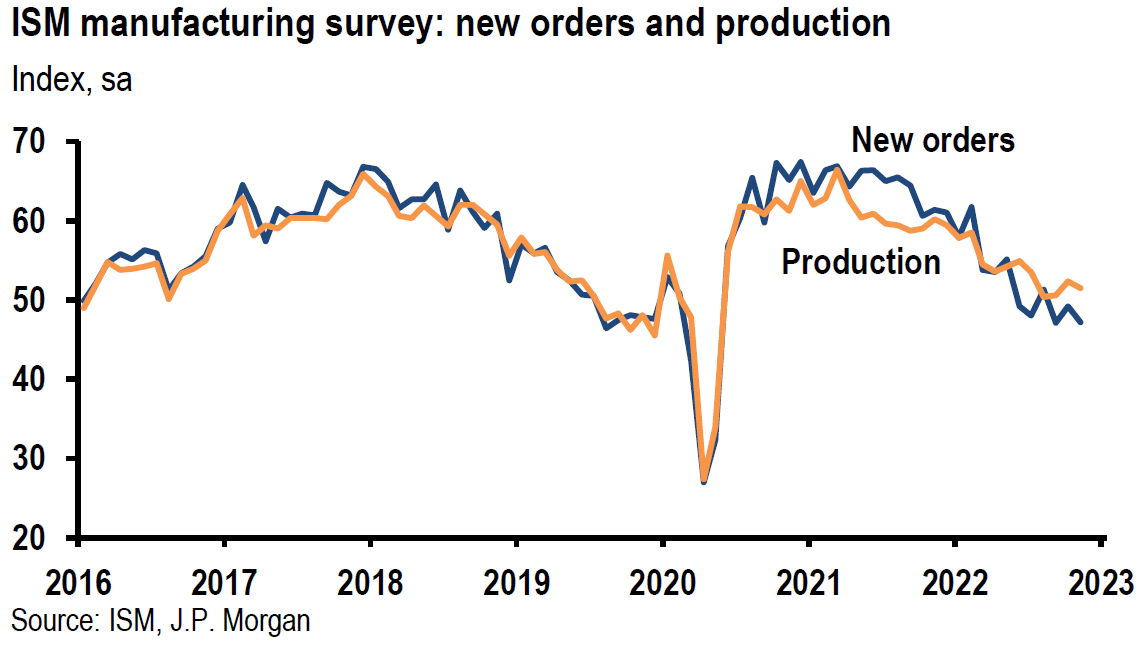
Source: JP Morgan, US: ISM manufacturing survey weakens again in November (12-1-2022)
S&P Global U.S. PMI
The November S&P Global U.S. manufacturing PMI also showed a deteriorating picture in U.S. manufacturing, dropping into contractionary territory for the first time since June 2020 – from 50.4 in October to 47.7. On a more positive note, the improvement in supplier performance was the first such improvement since October 2019 as cost pressures eased further. New orders fell at the fastest rate since May 2020. The chief business economist at S&P Global commented: “Companies are … cutting production at a rate not seen since the global financial crisis, if initial pandemic lockdowns are excluded.”
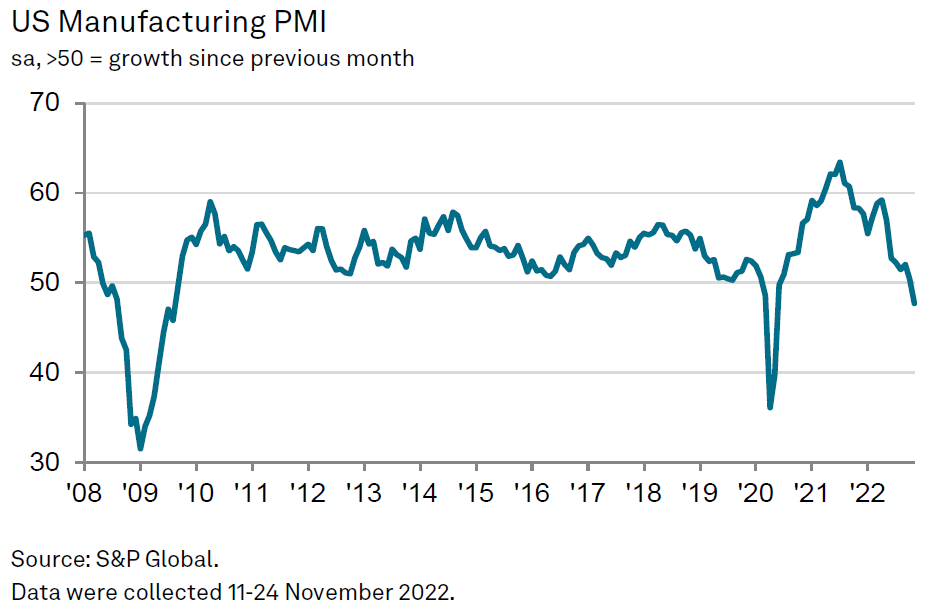
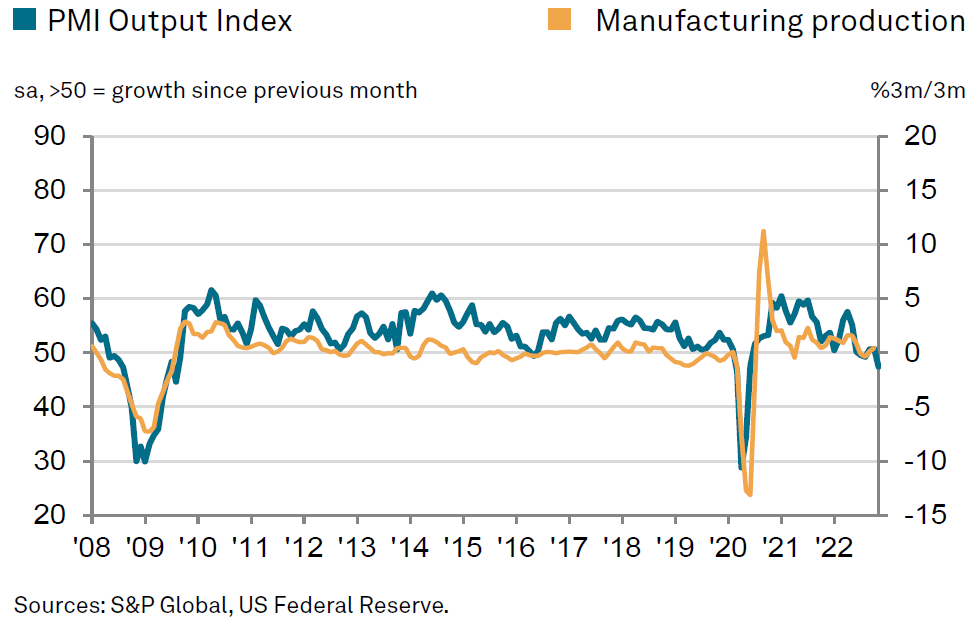
Source: S&P Global, S&P Global US Manufacturing PMI (12-1-2022)
Fed’s Beige Book
The Fed’s Beige Book also indicated a slowing of U.S. economic activity, as well as a slowing of price pressures, which is due mostly because of improvements in supply chains and weakening demand. Housing rent growth started to moderate in some Districts. Many contacts expressed greater uncertainty or increased pessimism concerning their outlook. Hiring and retention difficulties eased further even as labor markets were still described as tight. “Some contacts expressed a reluctance to shed workers in light of hiring difficulties even though their labor needs were diminishing.” The Beige Book is published eight times a year. It is a compilation of anecdotal evidence of business conditions since the prior Beige Book. The “evidence” is gathered by the Fed’s twelve regional banks in their respective Districts. The information in this latest Beige Book was gathered on or before November 23. U.S. economic activity was characterized generally as “about flat or up slightly” since the last report. The prior Beige Book publication characterized the U.S. economy as exhibiting a “modest average pace of growth.”
Conference Board Consumer Confidence
The Conference Board’s consumer confidence index decreased again in November as both the present situations and expectations indexes declined. The present situations index declined from 138.7 in October to 137.4. The expectations index declined from 77.9 to 75.4. The senior director of economic indicators at the Conference Board stated that a reading below 80 in the expectations index suggested the likelihood of a recession remains elevated. Inflation expectations for the next twelve months rose from an its October reading of 6.9% to 7.2% – their highest levels since July. The survey attributed the increase in twelve-month inflation expectations to the rise in gasoline and food prices. We have commented in prior commentaries of the inordinate influence of gasoline prices on consumers’ short term inflation expectations. We maintain that longer term inflation expectations remain “well-anchored.”
Weaker Housing Data
Most housing data analyzed this week continue to point to weakening housing trends. The Federal Housing Finance Agency (FHFA) reported a 0.1% U.S. house prices increase in Q3 versus Q2. The S&P Case-Shiller house price index of selling prices dropped 1.5% in September month-over-month (m/m) after dropping 1.6% m/m in August and 0.8% in July. The August drop was the biggest monthly decline since 2008. The September price increase in house sales was 10.4% higher year-over-year (y/y). Five months ago, annual price increases were over 20%.
U.S. pending home sales fell 4.5% m/m in October. This was the fifth consecutive month of declines. The 37.0% decline y/y of pending home sales was the sharpest annual decline on record. This compared to the 31% y/y decline in September. A signed contract to sell a home is the basis for this data.
According to data compiled by Apartment List, U.S. rentals fell for the third consecutive month in November. The 1% m/m drop in November was the largest monthly drop in at least five years. Apartment List “experts” expect the downtrend in rents to continue in coming months. Having risen from a low of 4.1% last fall, vacancy rates are now 5.7%. The November y/y rent growth was 4.6%. The national median rent is still 23% higher than in January 2021.
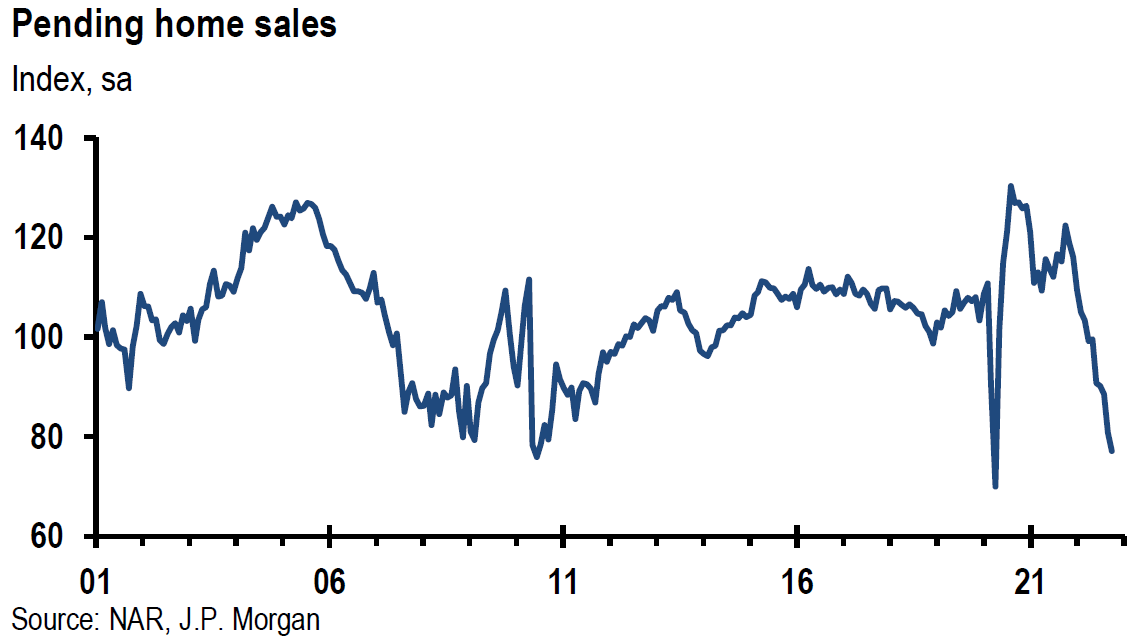
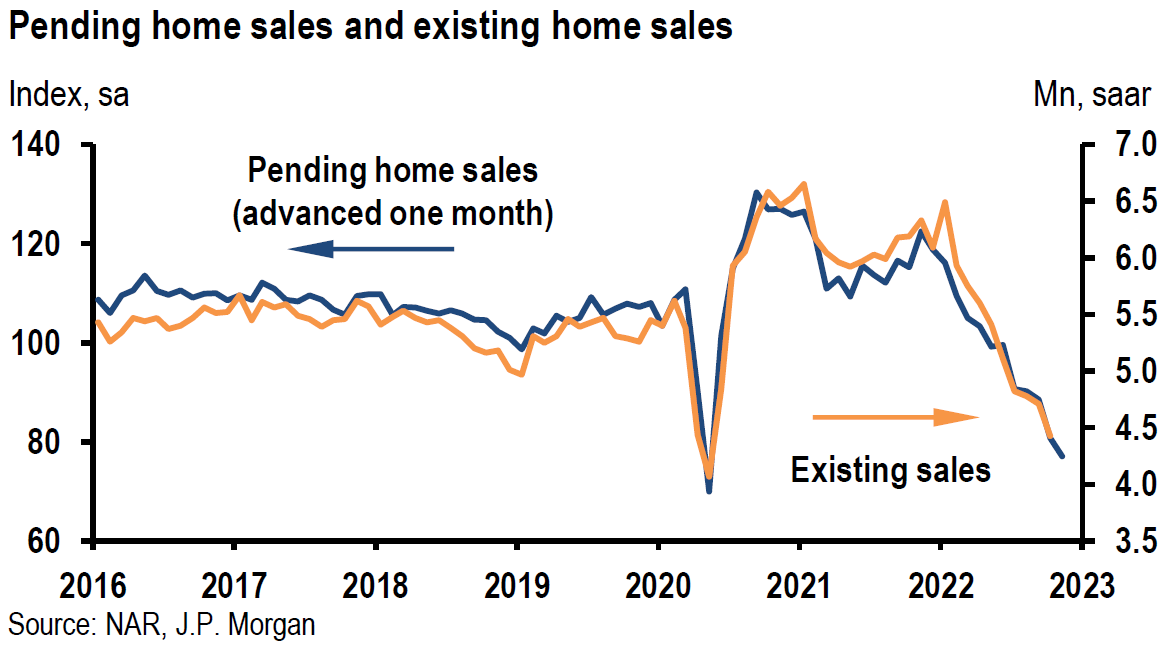
Source: JP Morgan, US: Pending home sales decline again (11-30-2022)
U.S. Q3 Real GDP Growth – Might Be Less than Appears
U.S. Q3 GDP growth was revised higher to 2.9% q/q from the original estimate of 2.6%. According to the U.S. Bureau of Economic Analysis (BEA), the “second estimate primarily reflected upward revisions to consumer spending and nonresidential fixed investment that were partly offset by a downward revision to private investment. Imports, which are a subtraction in the calculation of GDP, decreased more than previously estimated.” Increase in exports, both goods and services, also contributed to higher Q3 GDP growth. But the strong Q3 GDP figures were somewhat undercut by the much slower pace of growth indicated by Gross Domestic Income (GDI). Ideally these two measures should match, but they rarely do so, since the information used to compile the needed data are from different sources. GDP counts the value of what the economy produces, like good, services and technology, whereas GDI counts what all participants in the economy make or “take in,” like wages, business profits, rental and interest income and taxes. In contrast to GDP’s 2.9% Q3 increase, GDI increased only 0.3%, annualized. In light of these discrepancies, BEA also calculated a supplemental measure of U.S. economic activity that equally weights GDP and GDI to come up with a Q3 U.S. economic growth rate of 1.6% q/q. The BEA labels this divergence as a statistical discrepancy. A third measure of economic activity, gross domestic output (GDO) is simply the average of GDP and GDI. In July 2015, the Council of Economic Advisers released a report advocating the use of GDO as a preferred measure of economic growth, noting that GDO has historically “been a better gauge of the latest and presumably most accurate estimates of GDP growth than either GDP or GDI individually as well ss a more stable predictor of future economic growth.” These discrepancies fluctuate in both directions. According to the U.S. Treasury Department, GDI outpaced GDP growth in Q1 2022. Like many aspects of the pandemic, it seems that things can be very different than they first appear.
PCE Inflation
The Fed’s preferred measure of inflation, core Personal Consumption Expenditures (PCE) price index rose by a less than expected 0.2% m/m in October, compared to an expected reading of 0.3%. Core PCE inflation increased 5.0% y/y compared to September’s reading of 5.2%. Headline PCE inflation rose 0.3% m/m and by 6.0% y/y versus September’s annual gain of 6.3%.
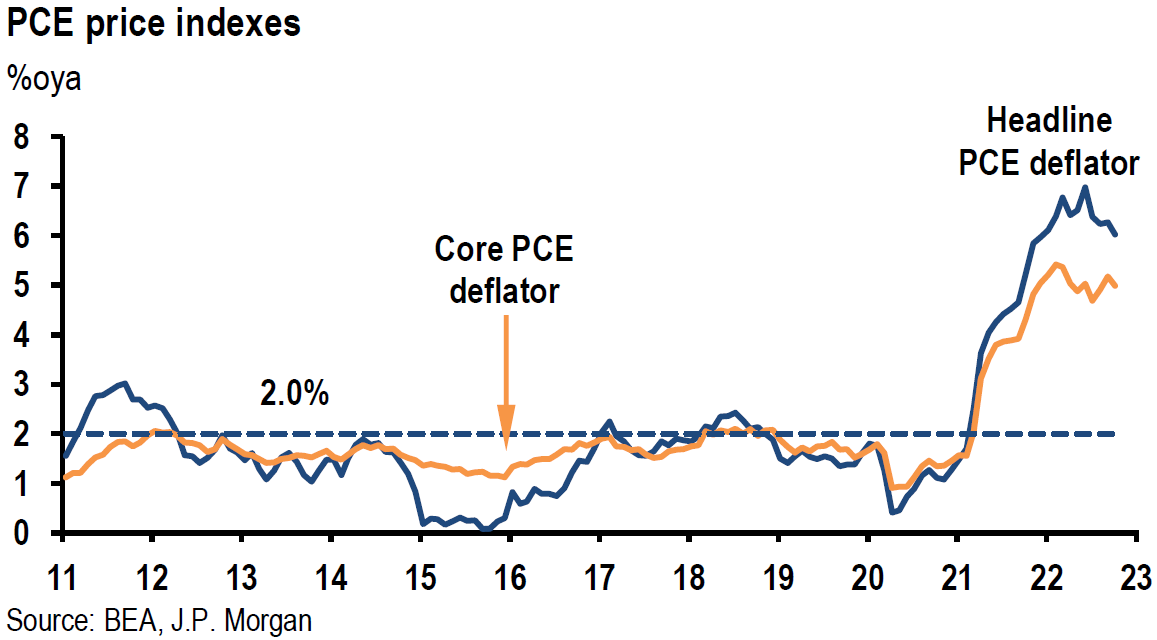
Source: JP Morgan, US: PCE price measures come out below expectations (12-1-2022)
U.S. November Nonfarm Payrolls – Stronger than Expected
November U.S. nonfarm payrolls increased 263,000 versus expectations for an increase of 200,000. The unemployment rate remained at 3.7% as expected. But perhaps the most troublesome aspect (at least in the Fed’s eyes) of this report was the much higher than expected average hourly earnings gains of 0.6% versus an expected 0.3% m/m increase. The 0.6% m/m increase was the fastest since January. Likewise, average hourly earnings were 5.1% higher y/y versus an expected increase of 4.6%. The labor force participation rate remained at a low level of 62.1%, 1.3% below its February 2020 level. October nonfarm payrolls were revised higher by 23,000 to 284,000, and September’s figures were revised lower by 46,000 to 269,000. These revisions make November’s job gains the lowest monthly gains since April 2021. Notable job gains were made in leisure and hospitality (88k), including a gain of 62k in food services and drinking places; health care (45k); and government (42k). The financial markets reacted as expected to the better-than-expected jobs data: interest rates higher, USD higher and equities lower. Once again, financial markets yesterday were pricing in a much weaker set of jobs data. We thought that the “good” news – weaker jobs data — was fully priced in yesterday. We have been surprised repeatedly of the frequency of financial markets fully pricing in a one sided “bet” before important economic announcements. Once again, the “officially” recognized Bureau of Labor Statistics (BLS) jobs data discussed above, diverged from the household survey that showed a decrease of 138,000 jobs in November. Once again, we are compelled to interpret data that could be viewed in different ways. We will withhold judgment until we view the next monthly jobs data report.
University of Michigan Final November Consumer Sentiment
The final readings of the University of Michigan’s November consumer sentiment readings were revised higher to 56.8 from a preliminary 54.7. The gauge for expectations was also revised higher – to 55.6 from 52.7. The year ahead inflation expectations were revised lower to 4.9% from the preliminary estimate of 5.1%. Five-year ahead inflation expectations remained at 3.0%.
Chinese Protests and “Reopening”
We would also like to comment on the protests across China that were sparked by an apartment fire a week ago Thursday night where zero COVID-19 policies were blamed for the death of 10 people in that fire. Protests then spread across China over the weekend into Monday as the Chinese people showed their frustrations with the “lockdown” COVID-19 policies. In reaction to these protests, China announced new and more directed efforts to vaccinate the elderly in anticipation of a “reopening” –elimination of zero COVID policies. We thought that statements by Sun Chunian, China’s vice premier mid-week were somewhat encouraging with respect to a “reopening.” “With the decreasing toxicity of the Omicron variant, the increasing vaccination rate and the accumulating experience of outbreak control and prevention, China’s pandemic containment faces new stage and mission.” On December 2, Reuters seemed to confirm a possible more lenient COVID-19 approach when they reported that some Chinese cities where COVID cases are still on the rise are relaxing their testing and quarantine rules.
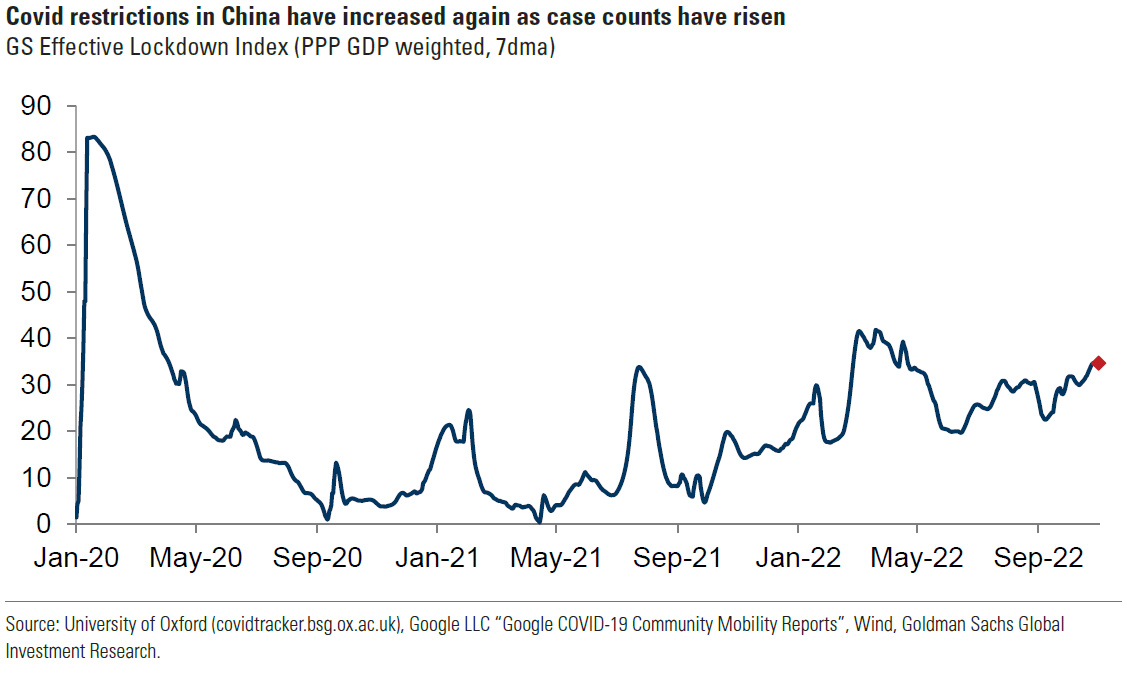
Source: Goldman Sachs, What’s Top of Mind in Macro Research: China Covid cases, higher but bumpier oil, equity bear market not over (11-30-2022)
Oil Market Developments
We will be watching developments in regard to oil markets very closely over the weekend and into Monday. OPEC+ has a December 4 scheduled meeting to decide on production levels. The Europeans have a self-imposed December 5 deadline of implementing an embargo against Russian oil or implementing a price cap on Russian oil. A week ago, price caps were considered in the $65-$70 price per barrel range. As of Thursday, a $60 level was seriously being considered.
Bottom Line
For the time being, we are maintaining our basic investment approach in last week’s commentary. We continue to prefer high quality big cap stocks that offer good balance sheets, as well as relatively stable cash flows and profit margins. We expect volatility across virtually all financial markets.
We view Powell’s speech as enunciating a new and more risk/reward-based model of determining monetary policy. This new focus should lessen the chances of the Fed “over-tightening.” We were also encouraged by China’s rhetoric and planned actions in response to the recent wide-spread and very atypical protests against China’s “zero-COVID-19” policies. Some of the official rhetoric is laying the groundwork for China’s much anticipated “reopening.” We anticipate that this will be a very messy process. To the extent China repens successfully, commodity prices will benefit in general. Perhaps the most benefit could accrue to base metals prices. Oil should also benefit. Supply chain disruptions should diminish and global economic growth should benefit as well.
Definitions
Real GDP – Real gross domestic product (GDP) is an inflation-adjusted measure that reflects the value of all goods and services produced by an economy in a given year. Real GDP is expressed in base-year prices. It is often referred to as constant-price GDP, inflation-corrected GDP, or constant dollar GDP. Put simply, real GDP measures the total economic output of a country and is adjusted for changes in price.
Gross Domestic Income (GDI) – The Gross Domestic Income is the total income received by all sectors of an economy within a state. It includes the sum of all wages, profits, and taxes, minus subsidies.
Federal Funds Rate – The term federal funds rate refers to the target interest rate set by the Federal Open Market Committee. This target is the rate at which commercial banks borrow and lend their excess reserves to each other overnight.
Federal Open Market Committee (FOMC) – The Federal Open Market Committee (FOMC) is the branch of the Federal Reserve System that determines the direction of monetary policy specifically by directing open market operations. The committee is made up of 12 members: the seven members of the Board of Governors; the president of the Federal Reserve Bank of New York; and four of the remaining 11 Reserve Bank presidents on a rotating basis.
U.S. Dollar Index (DXY) – The U.S. dollar index is a measure of the value of the U.S. dollar relative to a basket of foreign currencies.
U.S. Dollar (USD) – The United States dollar is the official currency of the United States and several other countries.
Fed’s Beige Book – The Beige Book is a qualitative review of economic conditions drawing on reports from 12 district banks. It is published eight times annually before meetings of the Federal Open Market Committee, which uses the results in its planning and decision-making processes.
Core PCE Inflation – A measure of the prices that people living in the United States, or those buying on their behalf, pay for goods and services that excludes food and energy prices. The core PCE gives a more accurate reading of inflation because food and energy are very volatile parts of the economy.
Headline PCE Inflation – A measure of the prices that people living in the United States, or those buying on their behalf, pay for goods and services. The PCE price index is known for capturing inflation (or deflation) across a wide range of consumer expenses and reflecting changes in consumer behavior.
Job Openings and Labor Turnover Survey (JOLTS) – The job openings and labor turnover survey are a monthly report by the Bureau of Labor Statistics (BLS) of the U.S. Department of Labor counting job vacancies and separations, including the number of workers voluntarily quitting employment.
Purchasing Managers’ Index PMI – A composite Purchasing Managers’ Index (PMI) is the weighted average of manufacturing and service sector PMIs for a given geography or economy.
Real GDP Growth – The real GDP growth rate measures economic growth, as expressed by gross domestic product (GDP), from one period to another, adjusted for inflation or deflation. In other words, it reveals changes in the value of all goods and services produced by an economy—the economic output of a country—while accounting for price fluctuations.
Case-Shiller Housing Index – The Case-Shiller Index, formally known as the S&P CoreLogic Case-Shiller U.S. National Home Price NSA Index, is an economic indicator that measures the change in value of U.S. single-family homes on a monthly basis.
IMPORTANT DISCLOSURES
The views and opinions included in these materials belong to their author and do not necessarily reflect the views and opinions of NewEdge Capital Group, LLC.
This information is general in nature and has been prepared solely for informational and educational purposes and does not constitute an offer or a recommendation to buy or sell any particular security or to adopt any specific investment strategy.
NewEdge and its affiliates do not render advice on legal, tax and/or tax accounting matters. You should consult your personal tax and/or legal advisor to learn about any potential tax or other implications that may result from acting on a particular recommendation.
The trademarks and service marks contained herein are the property of their respective owners. Unless otherwise specifically indicated, all information with respect to any third party not affiliated with NewEdge has been provided by, and is the sole responsibility of, such third party and has not been independently verified by NewEdge, its affiliates or any other independent third party. No representation is given with respect to its accuracy or completeness, and such information and opinions may change without notice.
Investing involves risk, including possible loss of principal. Past performance is no guarantee of future results.
Any forward-looking statements or forecasts are based on assumptions and actual results are expected to vary from any such statements or forecasts. No assurance can be given that investment objectives or target returns will be achieved. Future returns may be higher or lower than the estimates presented herein.
An investment cannot be made directly in an index. Indices are unmanaged and have no fees or expenses. You can obtain information about many indices online at a variety of sources including: https://www.sec.gov/fast-answers/answersindiceshtm.html or http://www.nasdaq.com/reference/index-descriptions.aspx.
All data is subject to change without notice.
© 2024 NewEdge Capital Group, LLC


