
Weekly Summary: March 7 – March 11, 2022
Key Observations:
- In varying degrees, we will all feel increasingly “under pressure” as the Russian-Ukrainian war persists and intensifies.
- The war most likely will exacerbate inflation and slow global economic growth rates. Stagflation and recession concerns are expected to increase to the extent the war persists.
- European economic growth rates appear to be at a very high risk due to the war. The U.S. and its currency could be looked upon increasingly as “safe havens” to the extent of the war’s increasing duration and severity.
- We maintain our stance that the Federal Reserve (Fed) will raise the federal funds rate at its March 15-16 meeting by 25 basis points (bps). We assume that the Fed will remain aggressive about reining in its monetary policies. Fed chair Powell made it clear in his Congressional testimony last week, that rate hikes of 50 bps are possible at any of the subsequent meetings.
The Upshot: As long as the war persists, uncertainty and volatility across financial markets will persist in our view. Any “war-ending” scenario would not surprise us. We are still convinced that a well-diversified portfolio of equities and commodities exposure is probably most appropriate for long-term investors in these uncertain times. Stock selectivity should remain the key to relative outperformance. Given the myriad of uncertainties we would continue to search across ALL sectors to find the most-attractively-priced stocks in terms of a risk/reward analysis. We assume that for most long-term investors, high quality stocks with strong balance sheets and relatively predictable cash flows would be most appropriate. To dispel any confusion, our search across ALL sectors does not mean necessarily that we would buy in every sector. In general, we would recommend that long term investors attempt to buy their desired stocks on equity market downturns.
We are all “Under Pressure”
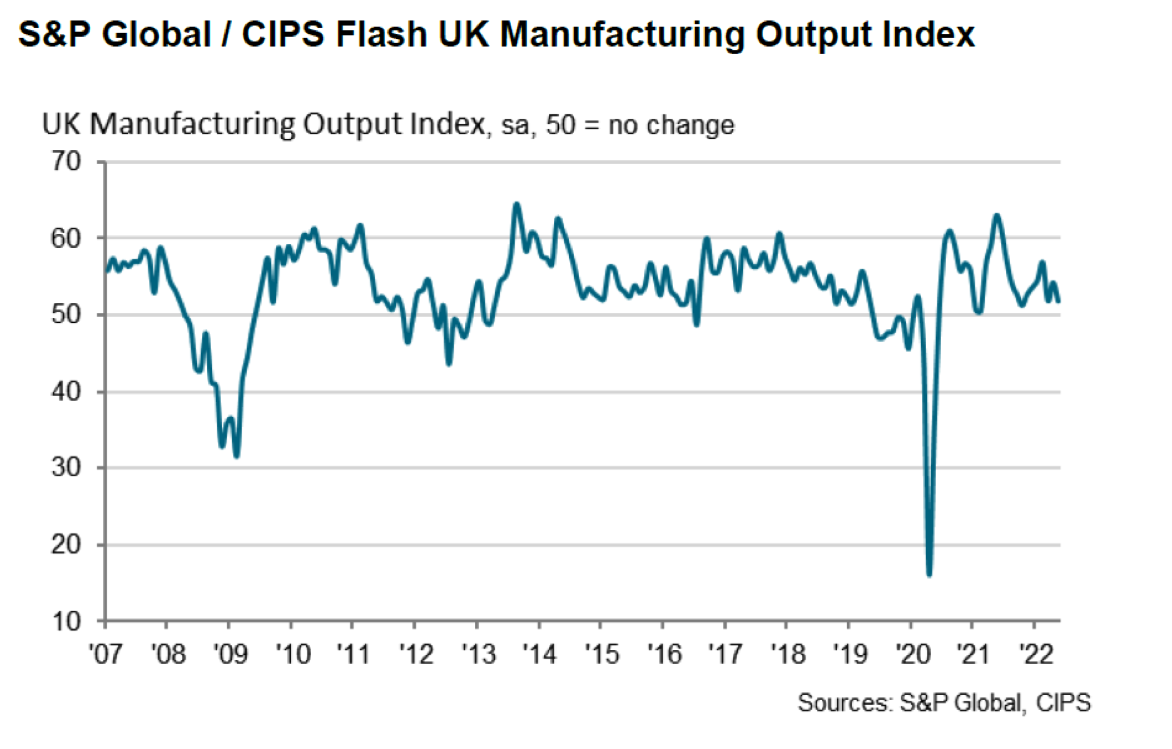
The longer the Russia-Ukraine war lasts, the more we can relate to the lyrics in the song “Under Pressure” as sung by David Bowie, together with Queen. The people of Ukraine are the most “under pressure.” Neighboring countries taking in refugees, and all of Europe which is greatly dependent on Russian natural gas, oil, agriculture and other commodities, are also experiencing “Pressure pushing down on [them]; Pushing down on you.” The Ukrainian people are experiencing first-hand the type of “pressure that burns a building down; Splits a family in two; Puts people on streets.” But most of the entire world is feeling under pressure in various forms as we all confront: “It’s the terror of knowing what the world is about” in these uncertain times. It is the war that is now the controlling narrative on most days for financial markets. The longer the war, the more uncertainty. It will continue to exacerbate the already-strong global inflation and will most likely result in slowing global economic growth. As we have highlighted in many of our recent commentaries, global economic growth was beginning to experience a rebound from the negative effects of the COVID-19 Omicron variant this quarter, even before Russia invaded Ukraine. We will continue to monitor closely both the manufacturing and services Purchasing Managers’ Index (PMI) of many countries. To date, we have not examined any that reflect uncertainties or effects stemming from the war.
Trends that the War Reversed
We contemplate that the European economies will be affected the most by the war – in terms of slowing economic growth and higher inflation rates – and that the U.S. will be affected the least. The longer the war persists, the greater the likelihood of U.S. outperformance relative to most of the rest of the world, including emerging markets (EMs). We also postulate that China will not be as adversely affected as Europe and many EM counties. China is one of the very few countries that is in the process of actually easing many of its monetary and fiscal policies. Last weekend, China’s government announced a 5.5% GDP growth target for 2022. The Chinese are emphasizing “stability” as a main goal for 2022. Most analysts expect that the 5.5% target can only be met with aggressive easing policies. Our forecast at the end of last year was for European and EM equities to outperform U.S. equities and for the USD to weaken over the course of this year. Our forecasts were mostly proving to be correct until the war reversed those trends.
Source: Goldman Sachs Global Strategy Views: Stagflation, Markets & Margins (3/10/2022)
Trends that the War Accentuated
But the war only enhanced and verified our predictions of severe equity downturns and very significant increases in commodity prices, especially oil. We predicted that these trends would be evident from the very beginning of this year – just like what occurred. Our forecast of much higher interest rates also proved to be prescient. The war has caused some unexpected interest rate volatility to the downside as investors sought “safe havens” for their assets. However, by this week’s end, yields had already reverted to their higher trajectory. We are still forecasting higher rates – but with continued volatility. Since the war began about two weeks ago, yields were hit the hardest and yield curves flattened on the days when the focus was on the war and its uncertainties. It was on those days when slowing economic growth concerns were particularly heightened.
Because of the war, the entire world is now “under pressure.” This includes the real economy and financial markets. The quickest and most glaring examples of this pressure were in financial markets that became more volatile even on speculation of Russia’s imminent invasion of Ukraine. The real economy quickly followed as energy prices – most notably global gasoline prices and European natural gas prices – and global food prices increased.
Source: Goldman Sachs Global Strategy Views: Stagflation, Markets & Margins (3/10/2022)
Inflation and U.S. CPI – Broadening Trends
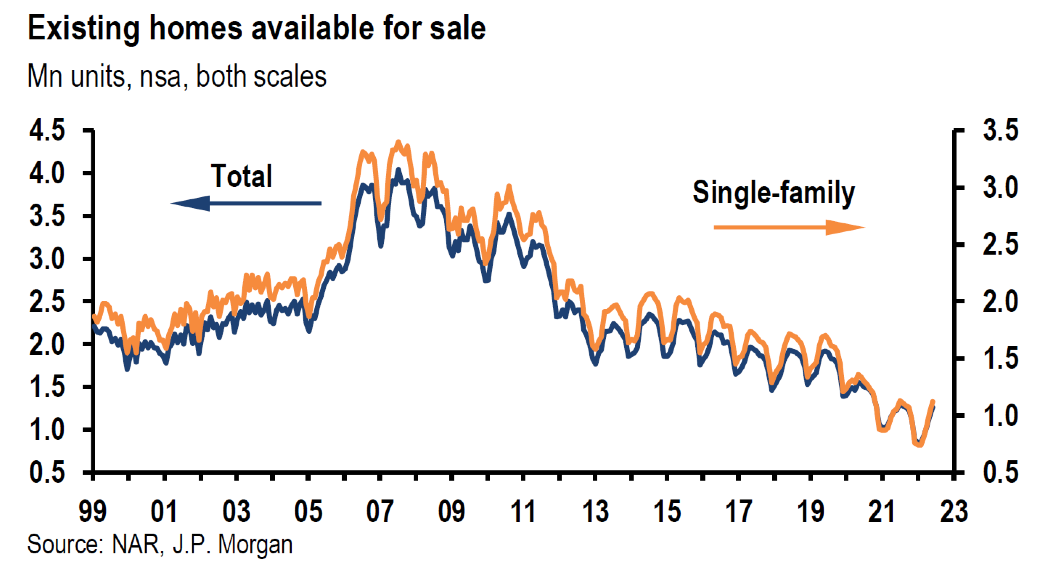
For quite a few months before the war, U.S. inflation could be characterized as broadening into categories that were more “persistent.” These categories included shelter costs and food away from home – restaurants. These inflationary trends were confirmed by the U.S. Bureau of Labor Statistics (BLS) report of the February Consumer Price Index (CPI) released on Thursday. Many of these inflationary readings were at 40-year highs. Headline CPI rose 0.8% month-over-month (m/m) and 7.9% year-over-year (y/y) in February. Core CPI, which excludes food and energy, was 0.5% higher m/m and 6.4% higher y/y. The BLS noted that indexes for gasoline (+6.6% m/m), shelter and food were the largest contributors to the headline rate. The food index rose 1.0% and food at home index rose 1.4%. These were the largest such monthly increases since April 2020. Shelter costs, which are also part of the core CPI, were characterized by BLS as “by far the biggest factor in the increase” of core CPI. The BLS also noted that a “broad set of indexes also contributed” to the core CPI reading. These indexes included those for recreation, household furnishings and operations, motor vehicle insurance, personal care and airline fares. Shelter costs are generally considered more persistent types of inflation and are therefore particularly important in deciphering types of inflation. The shelter index increased 0.5% m/m in February and accounted for over 40% of the increase in core CPI inflation. More specifically, the rent increased 0.6% m/m and the measure of owners’ equivalent rent was 0.4% higher for the month. Shelter’s yearly rise was 4.7%, which was the largest 12-month rise since May 1991. Lodging away from home – hotels – increased 2.2% for the month after declining in January. We interpret this as a sign of the “re-opening” of the economy. On March 10, the New York Times agreed with our characterization of inflation as they stated that “inflation has become broad based, spreading into gasoline, shelter and food.”
Source: J.P. Morgan US: February CPI jump is close to expectations
Higher Nominal Wages, Lower Real Wages
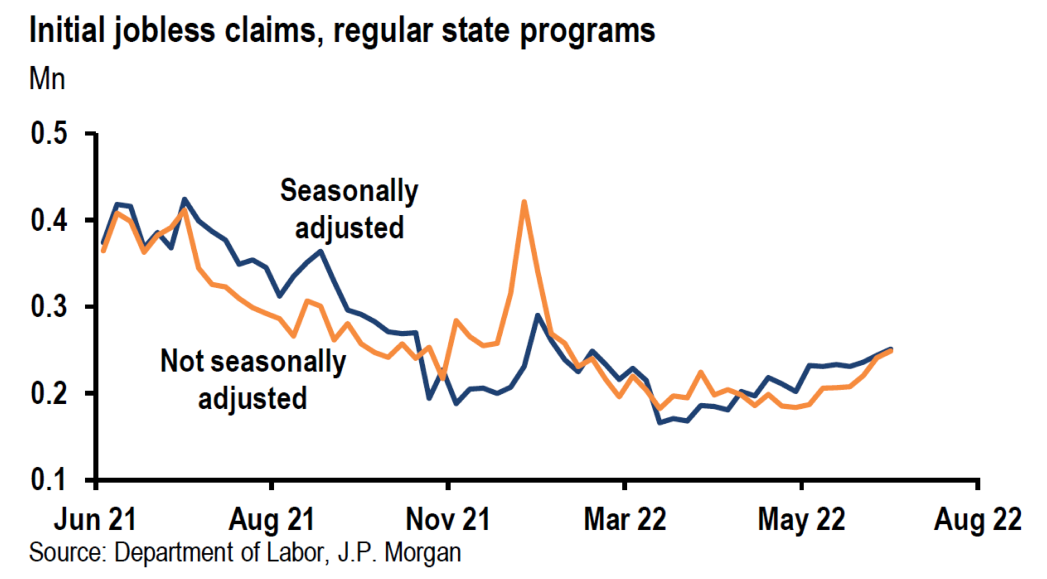
In our opinion, the tightness of the U.S. labor market along with the continuing increases in nominal wages has the potential to lead to more persistent inflation as well. According to CNBC on March 10, real average hourly earnings dropped 0.8% m/m in February and 2.6% y/y even as nominal wages increased 5.1% y/y. We surmise that workers are very aware of this discrepancy and will continue to request higher wages. One of the biggest reasons the Fed wants to ensure that inflation expectations remain “well anchored” is their fear of a possible wage-price spiral taking hold in workers’ expectations.
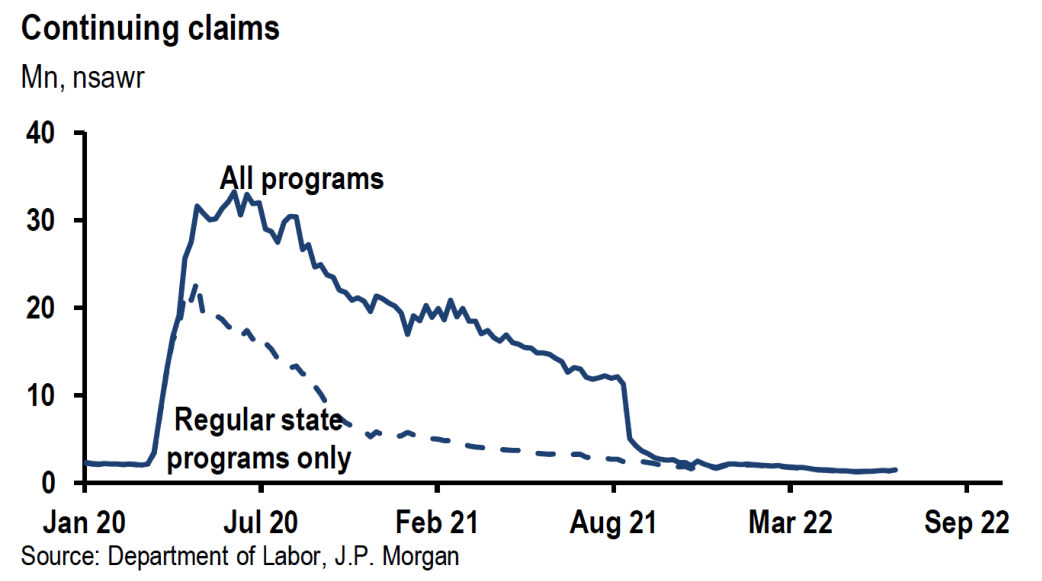
JOLTS Confirms Tight Labor Market
The BLS also released mid-week the Job Openings and Labor Turnover Survey (JOLTS). This survey reflects data as of the last business day in January. The January job openings seemed to reflect a new high of 11,263,000. However, the December JOLTS measure was revised higher to 11,448,000 that made the revised December reading the new high mark. These large numbers of job openings relative to the labor force and the number of unemployed workers continued to indicate a very tight labor market.
Source: Bureau of Labor Statistics Job Openings and Labor Turnover – January 2022 (3/9/2022)
Stagflation and Recession Concerns Increasing
We suppose that virtually all of the economic growth and inflation readings we have reviewed do not reflect the repercussions of the war, now in its third week. Many analysts and investors now are becoming concerned increasingly about stagflation and recession risks due to the war. As we have stated in our previous weekly commentaries, PMI levels above 50 are considered expansionary. We will monitor PMI readings very closely. To the extent that PMI readings start to drop below 50, we will assume that recession risks have increased and we will become less sanguine in regard to possible positive equity returns for 2022. Presently, our base case does not assume a U.S. recession. However, our opinion might change along with new incoming economic data.
University of Michigan Index of Consumer Sentiment and Inflation Expectations
On Friday of this week, the University of Michigan released the preliminary results for its March survey. This was the first survey that we examined which reflected consumers’ reaction to the war. The Index of Consumer Sentiment dropped to 59.7 (lowest since 2011) from 62.8 in February and was below expectations of 61.4. This overall figure reflected a bigger drop in consumer expectations versus the measure of current economic expectations. Expectations for year ahead inflation rose from 4.9% in February to 5.4% (highest level since 1981) in March. The only “good” news for the Fed was that longer term inflation expectations appeared to remain “well-anchored” as five-year inflation expectations remained constant at 3.0%. “Personal finances were expected to worsen in the year ahead by the largest proportion since the surveys started in the mid-1940’s. Consumers held very negative prospects for the economy, with the sole exception of the job market.” We agree with one of the main conclusions of this report: “The greatest source of uncertainty is undoubtedly inflation and the potential impact of the Russian invasion of Ukraine.” This sentiment is yet another indication that the Fed is correct, most likely, in its current focus on reining in inflation as the most effective way of extending U.S. economic growth. We have little doubt that the war has made the Fed’s task much more difficult to achieve. Our assumption is that more pessimistic future measures of consumer sentiment and expectations should follow along to the extent that the war is prolonged.
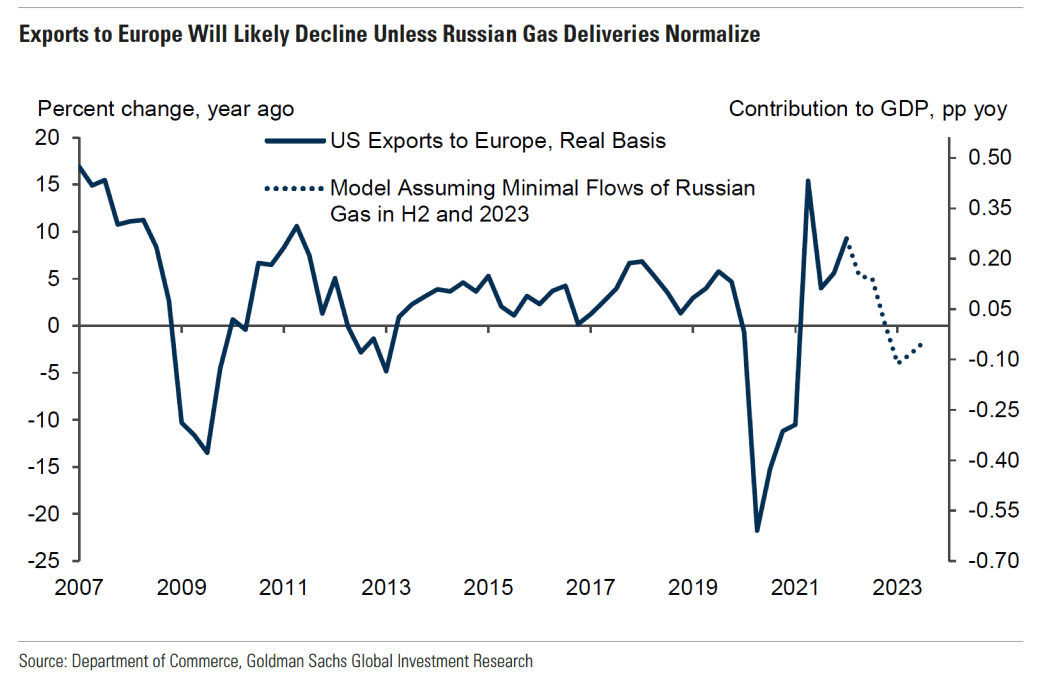
Europe Most Affected
Excluding Russia and Ukraine and due mostly to its very heavy dependency on commodities from both Russia and Ukraine, there is a great likelihood that Europe will experience the most adverse effects from the war. On March 10, Goldman Sachs attempted to quantify the most dramatic effects on the European economies. Goldman Sachs concluded that for every $20 increase in the price of oil, the GDP growth rate in 2022 would drop 0.3% for the U.S. and 0.6% for Europe. If Russian natural gas continued to flow to Europe but at much higher prices, there would be an additional hit of 0.6% to Europe’s growth. If Russia ceased to export natural gas entirely, the additional hit would be a combined 2.2% from natural gas shortages and 0.6% from oil. In this worst-case scenario, the expected negative hit to Europe’s 2022 GDP would be a total of 2.8% due to energy issues, while the energy-related hit to the U.S. economy would remain at 0.3%. In the worst-case scenario depicted here, Goldman Sacks anticipates that European PMIs could drop from the mid-50s to the high 40s, reflecting contracting economies.
Russia and Ukraine Combined are Very Large Commodity Exporters
As outlined in our previous commentaries, Russia and Ukraine export many other commodities besides energy. These commodities include grains, metals and fertilizers. Any slowdown or disruption in these other commodities could inevitably lead to more inflation and slower economic growth in addition to those caused by energy-related issues. We could foresee many scenarios where food inflation could rise substantially, and also where supply shortages and disruptions in supply chains could affect semiconductor output, auto production and many other possible industries. We are convinced that in general, the lowest income groups of people and countries could be affected more adversely relative to higher income groups.
Source: Goldman Sachs Metal Views: Liquidity crunch creates base metals upside (3/9/2022)
Source: Goldman Sachs Asia in Focus: Commodity supply shock worsens regional growth-inflation tradeoff; adjusting forecasts (3/10/2022)
Global Inflation and Economic Growth
To the extent that this war persists and/or that the sanctions against Russia continue, we wish to reiterate that we envisage global inflation rates rising and becoming more persistent and global economic growth slowing. These effects will be somewhat uneven throughout the world. The U.S. and its currency could become increasingly the safe haven, leading to its economy and financial markets outperforming most international markets. The longer the war and its repercussions persist, the less likely we are to return to our pre-war forecast of a generally weakening USD, a strengthening global economy relative to that of the U.S., and relative outperformance of European and selected EM equities relative to U.S. equities.
The European Central Bank (ECB)
On March 10, the ECB was the first major central bank to revise its economic growth and inflation projections taking the war into account. The ECB revealed its latest 2022 inflation forecast for Europe of 5.1%, revised from its prior forecast of 3.2%. The ECB also revised lower its 2022 GDP growth forecast from 4.2% to 3.7%. The ECB president Christine Lagarde acknowledged her lingering uncertainty in regard to these latest projections: “The Russia-Ukraine war will have a material impact on economic activity and inflation through higher energy and commodity prices, the disruption of international commerce, and weaker confidence. The extent of these effects will depend on how the conflict evolves, and on possible further measures.” The ECB described the war as a “watershed for Europe.” We agree basically with Lagarde’s statement. But we believe that the ECB revisions reflect a degree of optimism about the war.
Expected Revisions for Inflation, Economic Growth, Earnings Revisions of Companies
We accept that virtually all of global economic forecasts will be lowered and that global inflation forecasts will be increased due to the war. The longer the war persists, the greater the assumed revisions. We also foresee lowered revenue and earnings revisions. Margins could be especially at risk. Many analysts have taken comfort in highlighting the lowered forward looking price-to-earnings (P/E) ratios of most equity markets relative to the start of this year. But as earnings are lowered, the P/E ratios would become more elevated. Let’s not forget the importance of the “E” in the ratio.
Mid-Week Rally as “Blueprint”
Along with most financial markets, U.S. equities continued to be very volatile this week. Headlines related to the war were typically a very fertile source of volatility. Mid-week, U.S. and European equity markets had extremely strong one-day rallies. The almost 8% one-day gain of Germany’s DAX equity index was noteworthy as Germany is Europe’s largest economy. The president of the European Commission stated that Europe had sufficient liquefied natural gas to last through this winter. Crude oil declined over 11% that day. Many other commodity prices were hard hit as well. We postulate that an examination of equity movements, interest rate and currency movements on that day might serve as a “blueprint” for anticipated financial movements at the conclusion of this war. Treasury yields moved substantially higher, re-opening and travel related stocks increased substantially, and the euro increased over 1.5% versus USD – the largest one day upward move since many years ago. Other sectors with noteworthy large gains included banks and other financial stocks, restaurant stocks, housing-related stocks, and tech stocks – including the big cap quality growth stocks. Energy was the worst performing sector. Many other commodity-related stocks fared poorly as well. Notable sectors which lagged included utilities and consumer staples.
Bottom Line
Given the myriad of uncertainties at present, we assume continued volatility across virtually all financial markets as long as the war persists. We will continue our search across ALL sectors for the most attractively priced stocks after a risk/reward analysis. High quality stocks of companies with strong balance sheets and relatively predictable cash flows could be most appropriate for long-term investors in the current uncertain environment. We surmise that a well-diversified portfolio which includes exposure to commodities could be best for long-term investors. To the extent that the war persists, the U.S. might be thought of increasingly as a “safe haven” to the detriment of many international equity markets and foreign currencies.
We foresee that most global economic growth rates will be revised lower and that most inflation forecasts will be revised higher due to the war. We view the latest consumer sentiment survey by the University of Michigan as supportive of these forecasts. Additionally, we assume that downward earnings revisions might follow for many companies. Predictable margins should become increasingly important in evaluating appropriate investments. Let’s not forget the “E” in the P/E ratio when analyzing whether or not equity markets appear relatively expensive.
In the meantime, we can only imagine many families in Ukraine screaming “Let me out.”
Source: Goldman Sachs Global Strategy Views: Stagflation, Markets & Margins (3/10/2022)


Definitions:
The Purchasing Managers’ Index (PMI) – The Purchasing Managers’ Index (PMI) is an index of the prevailing direction of economic trends in the manufacturing and service sectors. It consists of a diffusion index that summarizes whether market conditions, as viewed by purchasing managers, are expanding, staying the same, or contracting. The purpose of the PMI is to provide information about current and future business conditions to company decision makers, analysts, and investors.
Consumer Price Index (CPI) – The Consumer Price Index (CPI) is a measure that examines the weighted average of prices of a basket of consumer goods and services, such as transportation, food, and medical care. It is calculated by taking price changes for each item in the predetermined basket of goods and averaging them.
Core Inflation – Core inflation is the change in the costs of goods and services but does not include those from the food and energy sectors. This measure of inflation excludes these items because their prices are much more volatile. It is most often calculated using the consumer price index (CPI), which is a measure of prices for goods and services.
Headline Inflation – Headline inflation is the raw inflation figure reported through the Consumer Price Index (CPI) that is released monthly by the Bureau of Labor Statistics. The CPI calculates the cost to purchase a fixed basket of goods, as a way of determining how much inflation is occurring in the broad economy. The CPI uses a base year and indexes the current year’s prices according to the base year’s values.
Re-opening trade – The reopening trade means buying stocks that will benefit from an open economy, domestically and globally.
Stagflation – Stagflation is characterized by slow economic growth and relatively high unemployment—or economic stagnation—which is at the same time accompanied by rising prices (i.e. inflation). Stagflation can be alternatively defined as a period of inflation combined with a decline in the gross domestic product (GDP).
bbl – An abbreviation for oilfield barrel, a volume of 42 galUS [0.16 m3].
Price-to-Earnings ratio (P/E) – The price-to-earnings ratio (P/E ratio) is the ratio for valuing a company that measures its current share price relative to its earnings per share (EPS). The price-to-earnings ratio is also sometimes known as the price multiple or the earnings multiple.
Liquefied natural gas (LNG) – Liquefied natural gas (LNG) is natural gas that has been cooled to a liquid state (liquefied), at about -260° Fahrenheit, for shipping and storage. The volume of natural gas in its liquid state is about 600 times smaller than its volume in its gaseous state in a natural gas pipeline. This liquefaction process, developed in the 19th century, makes it possible to transport natural gas to places natural gas pipelines do not reach and to use natural gas as a transportation fuel.
Federal Funds Rate – The term federal funds rate refers to the target interest rate set by the Federal Open Market Committee (FOMC). This target is the rate at which commercial banks borrow and lend their excess reserves to each other overnight.
Basis Points (bps) – A basis point is one hundredth of one percent, used chiefly in expressing differences of interest rates.
Recession – A recession is a macroeconomic term that refers to a significant decline in general economic activity in a designated region. It had been typically recognized as two consecutive quarters of economic decline, as reflected by GDP in conjunction with monthly indicators such as a rise in unemployment. However, the National Bureau of Economic Research (NBER), which officially declares recessions, says the two consecutive quarters of decline in real GDP are not how it is defined anymore. The NBER defines a recession as a significant decline in economic activity spread across the economy, lasting more than a few months, normally visible in real GDP, real income, employment, industrial production, and wholesale-retail sales.
Michigan Consumer Sentiment Index – The Michigan Consumer Sentiment Index (MCSI) is a monthly survey of consumer confidence levels in the United States conducted by the University of Michigan. The survey is based on telephone interviews that gather information on consumer expectations for the economy. Consumer sentiment is a statistical measurement of the overall health of the economy as determined by consumer opinion. It takes into account people’s feelings toward their current financial health, the health of the economy in the short term, and the prospects for longer-term economic growth, and is widely considered to be a useful economic indicator.
IMPORTANT DISCLOSURES
The views and opinions included in these materials belong to their author and do not necessarily reflect the views and opinions of NewEdge Capital Group, LLC.
This information is general in nature and has been prepared solely for informational and educational purposes and does not constitute an offer or a recommendation to buy or sell any particular security or to adopt any specific investment strategy.
NewEdge and its affiliates do not render advice on legal, tax and/or tax accounting matters. You should consult your personal tax and/or legal advisor to learn about any potential tax or other implications that may result from acting on a particular recommendation.
The trademarks and service marks contained herein are the property of their respective owners. Unless otherwise specifically indicated, all information with respect to any third party not affiliated with NewEdge has been provided by, and is the sole responsibility of, such third party and has not been independently verified by NewEdge, its affiliates or any other independent third party. No representation is given with respect to its accuracy or completeness, and such information and opinions may change without notice.
Investing involves risk, including possible loss of principal. Past performance is no guarantee of future results.
Any forward-looking statements or forecasts are based on assumptions and actual results are expected to vary from any such statements or forecasts. No assurance can be given that investment objectives or target returns will be achieved. Future returns may be higher or lower than the estimates presented herein.
An investment cannot be made directly in an index. Indices are unmanaged and have no fees or expenses. You can obtain information about many indices online at a variety of sources including: https://www.sec.gov/fast-answers/answersindiceshtm.html or http://www.nasdaq.com/reference/index-descriptions.aspx.
All data is subject to change without notice.
© 2024 NewEdge Capital Group, LLC


