

Weekly Summary: October 31 – November 4
Key Observations:
- Federal Reserve’s (Fed) chair Jay Powell made the terminal rate of the federal funds rate the key focus of Fed monetary policy. Pace of hikes are still important, but less so. After this week’s hike of 75 basis points (bps) in the federal funds rate to a “restrictive” range of 3.75% – 4.0%, “speed” of hikes is now less important.
- In our opinion, this week’s trading in financial markets confirmed that the level of interest rates and their volatility continue to be the principal drivers of equities and currencies. This week’s trading also highlights the importance of stock selectivity and earnings revisions. We will continue to monitor closely stock price reactions to earnings announcements as we attempt to decipher what’s “priced in” to markets.
- The powerful rallies in Chinese equities this week in reaction to even the slightest hints of a relaxation of China’s zero-COVID-19 policies, show clearly that a “reopening” of China could provide a very significant boost to China’s economic activity. The anticipated easing of supply chain constraints could decrease inflationary effects. But the resulting increase in China’s demand for commodities could increase commodity prices as well. We surmise that this would be especially true for base metals such as copper. Commodity prices could be further enhanced to the extent USD depreciates.
- The 2-10-year Treasury yield curve continued to invert more this week. Early Friday morning, the inversion was over 60 basis points (bps) before retreating closer to the 50 bps level that same afternoon. We interpret an increased level of inversion to indicate an increased risk of a U.S. recession next year. We also believe that the higher the terminal rate in the federal funds rate, the higher the risk for a recession. Given Powell’s guidance of a higher terminal rate than was indicated at the Fed’s September meeting, the terminal rate would have to be at a level of at least in the 4.75% – 5% range. We continue to anticipate a 50 bps hike in December. We now think that 25 bps hikes in February and March are probable.
The Upshot: Our general investment approach remains the same as depicted in last week’s commentary. We maintain our preference for big cap quality stocks with good balance sheets, relatively stable cash flows and stable margins. Volatility across sectors continues to be supportive of a diversified portfolio for long term investors. We expect volatility across virtually all financial markets to continue.
After Powell’s remarks this week, we expect the Fed to be more data dependent and more forward looking. All other things being equal, this should reduce the chances of the Fed “over-tightening.” But given the Fed’s forecasting record, we remain uncertain. Powell also made it clear that it would be preferable to err on the side of over-tightening. Powell remained confident that the Fed had the tools to “forcefully” correct an over-tightening circumstance. Powell reiterated that he thought that a “soft-landing” was still possible, but that the path was becoming more narrow to achieve that outcome.
The higher interest rates go, and the more volatile financial markets become, the more we would be concerned about liquidity issues in many financial markets. As the Fed’s reduction of its balance sheet (QT) progresses each month, the more we could become concerned. We continue to worry about potential market “dislocations.”
Dovish FOMC Statement
The lead story of this week was the Fed’s monetary policy decision mid-week, as explained by its chairman Jay Powell. The financial markets interpreted the Federal Open Market Committee’s (FOMC or Committee) statement of its latest monetary policy stance as very “dovish.” The Committee anticipated that ongoing increases in the federal funds rate would be “appropriate” to reach a restrictive enough level to attain its 2% inflation target. “In determining the pace of future increases in the target range, the Committee will take into account the cumulative tightening of monetary policy, the lags with which monetary policy affects economic activity and inflation, and economic and financial developments.” Financial markets interpreted this statement to mean that the Fed was now ready to consider a less-aggressive path of monetary policy tightening, which could include to step down to a 50-basis-points (bps) hike in the federal funds rate at the Fed’s next meeting in mid-December. Interest rates and the U.S. dollar (USD) traded lower, and U.S. equities generally traded higher. We thought that the Fed should have been taking these factors into account all along. But, in our view, this was an admission that the Fed has not been data dependent in its rate hikes to date. The November rate hike of 75 bps was the fourth such consecutive hike. Since the Fed was “behind the curve” in raising rates, the “speed” of hiking to get to a relatively restrictive level was of paramount importance. This latest hike raised the federal funds rate to a range between 3.75% and 4.0%. Only now could the Fed start to become somewhat data dependent. But this new level of complexity now also would require the Fed to forecast. Powell later admitted in his press conference – which began 30 minutes after the release of the FOMC statement – that the lag time between changes in monetary policy and its effects on the economy were highly uncertain. This was particularly the case in more “modern” times when financial conditions often tightened in anticipation of tighter monetary policies.
Hawkish Powell Press Conference – Terminal Rate Focus
In regard to monetary tightening policy, Powell delineated three questions: How fast to raise rates?, How high to move rates? and How long to keep rates at a high level? Powell acknowledged that with federal funds rate in the 3.75%-to-4% range now, speed of raising was less important. Powell made clear that the focus should be now on the “terminal rate” – the level at which the Fed could pause its rate hikes. It was when Powell uttered the phrase that it was “very premature to think or talk about pausing” that the financial markets realized the Fed was still very hawkish in its monetary tightening policies. The financial markets immediately reversed their initial reaction to the FOMC statement. Interest rates and USD increased and stocks fell in very dramatic reversals. Powell reiterated that we still have a “ways to go” in raising rates before a pause. Additionally, Powell managed to indicate a likely deceleration in the magnitude of rate hikes while maintaining a hawkish stance. Furthermore, Powell also stated that “incoming data since our last meeting suggests that the ultimate level of interest rates will be higher than expected.” The Fed’s so-called Dot Plot at its September meeting indicated a terminal federal funds rate of 4.5% to 4.75%. The Dot Plot represents each of the FOMC participants’ projections. After Powell’s statements, we assume that the December dots will show at least a 4.75% to 5.0% terminal rate. Powell also indicated that once a terminal rate was reached, it would be maintained for “some time,” During such time, the Fed would continue to assess the effects of its “cumulative” tightening monetary policy.
Fed Forecasting
Powell acknowledged that the U.S. economy has slowed “significantly” and that consumer spending has also slowed since last year, but that the labor market remained “extremely tight.” To date, most of the weakening effects were seen mostly in interest-rate-sensitive sectors, such as the housing sector. Powell also made it quite clear that a slowing rate of inflation over several months was not a prerequisite to lower the pace of rate hikes. Instead, this required the Fed to “look forward.” In this new phase of Fed policy, “patience” and “resolve” were needed. As we have observed in many of our prior commentaries, the Fed’s forecasting abilities have been called into question. But we are encouraged that the Fed is now entering a stage where it will try to be more forward looking. This should diminish somewhat the chances of the Fed “over-tightening,” i.e. more tightening than is necessary to achieve a 2% inflation target. However, Powell reiterated the risk of doing too little tightening was far more detrimental than tightening too much. Powell was confident that if the Fed over-tightened that they would then have the tools to ”forcefully” correct that circumstance. Although no decision on the magnitude of December’s rate hike has been made, Powell admitted that a lowered pace of hikes could come as early as that meeting.
How High a Terminal Rate?
In addressing the second question of how high the terminal rate should be before a pause in rate hikes, Powell would say only that he thought it would be higher than believed in September. But Powell did say that he did not think that it was necessary that the federal funds rate exceed the rate of inflation. He based this conclusion on how quickly financial conditions may tighten in anticipation of further hikes and that the Fed should incorporate its forward looking views on inflation. This view is in contrast to many prominent economists who view this as a “necessary” level to obtain. Although Powell believed that wages were rising still at a rate that was not compatible with a 2% rate of inflation, he stated that he thought wages were “not the principal story of why prices are higher.” We were surprised to hear this statement, given his focus on the tight labor market and his perception of the need to have a less tight labor market as a precursor to lower inflation. To the best of our knowledge, the only time that Powell made a similar statement was when he was still labeling inflation as transitory. We were surprised then as well. Powell highlighted the Fed’s awareness of more up-to-date shelter costs information in private sector surveys with more up-to-date rental information. The Fed would strive to strike a balance between the official measures of shelter costs with the more up-to-date statistics. Powell highlighted that the Fed looks at a broad range of data on the labor market. This includes the very high U.S. job vacancy rates relative to unemployed people of roughly 1.9-to-one. Perhaps this is why Powell thinks that it is still possible to have a “soft landing” even as that path has narrowed. A dramatic decrease in job vacancies might cushion the need for extensive job losses.
“Wake Me Up When It’s All Over”
We have seen the Fed go through many stages of its monetary policies over the past two years, often typified with dismal forecasting abilities. Analyzing the Fed’s latest iteration of its monetary policies made us recall Avicii’s song “Wake Me Up.” In particular, we can envision FOMC participants saying: “Feeling my way through the darkness; I can’t tell where the journey will end; But I know where to start … So wake me up when it’s all over … All this time I was finding myself, and I; Didn’t know I was lost.” Hopefully, the Fed has finally found the way. We would also like to point out that we also wished that the Fed knew “where to start.” Unfortunately, the Fed started its monetary tightening policies too late. We assume that many Fed officials and long-term investors would support the idea to be awakened when inflation was more contained and that equities might begin a long-term uptrend.
Financial Market Reversals Around Powell’s Statements
Although financial market “reversals” were dramatic on the day of the Fed’s decision, in some ways the follow through on the next day was even more so in regard to USD and interest rates. On Fed decision day, the 2-year Treasury yield closed at 4.601, up 6 bps. The 10-year yield closed 3 bps higher at 4.082, and the 30-year yield closed unchanged. The USD currency index DXY closed up less than 0.5%. Equities took the brunt of the damage on Fed decision day with a more muted general response the next day. However, the following day, the 2-year Treasury yield rose over 14 bps to close at 4.714 and the 10-year yield rose nearly 9 bps to close at 4.149, after it traded as high as a 4.223% yield. The 30-year yield rose over 6 bps and closed with a yield of 4.188%. The 2-to-10 year Treasury yield curve continued to invert reaching an inversion of well into the mid 50 bps levels. By early the following morning, the inversion exceeded 60 bps before retreating to roughly a 50 bps inversion in the afternoon. We interpret this to indicate an increased probability of a U.S. recession next year. DXY also rose close to 1.5%. We believe that this week’s trading and movements in financial markets continue to confirm that interest rates and their volatility continue to be the principal drivers of equities and currencies. According to J.P. Morgan (JPM) on November 3, financial markets on Fed decision day indicated a terminal federal funds rate that started at 5.05%, and traded as low as 4.95% before closing at 5.05%. The next day’s trading indicated a terminal rate of 5.13%.
Dallas Fed Surveys
Like last week, most of the economic data we analyzed this week was supportive of our hypothesis that the U.S. and many foreign economies are slowing and that U.S. inflationary pressures are beginning to dissipate. The Dallas Fed manufacturing survey for October showed that the general business activity for manufacturing fell further into negative territory. As this index remained in negative territory for the fifth consecutive month, the decline in new orders suggested a continued decrease in demand. The business outlook remained in negative territory. Many subcomponents reached their lowest levels in over two years. The employment index remained solidly above the series average, but the hours worked index did not increase for the first time in two years. Wages and prices remained elevated.
The Dallas Fed services index also depicted weakening business trends. The general business activity index for services fell to its lowest level since July 2020. The business outlook fell further into negative territory as uncertainty increased. Growth in selling prices and wages continued to moderate.
JOLTS – High Job Vacancies Suggest Tight U.S. Labor Market
One of the most “troubling” data points this week in terms of the Fed’s goal of reining in inflation was the unexpected increase in job vacancies in the Job Openings and Labor Turnover Survey (JOLTS) report for September. Job openings increased 437,000 (+4.3%) in September to 10.72 million versus an expected level of 9.75 to 10 million openings, and versus a revised 10.28 million in August, which was an 8% decline from the prior month. The number of job openings has recently been a very volatile number month to month. The financial markets immediately interpreted the jump in job openings as indicating a tighter labor market. The result was a reversal in lower interest rates that closed near their highs for the day, as well as a retracement of early equity gains. The initial claims for unemployment insurance benefits for the week that ended October 29 remained at a very low level, confirming a tight labor market. Continuing unemployment claims rose 47,000 to 1.485 million for the week that ended October 22. This was the highest level since March but remained at a historically low level.
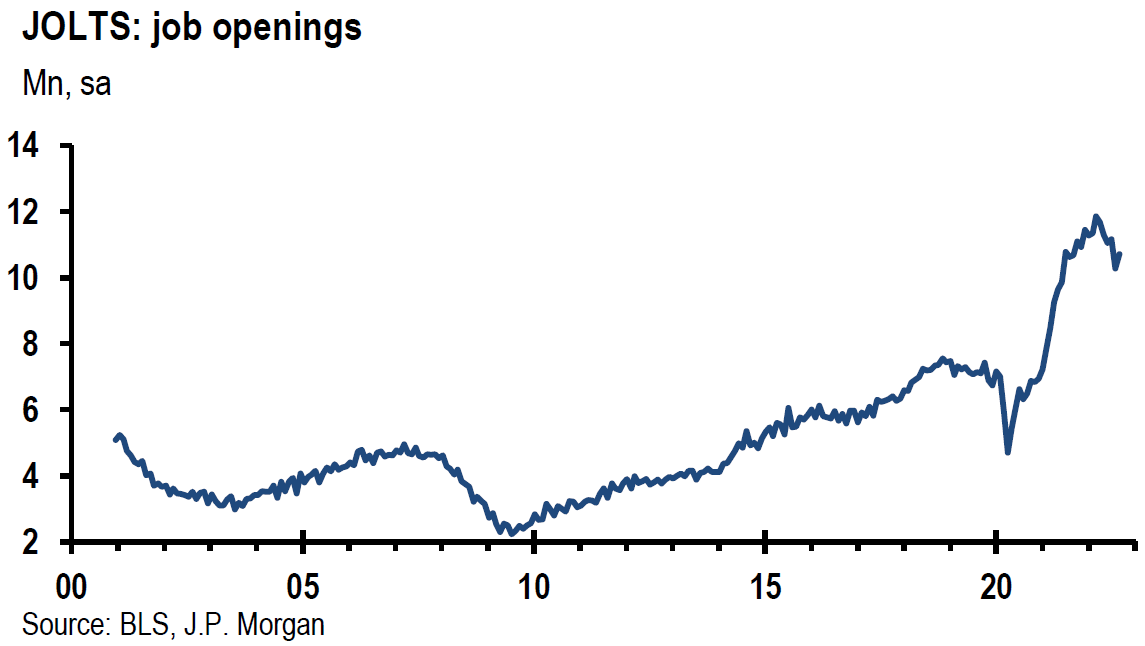
Source: JP Morgan, US: Job openings move up in September (11-1-2022)
U.S. Nonfarm Productivity
Nonfarm labor productivity increased by a less-than-expected 0.3% in Q3 and was 1.4% lower when compared to Q3 2021. Unit-labor costs increased 3.5% in Q3 reflecting a 3.8% jump in hourly compensation and a 0.3% increase in productivity. Unit-labor costs increased 6.1% over the last four quarters. We surmise that the productivity trend remained weak as Q3 productivity gains failed to make up the productivity drop in the first half of the year. The reverse of this is that unit-labor costs eased from 7.6% gains year-over-year (y/y) in Q2 to 6.1% in Q3 q/q. This is an illustration that wage gains based on productivity gains are beneficial to economic growth and are not generally inflationary. Wage increases that do not reflect productivity gains are what contribute to inflationary pressures.
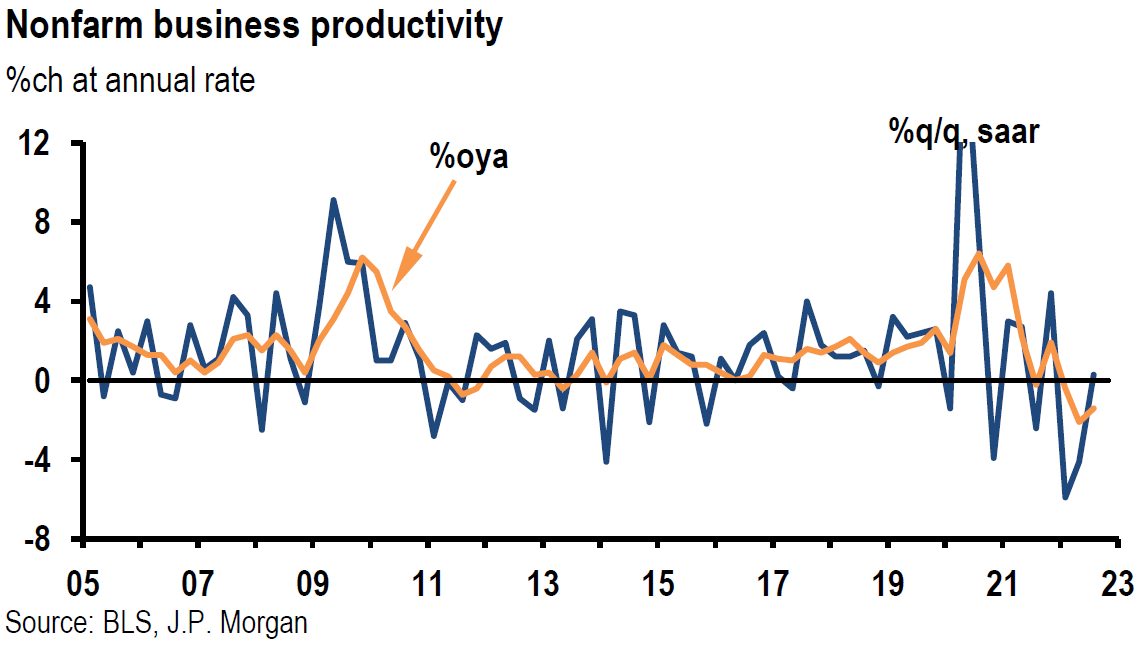
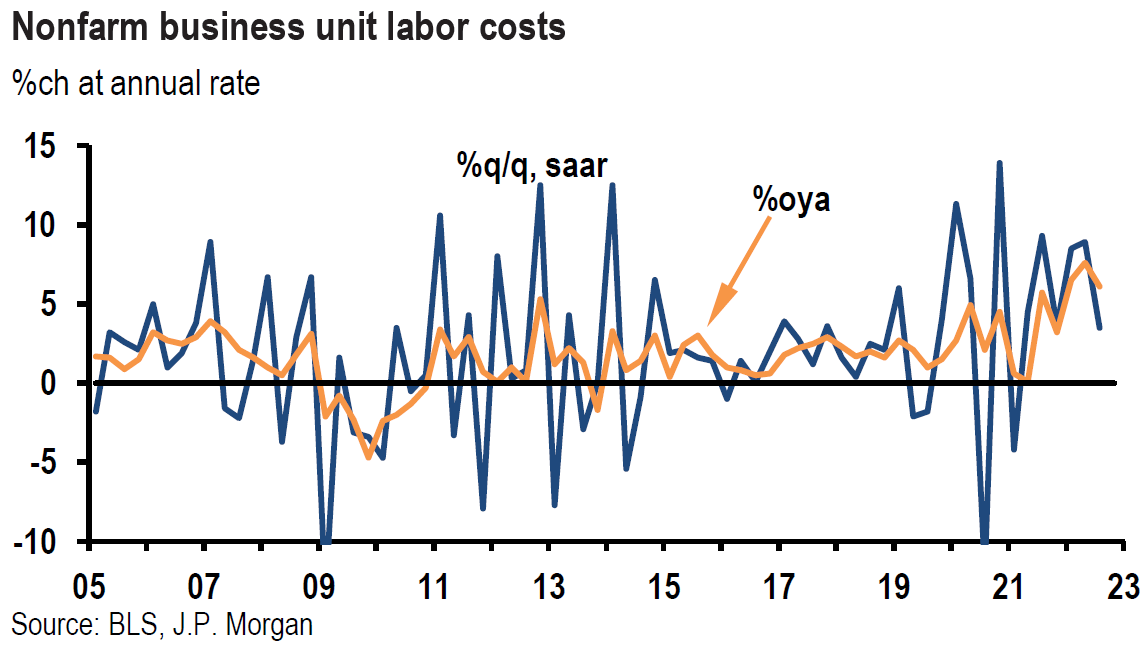 Source: JP Morgan, US: Productivity trend still looks weak (11-3-2022)
ISM Manufacturing PMI
Other than the U.S. nonfarm payroll data for October, perhaps the most anticipated data were the Institute for Supply Management (ISM) Purchasing Managers’ Index (PMI) for both manufacturing and non-manufacturing (services) for the month of October. ISM manufacturing PMI fell to 50.2 from 50.9 in September but still exceeded the expected level of 50. This October reading along with the prices index that was 5.1% lower m/m, were the lowest since May 2020. Exports and imports were both lower. The accompanying statement to the manufacturing survey summarized the report: “The U.S. manufacturing sector continues to expand, but at the lowest rate since the coronavirus pandemic recovery began.” Indications were that companies were preparing for a future with lower demand.
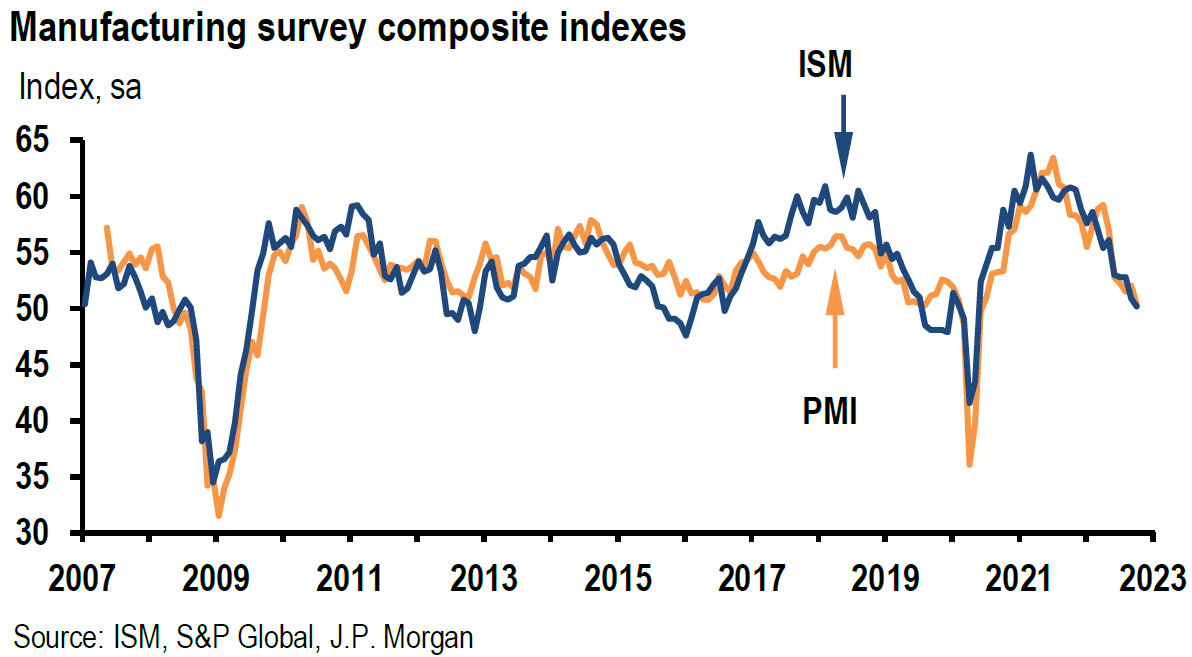
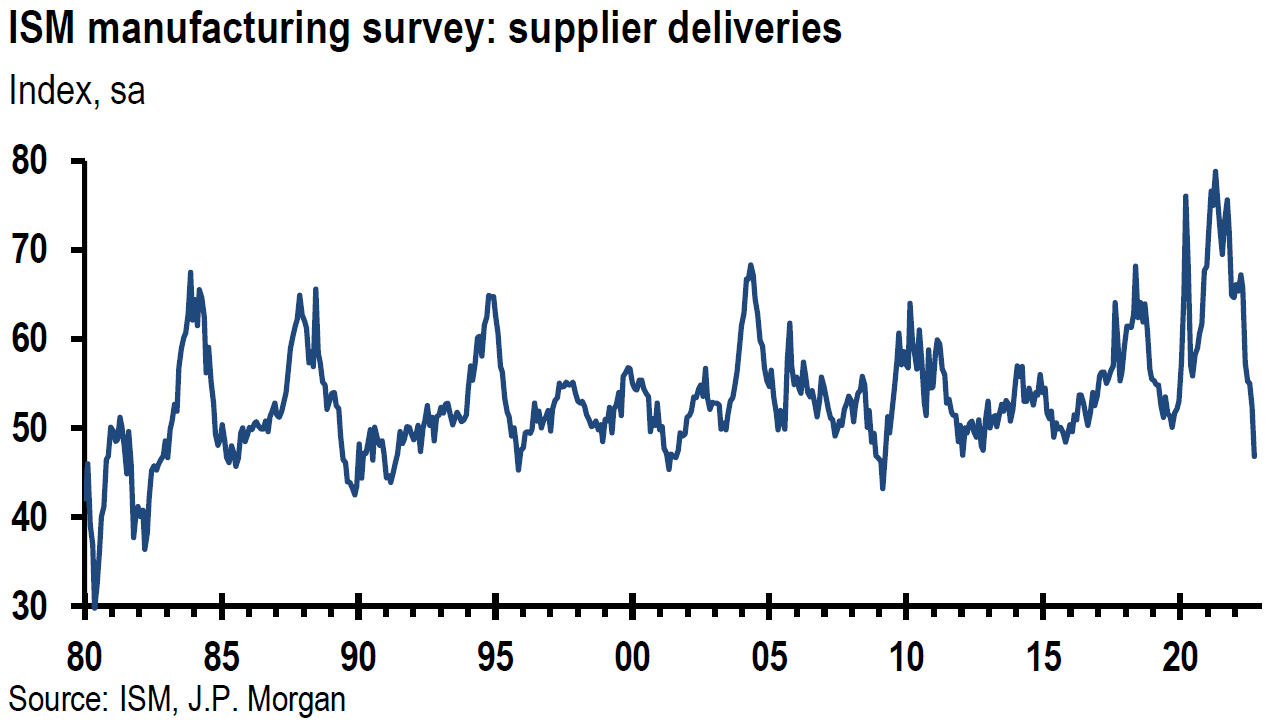
Source: JP Morgan, US: ISM manufacturing composite declines in October (11-1-2022)
ISM Services PMI
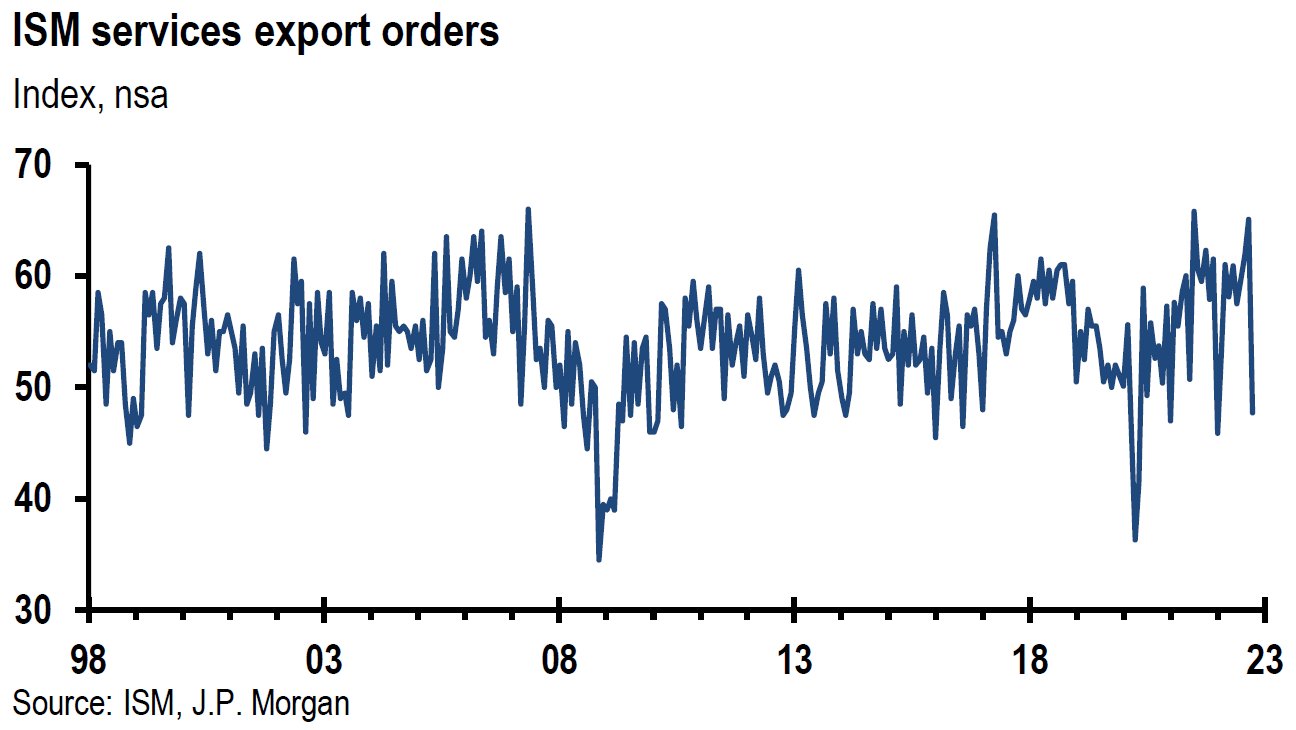
The ISM services PMI fell to 54.4 from September’s reading of 55.7 and below expectations for a 55.5 reading. This was the slowest growth in the services sector since it contracted (below 50) in May 2020. Slower growth was seen in production and new orders. The employment index declined into contractionary territory. The accompanying statement to this report provided the following summary: “growth rates and business levels have cooled. There are still challenges in hiring qualified workers, and due to uncertainty regarding economic conditions, some companies are holding off on backfilling open positions. Supply chain and logistical issues persist but are not as encumbering as they were earlier in the year.” After five consecutive months of decreases, prices rose slightly. It appears that the employment subcomponents of the business surveys that we have analyzed decreased generally in October.
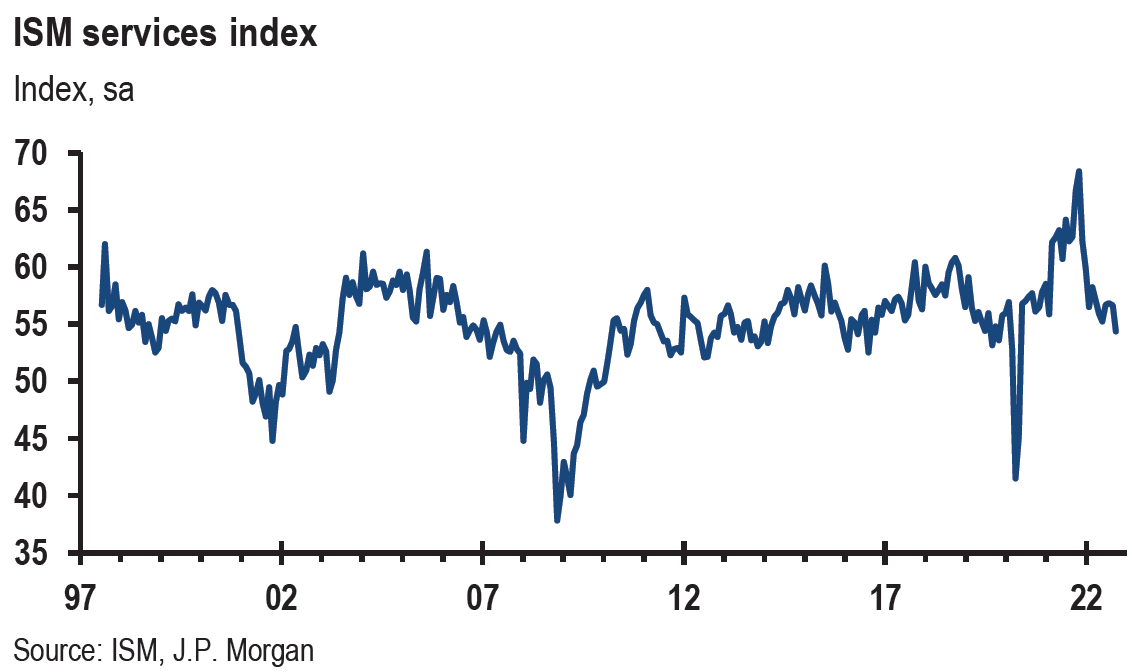
Source: JP Morgan, US: ISM services survey weakens in October (11-3-2022)
U.S. Nonfarm Payrolls
The U.S. October nonfarm payrolls rose 261,000 (including 233,000 private sector jobs) exceeded consensus expectations of roughly 200,000. The unemployment rate rose to 3.7% versus an expected 3.6% and 3.5% for September. September payrolls were revised higher from 263,000 to 315,000 and August was revised to 292,000 from 315,000. Given these revisions, the October increase was the smallest since December 2020. Average hourly earnings rose by 0.4% m/m versus an expected increase of 0.3% and 4.7% y/y. The labor force participation rate was 62.2% against expectations of 62.3% that was also the reading in September. It should be noted that the household survey depicted a “considerably” weaker employment picture. We would characterize the official jobs data as still very robust in a slowing trend.
Bottom Line
For the time being, we are maintaining our basic investment approach as expressed in last week’s commentary. We continue to prefer high quality big cap stocks that offer good balance sheets, as well as relatively stable cash flows and profit margins. We expect volatility across virtually all financial markets to continue.
We now expect the Fed to be more data dependent and forward looking. Given that Powell sees the greater is risk in not tightening enough, we think the odds that the Fed “over-tightens” is quite high. The higher the terminal rate in the federal funds rate, the higher the chance for a recession. The greater inversion of the 2-10-year Treasury yield curve also points to an increased risk of a U.S. recession in 2023. We continue to view the 10-year Treasury with a yield hovering near 4.2% as a possible hedge against a recession in a diversified portfolio for those so inclined.
We continue to expect the Fed to raise the federal funds rate by 50 bps in mid-December. We now think that 25 bps hikes in February and March are probable.
Definitions
Federal Funds Rate – The term federal funds rate refers to the target interest rate set by the Federal Open Market Committee. This target is the rate at which commercial banks borrow and lend their excess reserves to each other overnight.
Basis Points (bps) – A basis point is one hundredth of one percent, used chiefly in expressing differences of interest rates.
Inverted Yield Curve – An inverted yield curve describes the unusual drop of yields on longer-term debt below yields on short-term debt of the same credit quality. Sometimes referred to as a negative yield curve, the inverted curve has proven in the past to be a relatively reliable lead indicator of a recession.
Federal Open Market Committee (FOMC) – The Federal Open Market Committee (FOMC) is the branch of the Federal Reserve System that determines the direction of monetary policy specifically by directing open market operations. The committee is made up of 12 members: the seven members of the Board of Governors; the president of the Federal Reserve Bank of New York; and four of the remaining 11 Reserve Bank presidents on a rotating basis.
Fed Funds Terminal Rate – The terminal rate is defined as the peak spot where the benchmark interest rate, the federal funds rate, will come to rest before the central bank begins trimming it back.
U.S. Dollar Index (DXY) – The U.S. dollar index is a measure of the value of the U.S. dollar relative to a basket of foreign currencies.
ISM Manufacturing Index (PMI) – The ISM manufacturing index, also known as the purchasing managers’ index (PMI), is a monthly indicator of U.S. economic activity based on a survey of purchasing managers at more than 300 manufacturing firms. It is considered to be a key indicator of the state of the U.S. economy.
ISM services PMI – The Institute of Supply Management (ISM) services PMI (formerly known as Non-Manufacturing Index) is an economic index based on surveys of more than 400 non-manufacturing (or services) firms’ purchasing and supply executives.
Job Openings and Labor Turnover Survey (JOLTS) – The job openings and labor turnover survey are a monthly report by the Bureau of Labor Statistics (BLS) of the U.S. Department of Labor counting job vacancies and separations, including the number of workers voluntarily quitting employment.
Job Openings – JOLTS defines Job Openings as all positions that are open (not filled) on the last business day of the month.
Initial Unemployment Insurance Claims – Initial claims are new jobless claims filed by U.S. workers seeking unemployment compensation, included in the unemployment insurance weekly claims report.
Continuing Claims – Continuing claims track the number of U.S. residents filing for ongoing unemployment benefits in a given week. Continuing claims measure ongoing unemployment benefits, which is in contrast to initial claims, which track new filings for benefits.
Nonfarm productivity – Nonfarm Productivity measures the annualized change in labor efficiency when producing goods and services, excluding the farming industry. Productivity and labor-related inflation are directly linked-a drop in a worker’s productivity is equivalent to a rise in their wage.
Nonfarm Payrolls – Nonfarm payrolls is the measure of the number of workers in the U.S. excluding farm workers and workers in a handful of other job classifications. The nonfarm payrolls classification excludes farm workers as well as some government workers, private households, proprietors, and non-profit employees.
Fed Dot Plot – The Fed dot plot is published quarterly as a chart showing where each of the 12 members of the FOMC expect the federal funds rate to be for each of the next three years and the long term.
IMPORTANT DISCLOSURES
The views and opinions included in these materials belong to their author and do not necessarily reflect the views and opinions of NewEdge Capital Group, LLC.
This information is general in nature and has been prepared solely for informational and educational purposes and does not constitute an offer or a recommendation to buy or sell any particular security or to adopt any specific investment strategy.
NewEdge and its affiliates do not render advice on legal, tax and/or tax accounting matters. You should consult your personal tax and/or legal advisor to learn about any potential tax or other implications that may result from acting on a particular recommendation.
The trademarks and service marks contained herein are the property of their respective owners. Unless otherwise specifically indicated, all information with respect to any third party not affiliated with NewEdge has been provided by, and is the sole responsibility of, such third party and has not been independently verified by NewEdge, its affiliates or any other independent third party. No representation is given with respect to its accuracy or completeness, and such information and opinions may change without notice.
Investing involves risk, including possible loss of principal. Past performance is no guarantee of future results.
Any forward-looking statements or forecasts are based on assumptions and actual results are expected to vary from any such statements or forecasts. No assurance can be given that investment objectives or target returns will be achieved. Future returns may be higher or lower than the estimates presented herein.
An investment cannot be made directly in an index. Indices are unmanaged and have no fees or expenses. You can obtain information about many indices online at a variety of sources including: https://www.sec.gov/fast-answers/answersindiceshtm.html or http://www.nasdaq.com/reference/index-descriptions.aspx.
All data is subject to change without notice.
© 2024 NewEdge Capital Group, LLC


