

Weekly Summary: December 12 – 16
Key Observations:
- We believe that this week’s Federal Open Market Committee (FOMC) meeting, along with the “dot plot” included in the Fed’s Summary of Economic Projections (SEP), could be the peak of Federal Reserve (Fed) “hawkishness.” We base this supposition on the near unanimous agreement of the Fed’s policymakers that the terminal federal funds rate should be above 5%, eventually, and on our own assessment that U.S. inflation will diminish at a faster pace that many investors and analysts expect. We also maintain our view that the U.S. economy is starting to contract as shown by our observations enumerated below. This pace of contraction might quicken at any time as we have postulated many times that “rapidity of change” will continue to be the hallmark of this period that began with the onset of the pandemic.
- This week was a stark example of how financial markets might react depending on whether their focus is on inflation and interest rate concerns or on concerns of increasing probabilities of a U.S. recession. In anticipation of increased recession probabilities, we recommended the purchase of 10-year Treasury securities when their yield exceeded 4.2% for those investors so inclined to include these securities in their diversified portfolios. We maintain our belief, that in all likelihood, we have seen the peak in 10-year Treasury yields, as well as the peak in USD, for this “cycle.”
- The U.S. November Consumer Price Index (CPI) data released this week continued to confirm our belief that U.S. inflation will lessen at a quicker pace than many expect. We were also encouraged by the largest monthly drop in November asking rents in the seven-year history of the Zillow Observed Rent Index. The initial very favorable financial market reaction, particularly in regard to U.S. equities, proved to be very short-lived as recession worries quickly asserted themselves.
- We expect the Fed to maintain a hawkish tone for as long as possible so as to preclude a premature loosening of financial conditions. At present, we do not anticipate the Fed to cut rates in 2023.
The Upshot: Our general investment approach remains the same as depicted in last week’s commentary. We maintain our preference for big cap quality stocks with good balance sheets, relatively stable cash flows and stable margins. Volatility across sectors continues to be supportive of a well-diversified portfolio for long term investors. As the Fed’s “quantitative tightening” (QT – contraction of the Fed’s balance sheet) progresses, we expect liquidity to contract in financial markets. Lower liquidity inevitably leads to volatility.
Since our November 18 commentary, we have been anticipating the focus of financial markets to vacillate between inflation and interest rate concerns on the one hand, and escalating concerns over the extent of economic slowdowns and the effects that a slowdown will have on margins and earnings. This week’s trading in U.S. securities showcased how quickly that this focus could shift. We continue to recommend that long term investors should try to take advantage of this volatility to better position their portfolios. We maintain our year-long conviction to not chase rallies and to buy only on market downturns. A flexible mindset will be a key to navigating financial markets.
Peak Fed Hawkishness?
We believe that this week’s FOMC meeting, along with the “dot plot” included in the Fed’s SEP, could be the peak of Fed “hawkishness.” The “dot plot” shows forecasts of the Fed’s nineteen policymakers’ represented by dots along a vertical scale. According to the latest dot plot, the new projected terminal federal funds rate is about 5.1%. We were struck by the fact that seventeen of the Fed’s nineteen policymakers are now above 5%. As expected, the Fed raised its policy rate 50 basis points (bps), lifting the federal funds rate to the 4.25% – 4.5% range. Fed chair Powell indicated that the Fed still has “some ways to go” in raising rates. In its statement, the FOMC kept the phrase that “ongoing” increases in the target range will be appropriate. But Powell did acknowledge that the policy rate was “getting close to being sufficiently restrictive” enough to help achieve its targeted inflation goal of 2%. After this Fed meeting, we thought that the lyrics from Dua Lipa’s song “We’re Good” were appropriate. “Let’s end this like we should and say we’re good.” We don’t mean to imply that the Fed is done raising rates – just that we believe the projected rate increases will be all that’s needed before the Fed will maintain a “sufficiently restrictive” level of interest rates for “some time.” At that point, we can imagine that many members of the Fed will be able to say: “I think it’s pretty plain and simple; We gave it all we could.” We forecast that the Fed will announce a 25 bps hike on February 1, 2023. We maintain our view that the rate of inflation could dissipate more quickly than many investors and analysts expect. We also believe that financial markets are reflecting the increased probabilities of a U.S. recession. As outlined in our two previous weekly commentaries, we continue to expect that Powell will implement more clearly his new “risk management” approach in the determination of the Fed’s monetary policies.
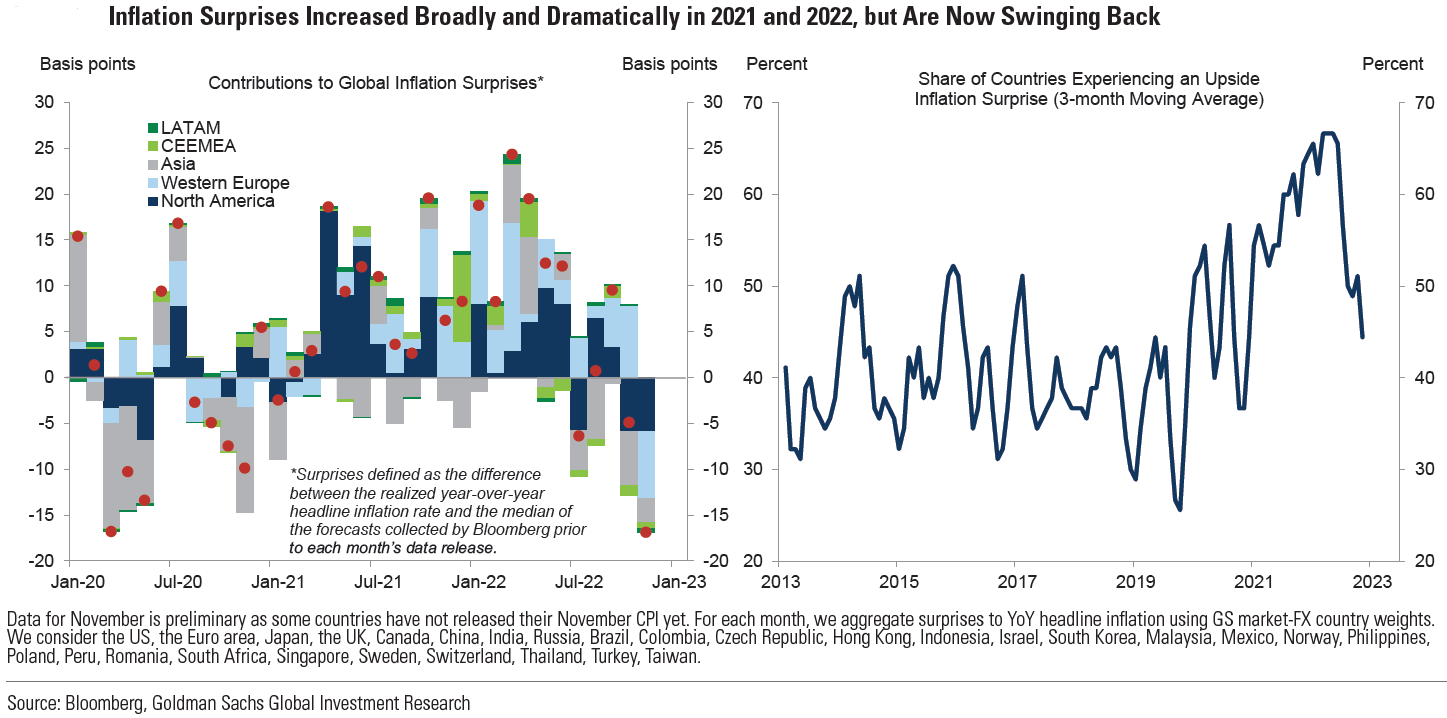
Source: Goldman Sachs, Global Economics Comment: Global Inflation Data Are Now Undershooting Expectations (12-15-2022)
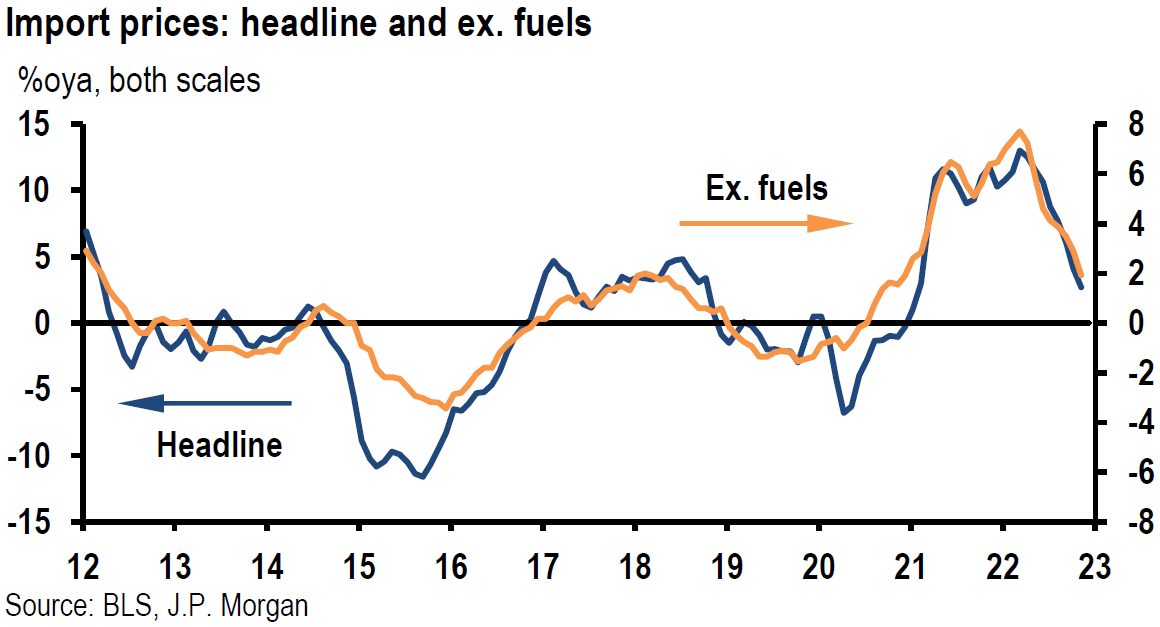
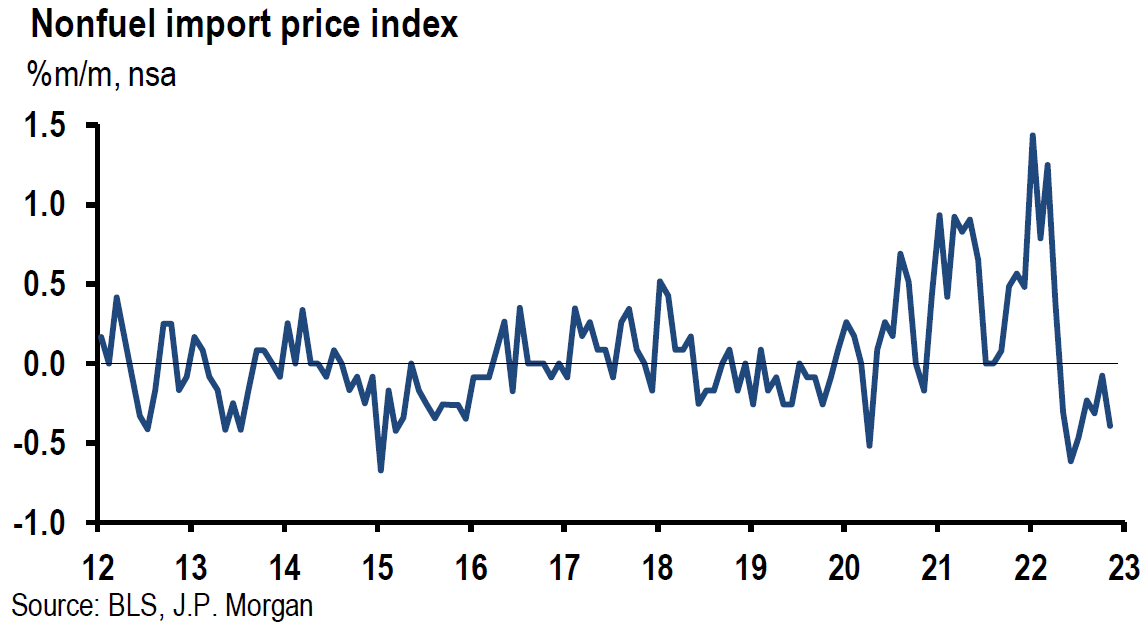
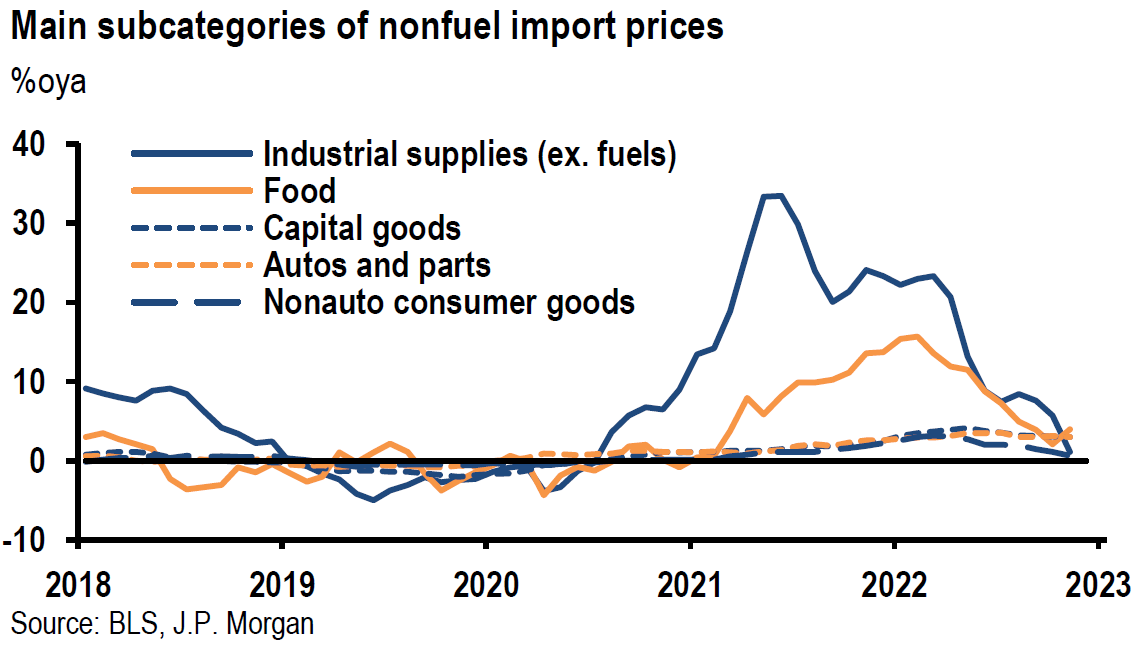
Source: JP Morgan, US: Import prices keep trending lower (12-14-2022)
Financial Markets’ Reaction to Fed’s Decision
Even as the Fed appeared to be more hawkish with respect to raising rates, the yield on Treasury securities remained relatively stable and U.S. dollar (USD) closed lower on the day of the Fed announcement, before rebounding the next day. As we forecasted, the two-to-10-year Treasury yield curve proved to be more variable than the 10-year Treasury yield. This yield curve became less inverted after the Consumer Price Index (CPI) was announced. Then it became somewhat more inverted on the Fed announcement day before becoming more inverted the next day. On Friday, the two-to-10-year Treasury yield curve became less inverted once again. U.S. equities reacted more. They traded lower on Fed announcement day before trading substantially lower the next day. The U.S. Treasury market appears to have been anticipating a recession more than U.S. equities. We believe that Thursday’s more severe downturn in U.S. stocks was more reflective of financial markets seeing increased recession risks.
Powell’s Press Conference
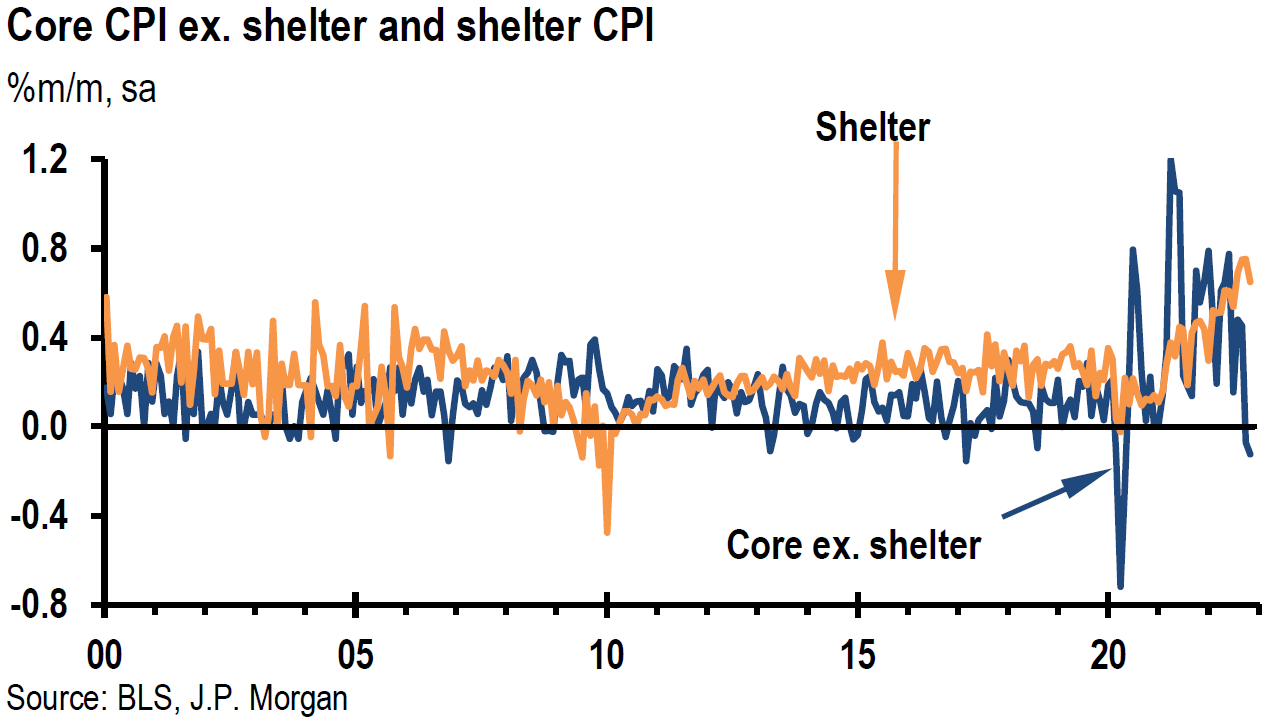
In his press conference after the FOMC announcement of a 50 bps increase in the federal funds rate, Powell indicated that risks to inflation were weighted to the upside. He also acknowledged that the U.S. economy had slowed significantly since last year. He reiterated that the non-housing related services inflation will take a “substantial amount of time to bring inflation down.” This part of inflation could account for as much as 55% of CPI. According to Powell, this is the part of inflation that is most correlated to wage growth, and Powell has seen “little progress in average earnings coming down” in a labor market that is still “extremely tight.” Powell sees the U.S. as having a structural labor shortage, as the labor force participation rate remains stubbornly at a low level. Powell does not see the labor market having a lot of layoffs at least partly due to the “huge” overhang of job vacancies.
December SEP Revisions
The latest SEP released on December 14, showed a decrease in 2023 GDP estimates from a growth rate of 1.2% in September’s SEP to the current projection of a mere 0.5% gain. The unemployment rate for 2023 was now projected to be 4.6%, compared to September’s projection of 4.4%. The personal consumption expenditures (PCE) inflation was now projected at 5.6% for 2022, 3.1% for 2023. 2.5% for 2024 and 2.1 for 2025. This compared to September’s projections of 5.4%, 2.8%, 2.3% and 2.0%, respectively.
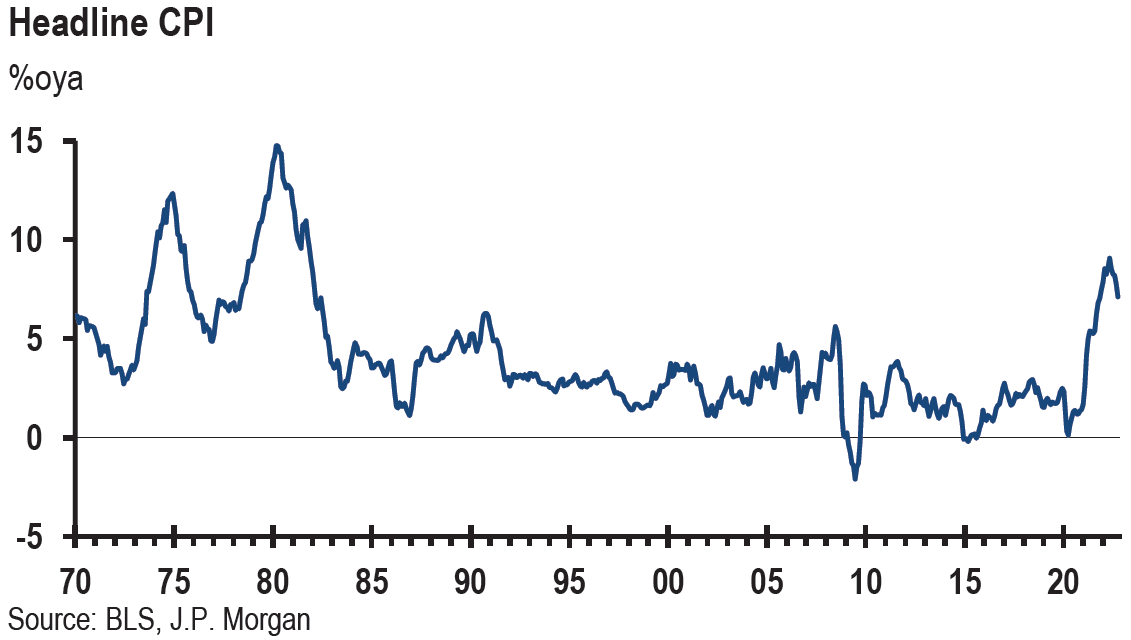
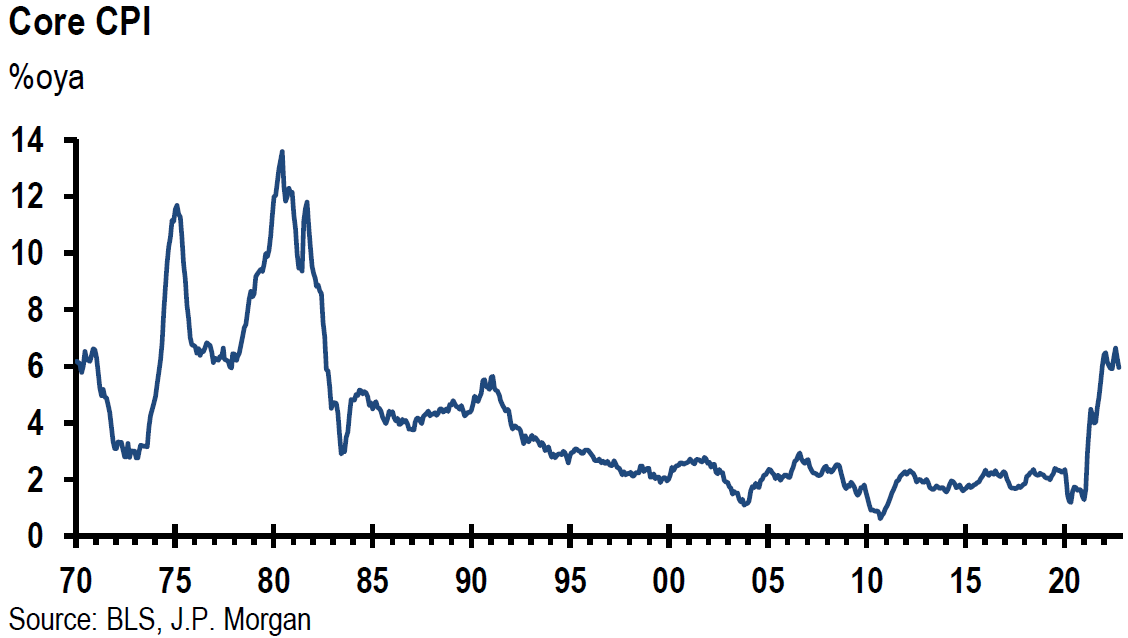
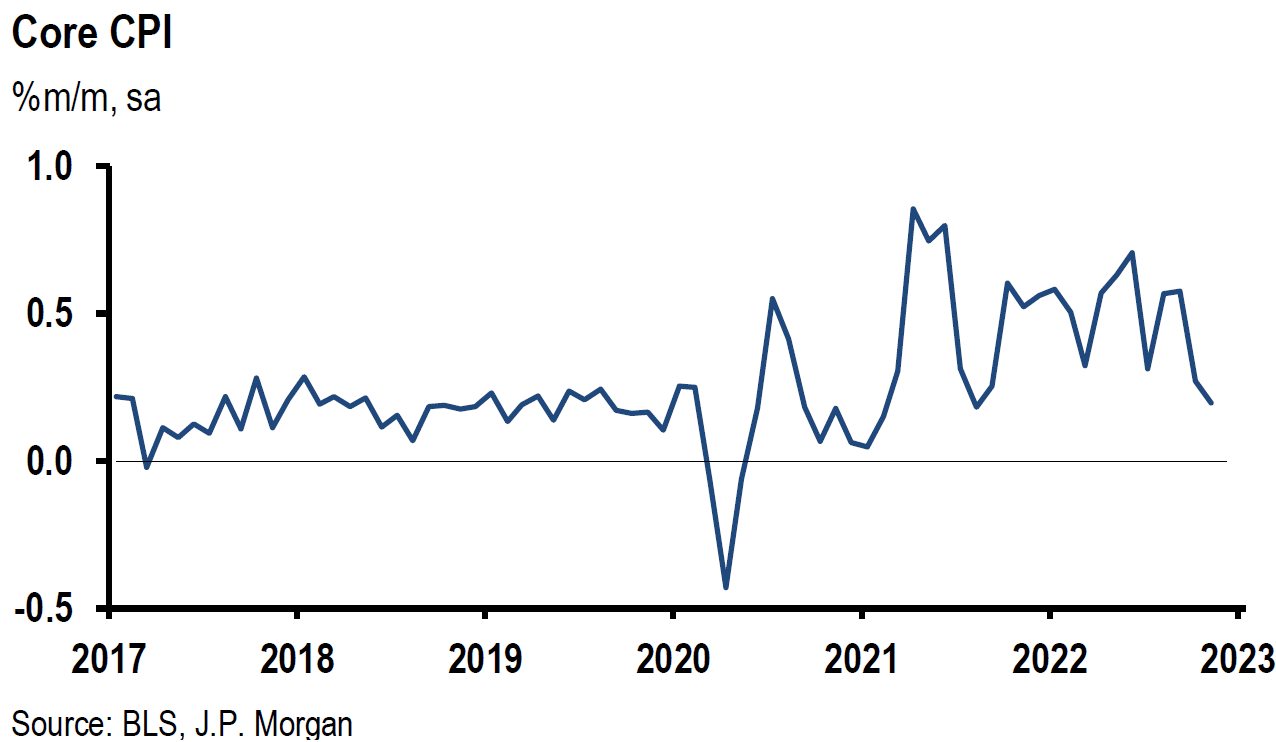
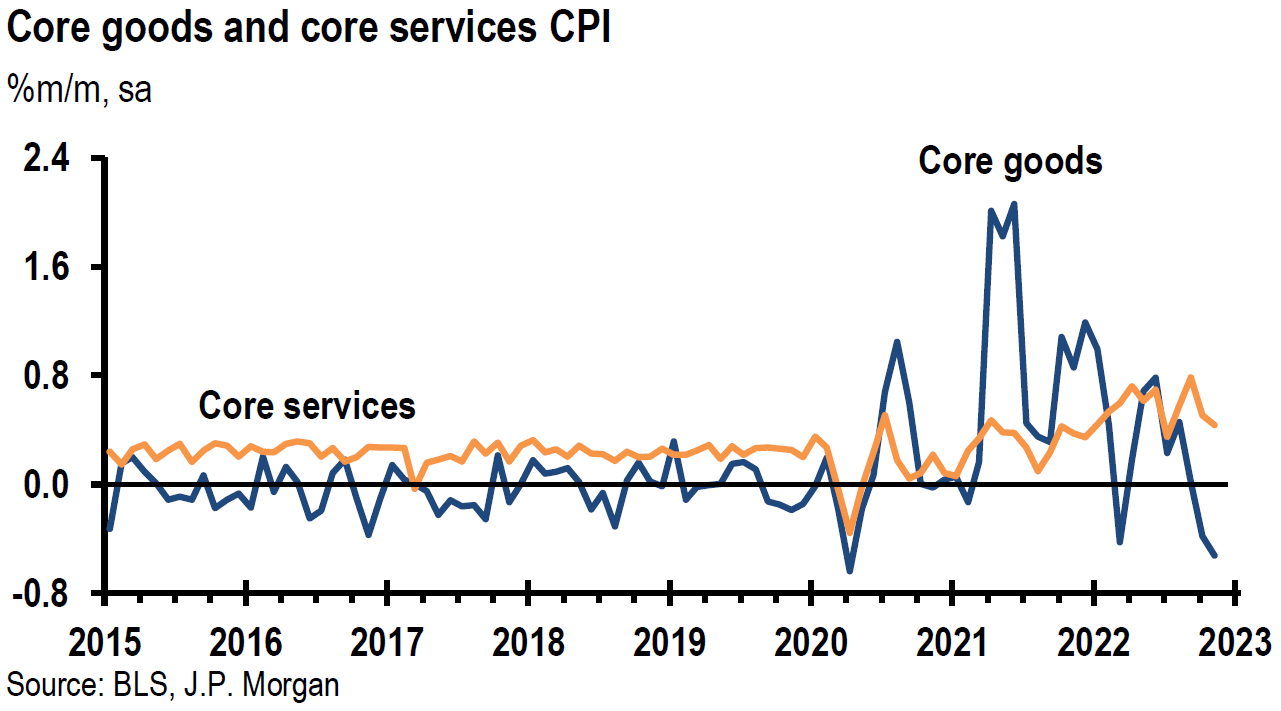
Lower than Expected November CPI
U.S. November Consumer Price Index (CPI) data was announced the day prior to the Fed’s announcement. This data showed less-than-expected increases in inflation. Headline CPI increased 0.1% month-over-month (m/m) and 7.1%year-over-year (y/y) versus expected increases of 0.3% m/m and 7.3% y/y. Core CPI rose 0.2% m/m and 6.0% y/y, versus expectations of 0.3% and 6.1%, respectively. U.S. stocks opened with very large gains that day. We recommended selling some growth and tech stocks close to their opening prices. Some of these stocks had substantial gains since our expressed favorable outlook on selected stocks in these sectors. At the opening prices, we believed that the risk-to-reward ratio was no longer favorable for holding many of these stocks. Most of these stocks were substantially lower by Thursday’s close.
Source: JP Morgan, US: CPI is below expectations (again) (12-13-2022)
New York Fed National Survey of Inflation Expectations Decreased Prior to CPI Release
The New York Fed national survey on inflation expectations announced the day prior to CPI proved rather prescient. One-year inflation expectations dropped 0.7% to 5.2% – the lowest since August 2021. Three-year and five-year inflation expectations dropped 0.1%. Wages were expected to grow 2.8% over the next twelve months, a decrease of 0.2% from October’s reading. But household income was expected to grow 4.5% – 0.2% higher than October’s survey. This was the highest level in this series, which dates back to June 2013. Perceptions of credit access in one year deteriorated.
Inflation Versus Recession Risks – Variable Focus of Financial Markets
In our November 18 commentary – and reiterated last week – we postulated that financial markets’ focus could shift increasingly from inflation and interest rate concerns to concerns about recession risks in rather unpredictable ways. This week was an example of such shifts in the markets’ focus. CPI day saw stock market gains when the focus was on diminishing inflation data. On Thursday, U.S. stocks sank on recession concerns.
ECB and BOE Decisions
Also on Thursday, both the European Central Bank (ECB) and Bank of England (BoE) lowered their rate hikes to 50 bps increases as expected. Both indicated more rate hikes should be expected. But ECB’s rhetoric was more hawkish than anticipated. The ECB stated that there will have to be more rate hikes than previously anticipated, with 50 bps hikes for “a period of time.” Furthermore, the ECB staff also “significantly” raised their inflation projections. Additionally, the ECB announced that their balance sheet also would be reduced starting in March 2023 – a month earlier than many expected. The ECB staff forecasted a short and shallow recession – Q4 2022 and Q1 2023. ECB president Lagarde noted that wage growth “is strengthening.” Unlike the muted Treasury yield response after the Fed’s indication of a higher terminal federal funds rate, European sovereign 10-year bond yields increased substantially on Thursday. German bund yields rose 14 bps, French yields rose 16 bps and Italian yields rose 29 bps. These yields continued to increase into the next day as well. The ECB’s more hawkish approach was not priced fully into European bond yields. In comparison, U.S. bond yields were apparently already pricing in recession risks. We surmise that the more hawkish ECB approach helped exacerbate the downturn in U.S. stocks on Thursday.
U.S. Economic Data Released this Week Was Mostly Below Expectations
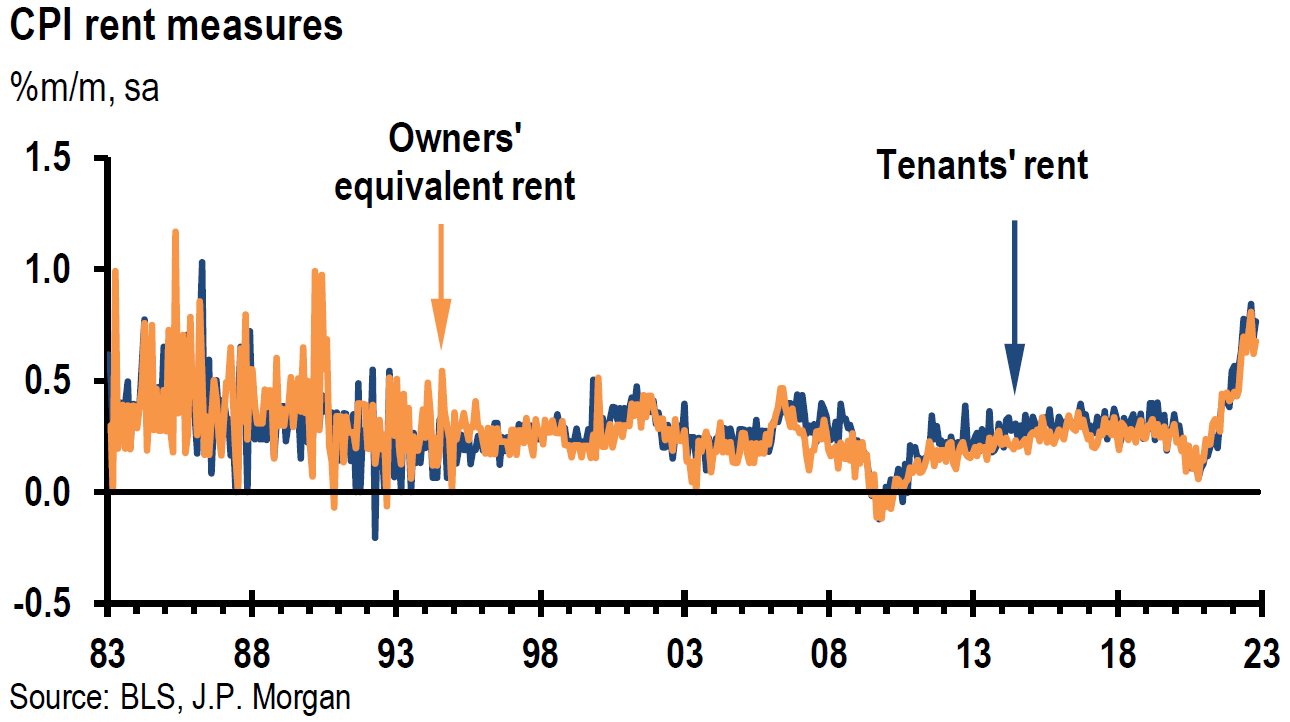
Virtually all of the U.S. economic data released on Thursday was more negative than expected. We believe that these data points increased the focus on U.S. recession risks that helped exacerbate the downturn in U.S. stocks on Thursday as well. U.S. retail sales declined 0.6% m/m in November against expectations for a 0.1% decline. This was the worst monthly decline this year. Certain data shows that holiday shopping was pulled forward into October. The Philadelphia Fed’s December manufacturing index declined more than expected. New orders, shipments and employment components all declined. New orders fell to their lowest reading since April 2020, and the shipments index fell into negative territory for the first time since May 2020. Also, the employment index fell into negative territory for the first time since June 2020. Both the prices paid and received indexes decreased. The prices paid index fell to its lowest level since September 2020. The NY Empire State manufacturing index dropped 16 points m/m to -11.2 in December, versus an expected level of -1.0. This was the steepest deterioration in New York State’s business activity index since August. Industrial production decreased 0.2% in November versus an expected flat reading. Business inventories increased slightly below expectations in October. Initial jobless claims fell 20,000 to 211,000 for the week that ended December 5, versus a median forecast of 232,000. Continuing claims rose 1,000 to 1.671 million versus an expected 1.674 million for the week that ended December 3. These claims numbers substantiated a tight labor market. The New York Fed’s Business Leaders Survey for December, released Friday, showed that the business activity index in the New York area’s service sector declined for the third consecutive month. Employment growth slowed “noticeably” and wage growth “moderated.” The prices received index dropped to its lowest level since mid-2021. We were also encouraged by the 0.4% m/m drop in asking rents in Zillow’s observed Rent Index. This was the largest monthly decline in the seven-year history of this index. The y/y change in asking rents was 8.4% higher. The peak of y/y rent growth reached a peak y/y increase of 17.1% in February.
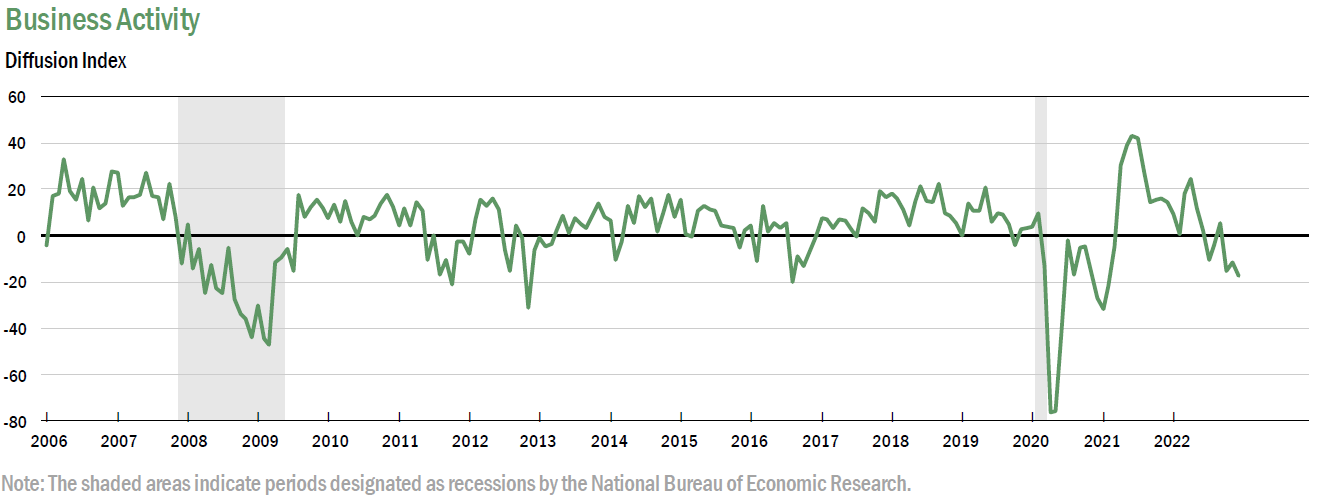
Source: Federal Reserve Bank of New York, Business Leaders Survey (12-2022)
S&P Global Flash U.S. Composite PMI
The December flash estimate Purchasing Managers’ Index (PMI) for the U.S. continued to deteriorate. The flash reading is based om approximately 85% of the usual survey responses. Both manufacturers and service providers registered steeper declines in their outputs. The headline PMI Composite output Index signaled the “joint fastest decline in business activity for over two-and-a-half years. Selling price inflation also “eased” to the slowest pace in over two years. Input process increased at a “notably” softer pace as well. Employment rose only “marginally.” There were a “growing number of reports of lay-offs following weak demand.” The Chief Business Economist at S&P Global Market Intelligence summarized this survey: “In short, the survey data suggest that Fed rate hikes are having the desired effect on inflation, but that the economic cost is building and recession risks are consequently mounting.”
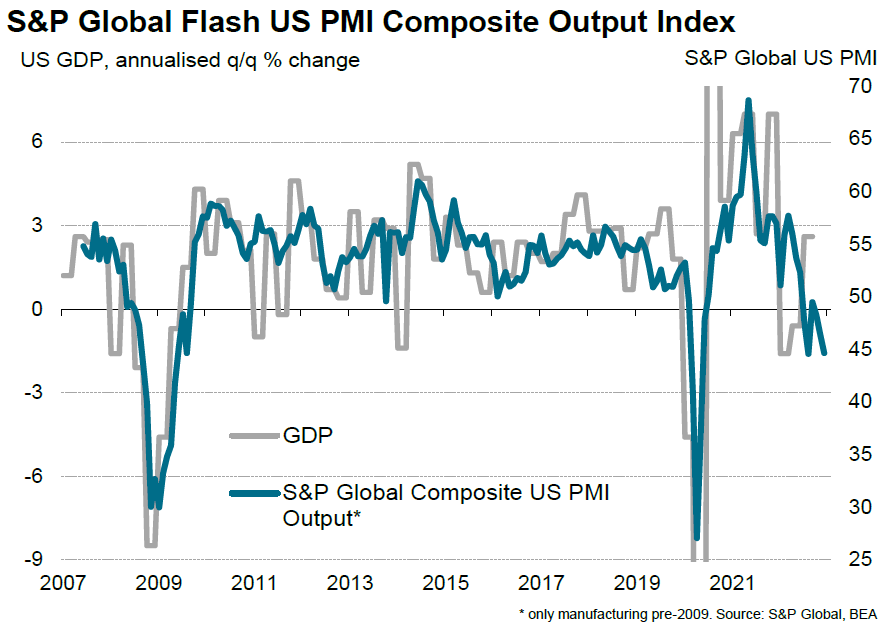
Source: S&P Global, S&P Global Flash US Composite PMI (12-16-2022)
China’s November Economic Data Disappoints Again — More COVID-19 Outbreaks
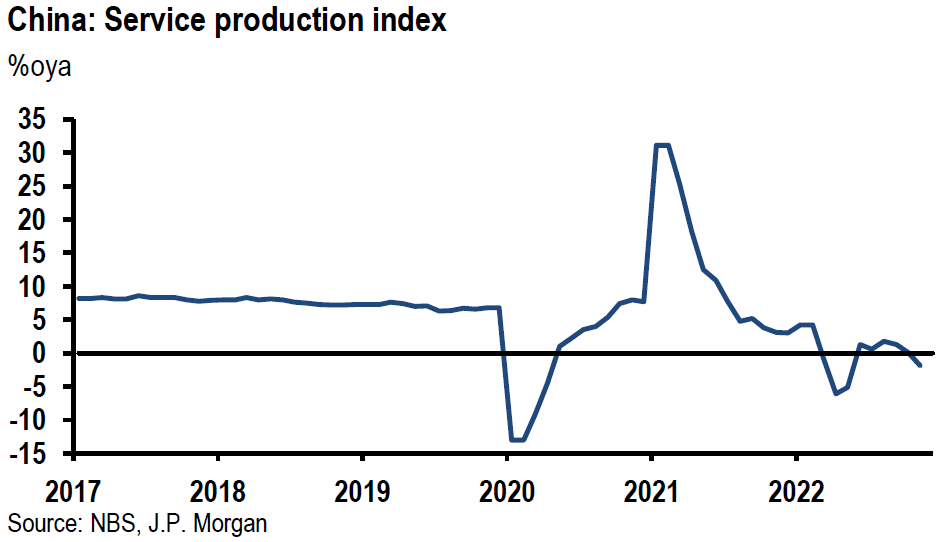
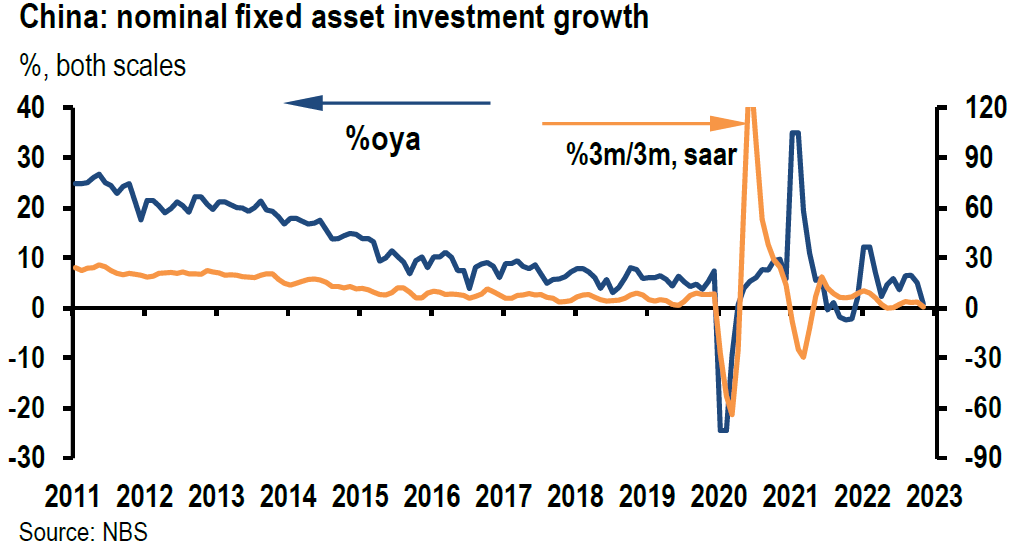
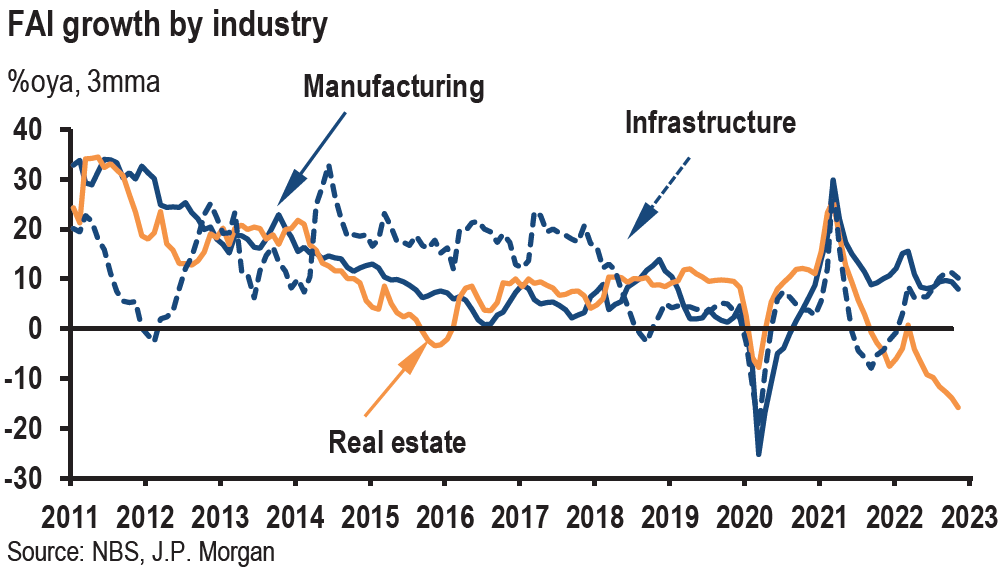
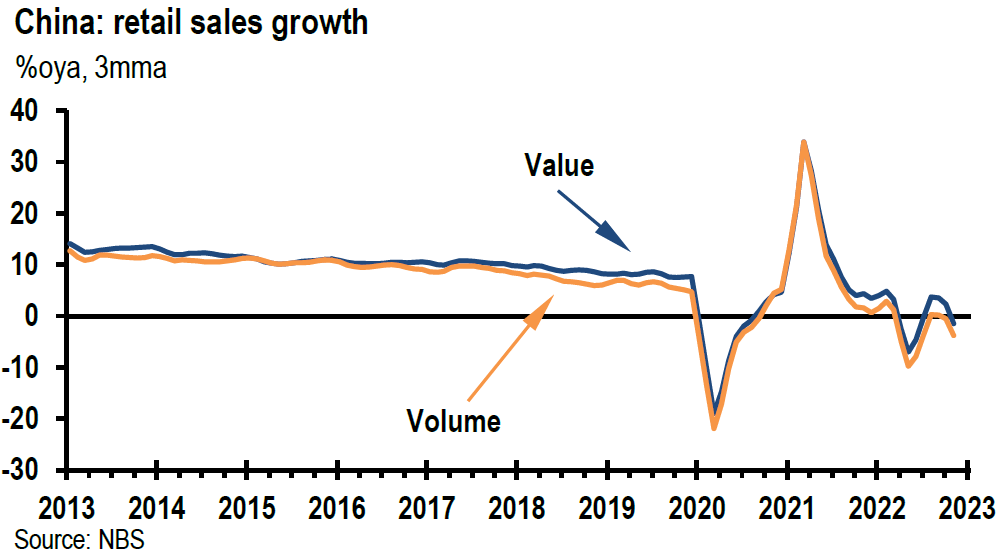
China’s November retail sales fell 4.5% m/m, as well as dropping 5.9% y/y versus an expected 3.7% decline. This is the most significant monthly decline since the Shanghai lockdown in April. Industrial production contracted 2.2% m/m in November versus a 0.6% m/m contraction in October. The year-over-year gain in industrial production was 2.2%, versus an expected gain of 3.6%. Chinese November economic data came in below expectations generally due to COVID-19 infections and related restrictions, continued weakness in the housing sector, and slowing demand for China’s exports. In the last two weeks, local and central government authorities relaxed several COVID-19 related restrictions. Not surprisingly, COVID infections have “soared.” In a report from Thursday, Nomura’s chief China economist stated “the rapid surge of infections in big cities might be only the beginning of a massive wave of Covid infections.” The report added that “we expect major activity indices to remain weak or even to drop further in December. We reckon that the incoming migration around the Chinese New Year holiday in late January could bring about an unprecedented spread of Covid and severe disruptions to the economy.” As we have indicated in our previous commentaries, we expect China’s “reopening” to be a “messy” process, characterized by many “fits and starts.”
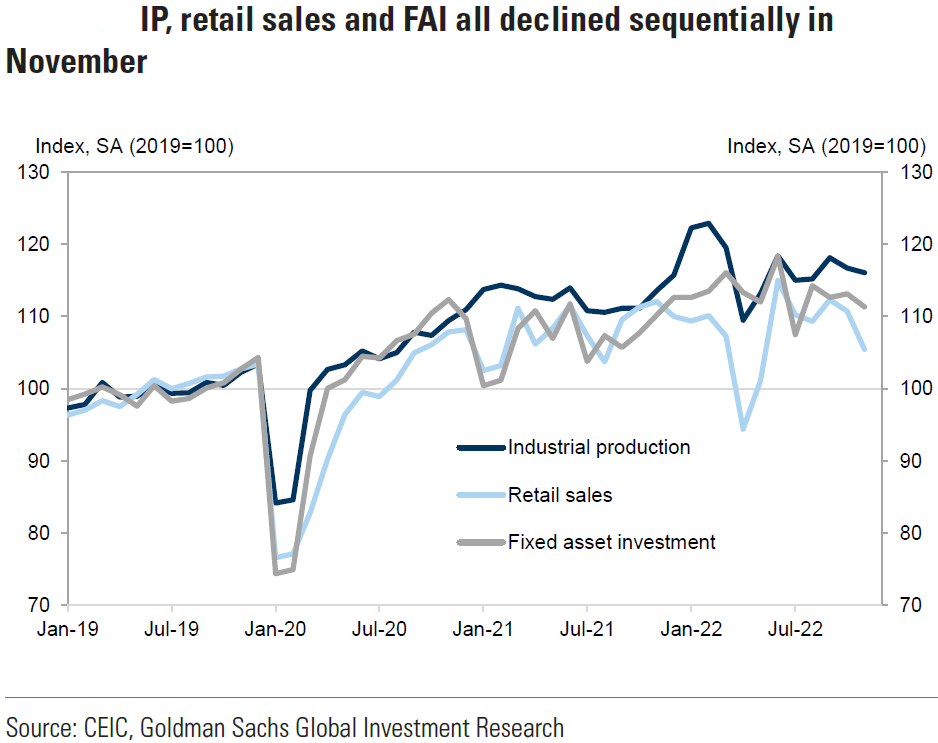
Source: Goldman Sachs, New 2023 GDP forecast and key reopening debates (12-16-2022)
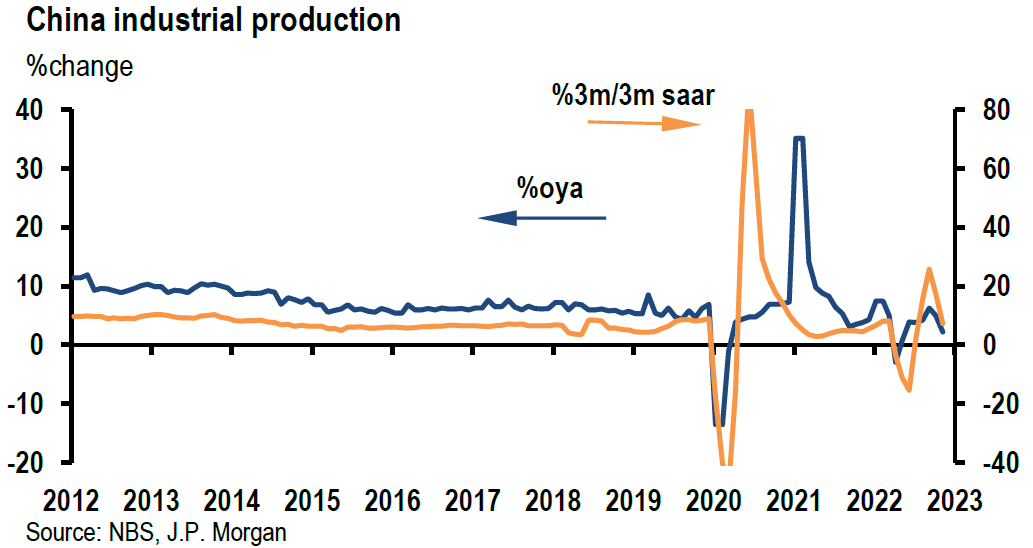
Source: JP Morgan, China (12-15-2022)
Bottom Line
For the time being, we are maintaining our basic investment approach as expressed in last week’s commentary. We continue to prefer high quality big cap stocks that offer good balance sheets, as well as relatively stable cash flows and profit margins. We expect volatility across virtually all financial markets.
This week’s trading in U.S. financial markets, especially U.S. equities, showcased how quickly the focus of financial markets can shift between concerns about inflation and interest rates on the one hand, and recession risks on the other. The contrast this week between the dramatic rise in interest rates in Europe in response to a more hawkish ECB and to the much more muted interest rate response to a more hawkish Fed was rather striking. The European markets had not priced in a more aggressive ECB, whereas the U.S. fixed income market evidently had already priced in a more hawkish Fed. We continue to try to focus on what’s priced into various financial markets so that we might better take advantage of volatility. Every day, we ask ourselves, what assumptions are priced into financial markets and do we agree with these assumptions.

Definitions
Federal Funds Rate – The term federal funds rate refers to the target interest rate set by the Federal Open Market Committee. This target is the rate at which commercial banks borrow and lend their excess reserves to each other overnight.
Federal Open Market Committee (FOMC) – The Federal Open Market Committee (FOMC) is the branch of the Federal Reserve System that determines the direction of monetary policy specifically by directing open market operations. The committee is made up of 12 members: the seven members of the Board of Governors; the president of the Federal Reserve Bank of New York; and four of the remaining 11 Reserve Bank presidents on a rotating basis.
Fed Dot Plot – The Fed dot plot is published quarterly as a chart showing where each of the 12 members of the FOMC expect the federal funds rate to be for each of the next three years and the long term.
Fed’s Summary of Economic Projections (SEP) – The Federal Reserve releases a summary of Federal Open Market Committee participants’ projections for GDP growth, the unemployment rate, inflation, and the appropriate policy interest rate. The summary also provides information regarding policymakers’ views on the uncertainty and risks attending the outlook. This happens four times every year.
Basis Points (bps) – A basis point is one hundredth of one percent, used chiefly in expressing differences of interest rates.
Inverted Yield Curve – An inverted yield curve describes the unusual drop of yields on longer-term debt below yields on short-term debt of the same credit quality. Sometimes referred to as a negative yield curve, the inverted curve has proven in the past to be a relatively reliable lead indicator of a recession.
Initial Unemployment Insurance Claims – Initial claims are new jobless claims filed by U.S. workers seeking unemployment compensation, included in the unemployment insurance weekly claims report.
Continuing Claims – Continuing claims track the number of U.S. residents filing for ongoing unemployment benefits in a given week. Continuing claims measure ongoing unemployment benefits, which is in contrast to initial claims, which track new filings for benefits.
Composite Purchasing Managers’ Index PMI – A composite Purchasing Managers’ Index (PMI) is the weighted average of manufacturing and service sector PMIs for a given geography or economy.
Headline Inflation – Headline Inflation is the raw inflation figure reported through the Consumer Price Index (CPI) that is released monthly by the Bureau of Labor Statistics (BLS). The CPI calculates the cost to purchase a fixed basket of goods to determine how much inflation is occurring in the broad economy.
Core Inflation – Core inflation is the change in the costs of goods and services, but it does not include those from the food and energy sectors. This measure of inflation excludes these items because their prices are much more volatile.
IMPORTANT DISCLOSURES
The views and opinions included in these materials belong to their author and do not necessarily reflect the views and opinions of NewEdge Capital Group, LLC.
This information is general in nature and has been prepared solely for informational and educational purposes and does not constitute an offer or a recommendation to buy or sell any particular security or to adopt any specific investment strategy.
NewEdge and its affiliates do not render advice on legal, tax and/or tax accounting matters. You should consult your personal tax and/or legal advisor to learn about any potential tax or other implications that may result from acting on a particular recommendation.
The trademarks and service marks contained herein are the property of their respective owners. Unless otherwise specifically indicated, all information with respect to any third party not affiliated with NewEdge has been provided by, and is the sole responsibility of, such third party and has not been independently verified by NewEdge, its affiliates or any other independent third party. No representation is given with respect to its accuracy or completeness, and such information and opinions may change without notice.
Investing involves risk, including possible loss of principal. Past performance is no guarantee of future results.
Any forward-looking statements or forecasts are based on assumptions and actual results are expected to vary from any such statements or forecasts. No assurance can be given that investment objectives or target returns will be achieved. Future returns may be higher or lower than the estimates presented herein.
An investment cannot be made directly in an index. Indices are unmanaged and have no fees or expenses. You can obtain information about many indices online at a variety of sources including: https://www.sec.gov/fast-answers/answersindiceshtm.html or http://www.nasdaq.com/reference/index-descriptions.aspx.
All data is subject to change without notice.
© 2024 NewEdge Capital Group, LLC


