

Weekly Summary: September 19 – September 23, 2022
Key Observations:
- The Federal Reserve (Fed) raised the federal funds rate at its meeting this week to a “restrictive” range of 3.0% – 3.25%. The Fed raised its projected rate hikes more than expected. The Fed made clear its commitment to do “whatever it takes” to get inflation down to its 2% target.
- We surmise that U.S. recession risks have increased along with the Fed’s more aggressive path of interest rate hikes. We interpret the Fed’s pre-determined path to “terminal” federal funds rates for year end and for 2023 as not data dependent. We were disappointed to see the Fed’s lack of patience, in our opinion, to not wait to see and examine incoming economic data before deciding on embarking on a rate hike path that exceeded our expectations.
- We have highlighted the relative illiquidity in many financial markets. Including the U.S. Treasury market for many months. The extreme moves in currency, fixed income and commodity markets that have become even more evident this week have raised our concern of a potential market “dislocation” of some kind at some point.
- We maintain our view that most of the economic data that we have analyzed continues to exhibit at least the beginnings of a less tight U.S. labor market and lowered inflation trajectory. After the disclosure of the Fed’s latest restrictive monetary policies, we are less optimistic that the Fed will show patience. We now see an increased probability of excessive tightening by the Fed.
The Upshot: Our general investment approach remains the same as depicted in last week’s commentary. We maintain our preference for big cap high quality stocks with good balance sheets, relatively stable cash flows and stable margins. Continued volatility across sectors this week is supportive of a well-diversified portfolio for long-term investor. We are not at all surprised by the extreme volatility in financial markets post the Fed meeting this week. The Fed’s new approach has lowered the risk/reward calculus for equity levels. Long-term investors should be prepared to live through a period of increased volatility. Advantageous buying opportunities will continue to appear on a selective basis. Prudent stock picking should lead to outperformance over time. Patience will be important in seeking to achieve positive returns. The Fed’s projected higher federal funds rates should increase the risks of a U.S. recession and downside risks for equities. This should present excellent buying opportunities at the appropriate time. We believe that the best way for long-term investors to achieve positive returns is to show patience and be opportunistic as great buying opportunities arise.
The confluence of central bank tightening this week and the Japanese attempts to stabilize their currency are all reminders that volatility and lessening liquidity in many financial markets are a global phenomenon. The UK attempts to stabilize their economy through tax cuts and caps on energy costs along with rising deficits is proving to be very problematic.
We still expect to see more companies revising downwardly their estimates for earnings and margins that could accentuate downward pressure on equities. We maintain our conviction that equities should only be purchased on market downturns. We believe that selective stock picking will continue to play a critical role in outperformance. As mentioned in recent commentaries, seasonal factors may play a role in market volatility. The volatility of the past few weeks seems to be following the seasonal script.
Fed Raises Level of Frontloading Rate Hikes
The Fed was just as forceful as Imagine Dragons in their song “Whatever It Takes” in announcing their very aggressive monetary tightening stance for getting down “more purposefully” to its 2% targeted inflation rate. The Fed was determined to take “forceful steps” to align better supply and demand in the still extremely tight U.S. labor markets. Furthermore, the Fed remains “strongly committed” to these goals. Also, the Fed reiterated that they remain data dependent in formulating their decisions on a meeting-to-meeting basis. But, as we highlighted in our August 9 commentary, the “frontloading” approach of raising the federal funds rate has very little to do with the latest incoming data or even the latest trends of data. In our opinion, the so-called data-dependent approach by the Fed will hopefully become more evident after the Fed achieves whatever terminal federal funds rate it deems restrictive enough before it can pause its rate hikes and then watch to see the lagged effects of its monetary policies. Fed chair Powell stated on Wednesday that Fed policy changes affect financial conditions almost “immediately” and then there is a lag between financial conditions tightening and their effects on the economy. In last week’s commentary, we were still hoping that the Fed would be “patient” enough to examine incoming economic data prior to their November and December meetings before deciding to increase the federal funds rate beyond 4%. After Powell’s press conference and our review of the Fed’s “Summary of Economic Projections” (SEP), our hopes for the Fed to exhibit a more patient approach that was more data dependent were dashed.
Fed Dot Plot
The so-called “dot plot” accompanied the SEP that was released on Wednesday at the conclusion of the Fed’s meeting. The dot plot is a chart that reflects each Fed official’s projection of the “appropriate” midpoint for the federal funds rate at the end of the calendar year for the following three years. Dots are also reflective of each official’s views in regard to real Gross Domestic Product (GDP), unemployment rates, personal consumption expenditures (PCE) inflation and PCE core inflation. Compared to the June SEP, there were substantial changes – GDP growth rates were lower, unemployment rate projections were higher, inflation rates were higher and federal funds rate projections were higher as well. The most important news of this Fed meeting was reflected by the dot plots. The financial markets focused particularly on the federal funds rate projections for year-end 2022 and full-year 2023. The median dot’s 2002 year-end federal funds rate was now projected at 4.4% versus the June projection of 3.4%. The year-end projection for 2023 rose from 3.8% to 4.6%. Most analysts assumed that the 2023 rate would be achieved very early next year. Powell made a point of saying that he thought that the 4.6% in the federal funds rate would be achieved in fact. But he also acknowledged positive trends that should help lower inflation – slower U.S. economic growth, slower consumer spending, housing activity that weakened significantly, and restrained U.S. exports driven by weaker economic growth abroad. None of these positive trends seemed to matter to Powell. Instead, his focus was on the “extremely tight” U.S. labor market with its imbalance of excess labor demand over insufficient labor supply.
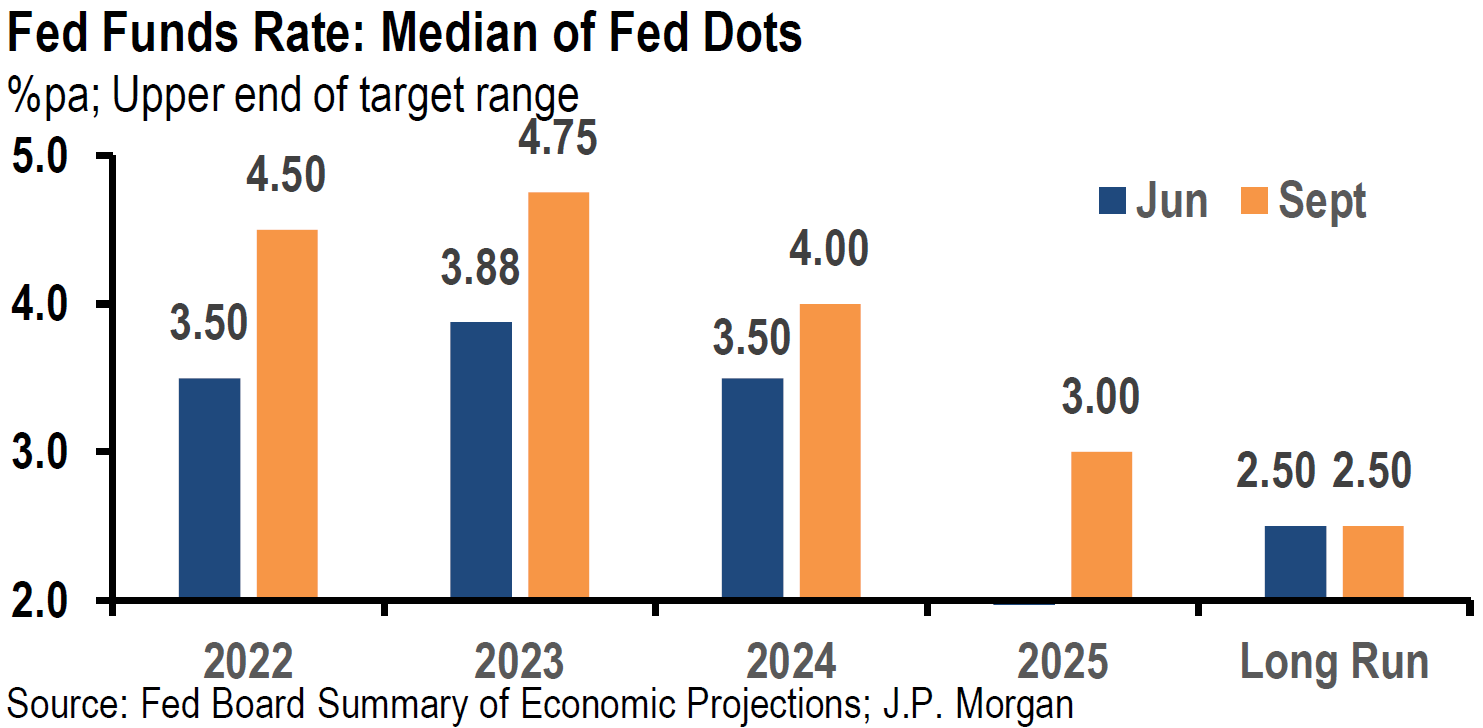
Source: JP Morgan, Daily Economic Briefing (9-21-2022)
Fed to “Keep at It”
Powell’s assessment that consumer expectations remain “well-anchored”, which should make it easier for the Fed to lower inflation, did not appear to factor into the Fed’s aggressive frontloading approach. Powell made it clear that his policy stance had not changed since his Jackson Hole speech as he reiterated that the Fed will “keep at it” until it completes its job – getting inflation back down to its 2% target. To get the job done, the Fed needed the funds rate to be in restrictive territory. Powell believed that, after the 75 basis points (bps) hike at this meeting pushed the federal funds rate into the 3.0% – 3.25% range, this was the bottom level of what could be considered restrictive territory. Powell judged that there was quite “a ways to go” in raising rates. According to Powell, the Fed was “committed” to getting to the desired restrictive range “quickly.” Before the Fed could pause its rate hikes, Powell believed that the Fed needed to see U.S. economic growth below trend, a “softening” of the labor market and “compelling” evidence that inflation was slowing. Powell thought that a 1.8% real GDP growth rate for the U.S. was “trend” growth. Additionally, Powell acknowledged that to the extent that the federal funds rate was raised and the longer that it remained at an elevated level, the chances of a “soft landing” for the U.S. economy would be diminished and “challenging.” Powell also saw the need for real interest rates to be positive across the yield curve.
Expectations for Fed’s November and December Meetings
Although the median dot for the federal funds rate implied another 125 bps combined hikes at the Fed’s next two meetings in November and December, Powell disclosed that there was another large group of Fed officials that believed that an additional 100 bps should be sufficient. Powell was noncommittal as to which way he was leaning on this issue. To keep the Fed’s flexibility on this issue, we now expect the November hike to be another 75-bps hike. Then December’s hike could be either 50 bps or 25 bps to achieve the desired level of hikes for 2022. We think it would be too awkward for the Fed to raise the rate 50 bps in November and then go back to a 75-bps hike for December.
Increased Recession Risks
Powell emphasized the Fed’s commitment to bringing inflation down to its targeted 2% level when he admitted that “no one knows if we will get a recession or how deep it will be” as the Fed maintained the federal funds rate in very restrictive territory for “some time.” In spite of this possibility, Powell believed that the Fed should maintain such a level until it was confident that inflation was “coming back down.” Powell stated that there was a “high likelihood” of having much lower GDP growth. Such a period was needed so that the Fed could achieve its job of delivering price stability. A higher unemployment rate and a softer labor market were needed. In Powell’s estimation, there was “no painless way to bring inflation down.”
Shelter Costs
In addition to concerns over U.S. labor market tightness and elevated nominal wages, many economists are focused on elevated shelter costs and the persistence or “stickiness” of such costs. Powell mentioned shelter costs just in passing. He believed that shelter cost inflation would remain high for “some time” and that it would remain “pretty high for a while.” He added that part of inflation was due to supply shocks. As discussed in last week’s commentary, we also see shelter costs remaining elevated for a time, but we see also the beginnings of a slowing of such costs in the months ahead. However, Powell consistently made clear that his focus was on the labor market and that a labor market softening was a critical component in the Fed’s goal of reining in inflation.
Changes in FOMC Statement
The only noteworthy change in the FOMC statement after its meeting this week when compared to its last meeting on July 26 and 27, was that the prior statement that referred to recent indications of spending and production having “softened,” whereas the present FOMC statement referenced recent indications that pointed to “moderating growth” in spending and production.
Financial Market Reaction to Fed’s Latest Policies
Financial markets’ reaction to the Fed’s pronouncements and Powell’s statements during the Wednesday press conference appeared rather confused wavering between gains and losses. At one point, major U.S. equity indexes were positive by as much as 1% before reversing and closing with losses well in excess of 1%. We were very surprised and puzzled to see any positive equity market reaction to the Fed’s much more hawkish stance. We were particularly disappointed that the Fed was determined to increase frontloading federal funds rate increases irrespective of any incoming economic data. In our opinion, the Fed showed no “patience” in waiting for new data. In other words, we failed to see any real data dependency. All we saw was a pre-determined course of action. Both the two-year and the 10-year Treasury yields rose initially. The two-year yield held onto the bulk of its gains as the 10-year yield finished lower. The two-year-to-10-year yield curve inverted further from 39 bps the prior day to a 51 bps inversion on Wednesday. This was the largest inversion spread for this part of the Treasury yield curve since the early 1980’s. We interpreted this greater inversion as an indication that at least the bond market believed that the Fed’s projected increased tightening pace would harm the U.S. economy excessively. The 10-to-30-year yield spread also became very slightly inverted, which has been a much rarer occurrence. The U.S dollar (USD) continued to rise on Wednesday as well. The 10-to-30-year yield curve inversion became more pronounced the next day as the two-to-10-year yield inversion gave back 10 bps of its prior day’s inversion. We were rather surprised to see the extent of the steepening of the two-to-10-year Treasury yield spread on Thursday. During Friday’s trading, the 2-10-year Treasury yield spread inverted to over 50 bps once again. We will continue to monitor very closely the daily moves in bond market yields as we hope to understand better what is priced into financial markets. Unlike the Fed, we need to see more data before we can appreciate more fully the underlying causes of the extent and timing of yield curve inversions.
Other CB Hikes and Actions
The Fed and the Treasury markets are not operating in isolation and sometimes it can become rather difficult to understand each day’s movements since many factors could be influencing a particular day’s trading. Many central banks (CBs) have hiked their key policy rates this week. Included in this group are Sweden’s CB that hiked its key policy rate 100 bps early this week, Norway’s CB 50 bps, Swiss National Bank 75 bps, Bank of England (BOE) 50 bps and Indonesia’s CB 50 bps. The BOE hike was approved by a five-to-four vote, with three dissenters preferring a 75 bps hike. The Bank of Japan (BOJ) kept its very low interest rates and its Governor Kuroda added that “we will not be raising rates for some time.” Instead, Japan chose to intervene in the currency markets to prop up the yen against the USD for the first time since 1998. Unlike 1998, certain Fed facilities now in place have obviated the need for Japan to sell Treasuries before they can sell USD. But because Japan wants to at least stabilize the yen versus USD, we assume that Japan will not be a significant buyer of Treasuries. As we have indicated in prior commentaries, the Treasury market is less liquid than it was in past years. The Fed has expressed concern over this relatively illiquid Treasury market. The runoff of more Treasuries from the Fed’s balance sheet – quantitative tightening (QT) – will most likely exacerbate illiquidity. This has added to Treasury market volatility.
U.S. Labor Market
The initial jobless claims – new claims for unemployment benefits – released by the U.S. Labor department on Thursday for the week ended September 17, increased 5,000 to 213,000 from the prior week’s level, which was revised down 5,000 versus an expected level of 218,000. The continuing claims report showed that the number of people receiving unemployment benefits shrank unexpectedly 22,000 to 1.379 million for the week ending September 10. These weekly jobless claims reports generally are considered to be among the most up-to-date indicators of labor market tightness. These latest claims continue to show a tight U.S. labor market. Unfortunately, these data points would appear to support Powell’s claim that the labor market continues “to be out of balance.” However, some nonofficial indications are beginning to show perhaps a less tight labor market. On September 21, J.P. Morgan (JPM) reported that national restaurant chains said it was easier to hire workers and that staffing levels were approaching pre-pandemic levels. On September 20, CNBC disclosed a PricewaterhouseCoopers (PwC) survey that showed 50% of firms expected to reduce their labor force over the next six to twelve months.
Nonofficial Inflation Indications
There are many nonofficial sources that may indicate slowing inflationary trends before they are reflected in official government statistics. Two such sources were indicated in the JPM’s September 21 report referenced above. The Manheim Used Vehicle Index fell 4% in August and was 2.3% lower month-to-date in September. This index tends to lead the official government data by one-to-three months. The closely followed Zillow index of rents peaked at about 17% in rent increases and was down to about 12% in rent increases for August. The Zillow figures were showing clearly a declining trend in rents that were not seen yet in the official data on rental costs. The pre-COVID-19 rent increases were typically around 4%.
Housing Weakens Further
The housing data that we examined this week generally supports Powell’s observation that the “housing sector has weakened significantly.” This week’s data is also a continuation of recent disappointing housing data summarized in some of our recent weekly commentaries. The data presented below should make it quite evident that higher interest rates are weighing on the U.S. housing market.
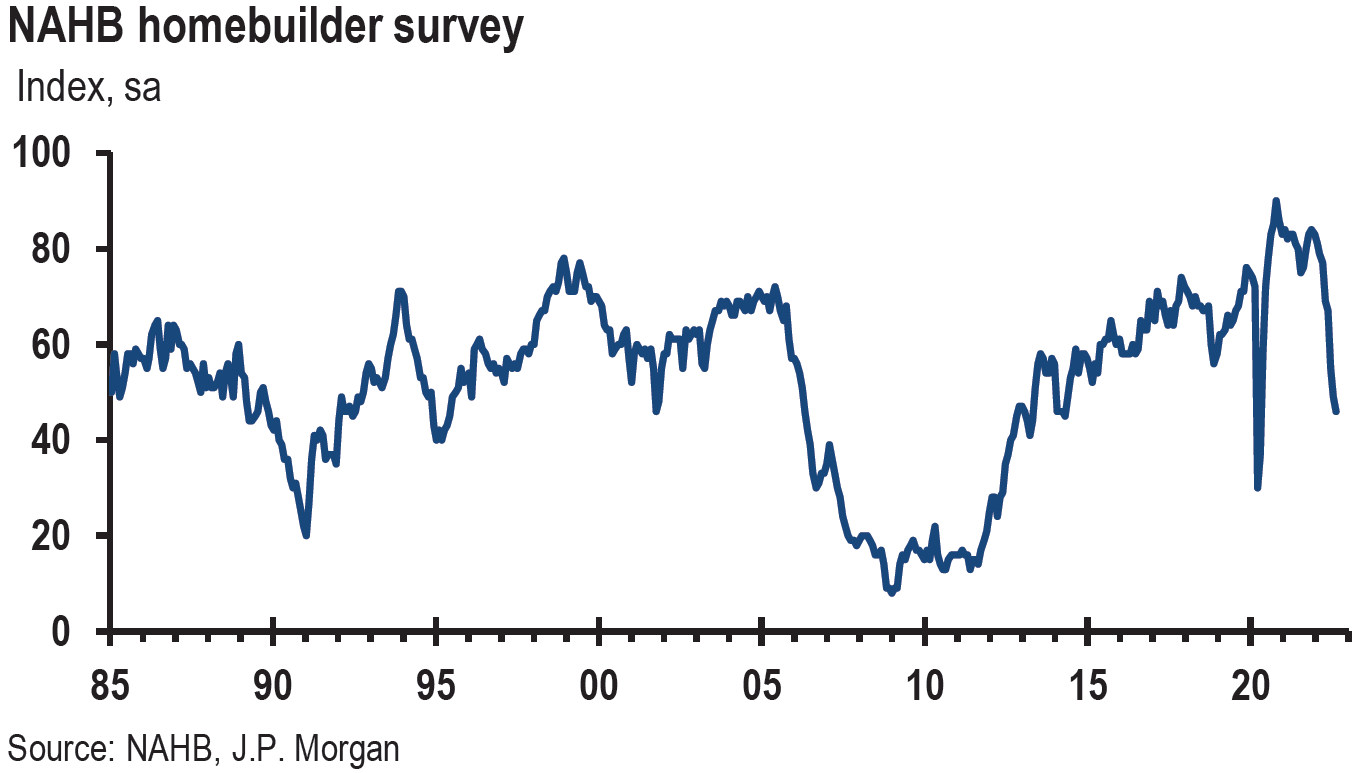
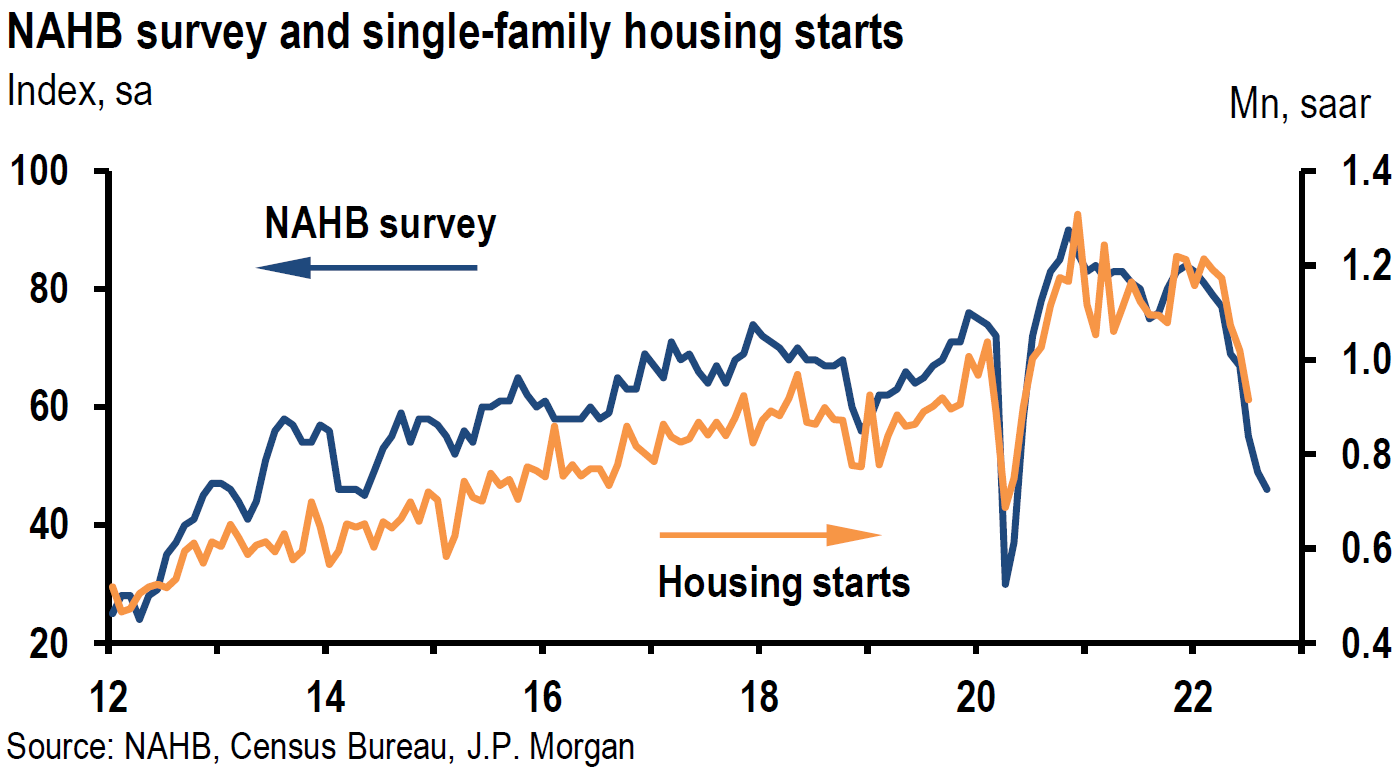
The National Association of Home Builders (NAHB) Housing Market Index (HMI) fell for the ninth straight month in September to 46 versus 47 expected and 49 in August. Except for spring 2020, this was the lowest reading of home builders’ confidence for newly built single family homes since May 2014. Current sales conditions declined three points to 54, sales expected in the next six months declined one point to 46 and traffic of prospective buyers fell one point to 31. Twenty-four percent of builders reported reducing prices in September compared to 19% in August. Mortgage rates above 6% last week were the highest since 2008. CNBC reported Thursday that the 30-year fixed-rate mortgage was quoted at 6.62%. This compares to a rate close to 3% to start this year. According to the chief economist of NAHB, more than half the builders in the survey reported “using incentives to bolster sales, including mortgage rate buy-downs, free amenities and price reductions.”
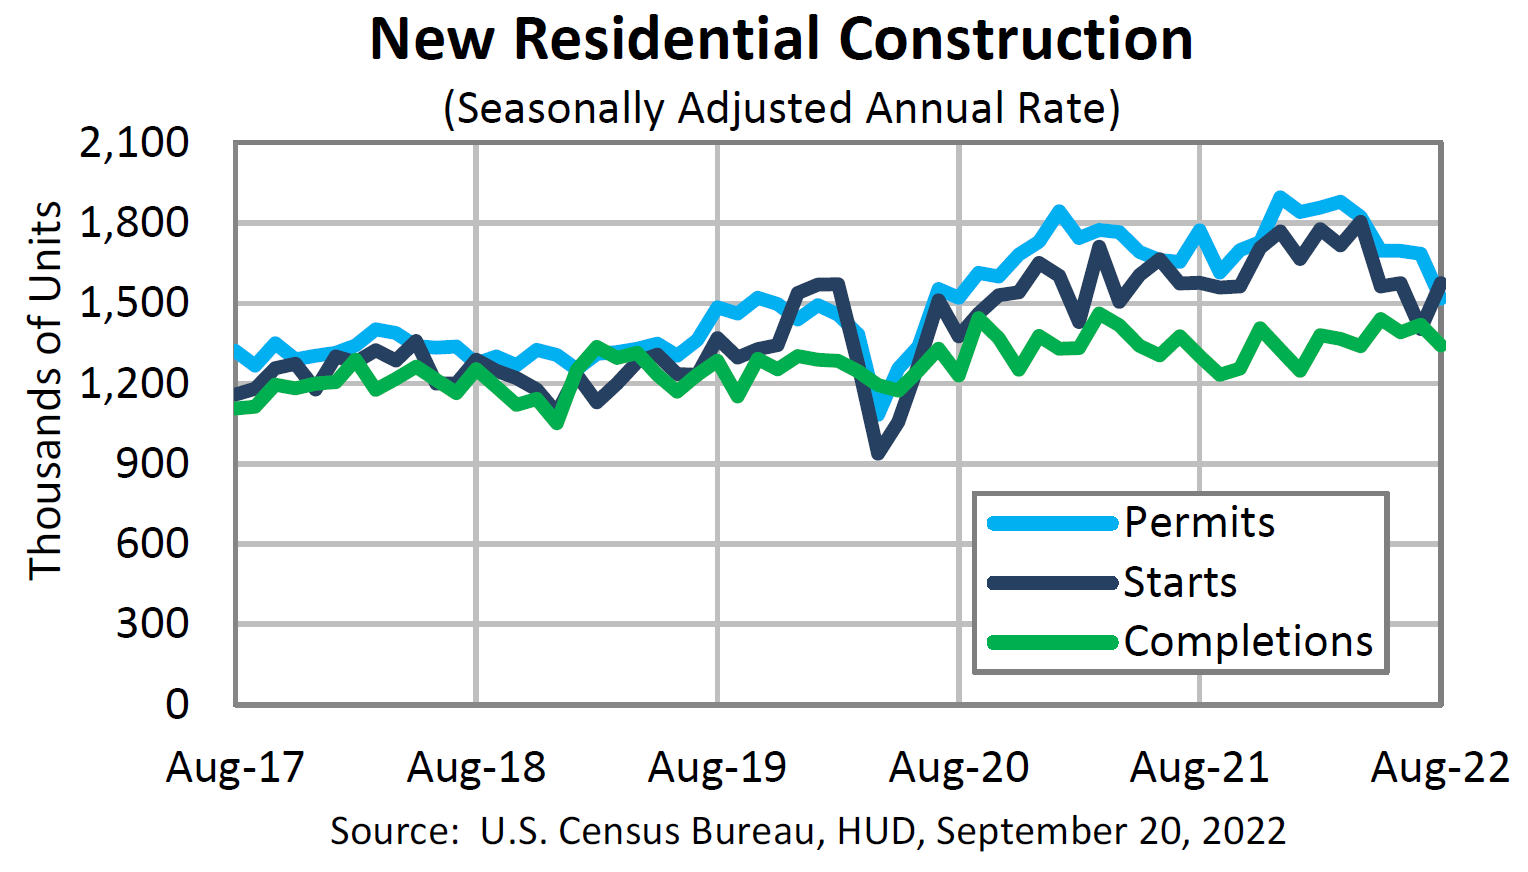
The August housing starts and house building permits showed a mixed picture. The housing starts were greatly exaggerated by the multifamily starts increasing 28% month-over-month (m/m) and by the downtick in mortgage rates in August. Overall housing starts increased 12.2% m/m in August and were 0.1% lower year-over-year (y/y). Starts for single family homes rose 3.3% m/m in August. July’s housing starts were revised to 10.9% lower m/m. Building permits for August fell 10% m/m and were 14.4% lower y/y. Multifamily permits declined 17.9% m/m in August and single family permits were 3.5% lower, marking the sixth straight monthly decline. According to CNN on September 20, multifamily building in August was at its highest level in 35 years, as rents remained at record levels in many parts of the U.S.
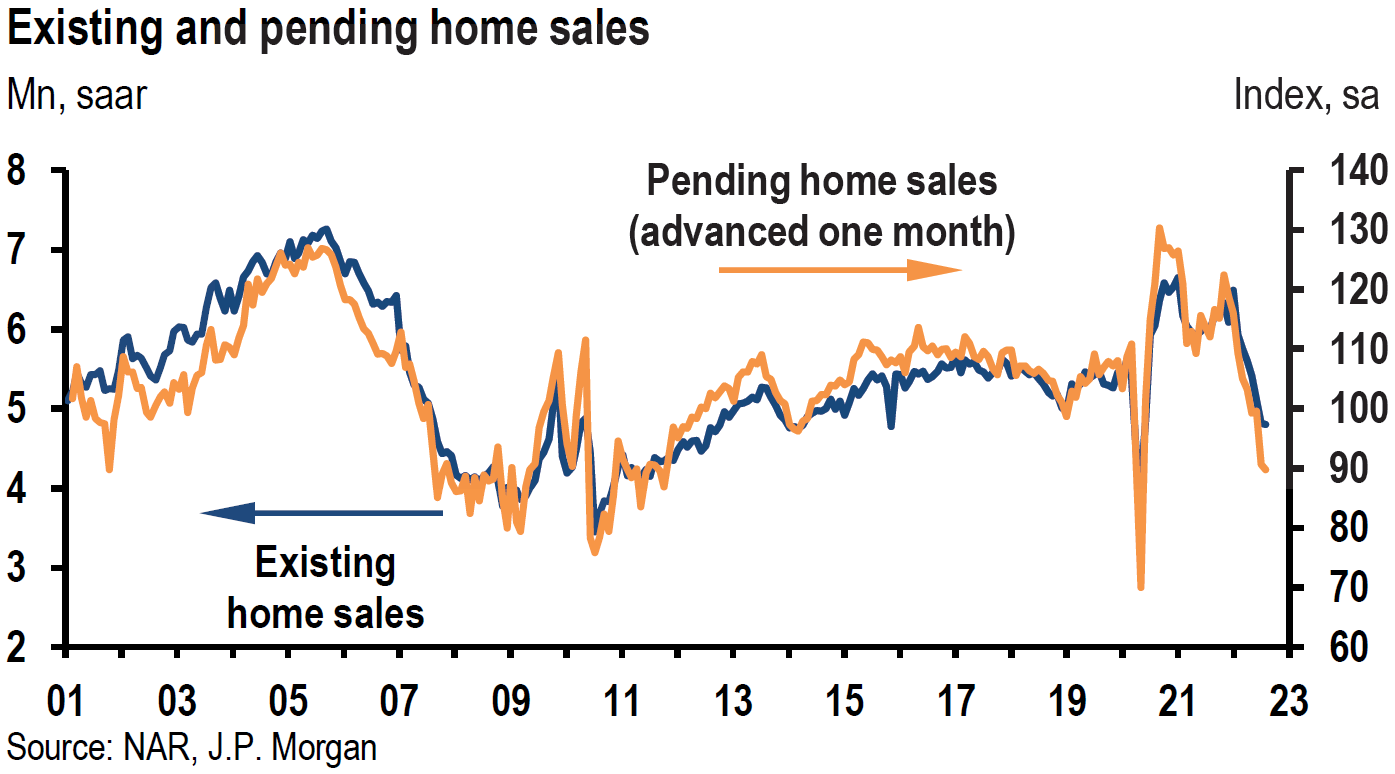
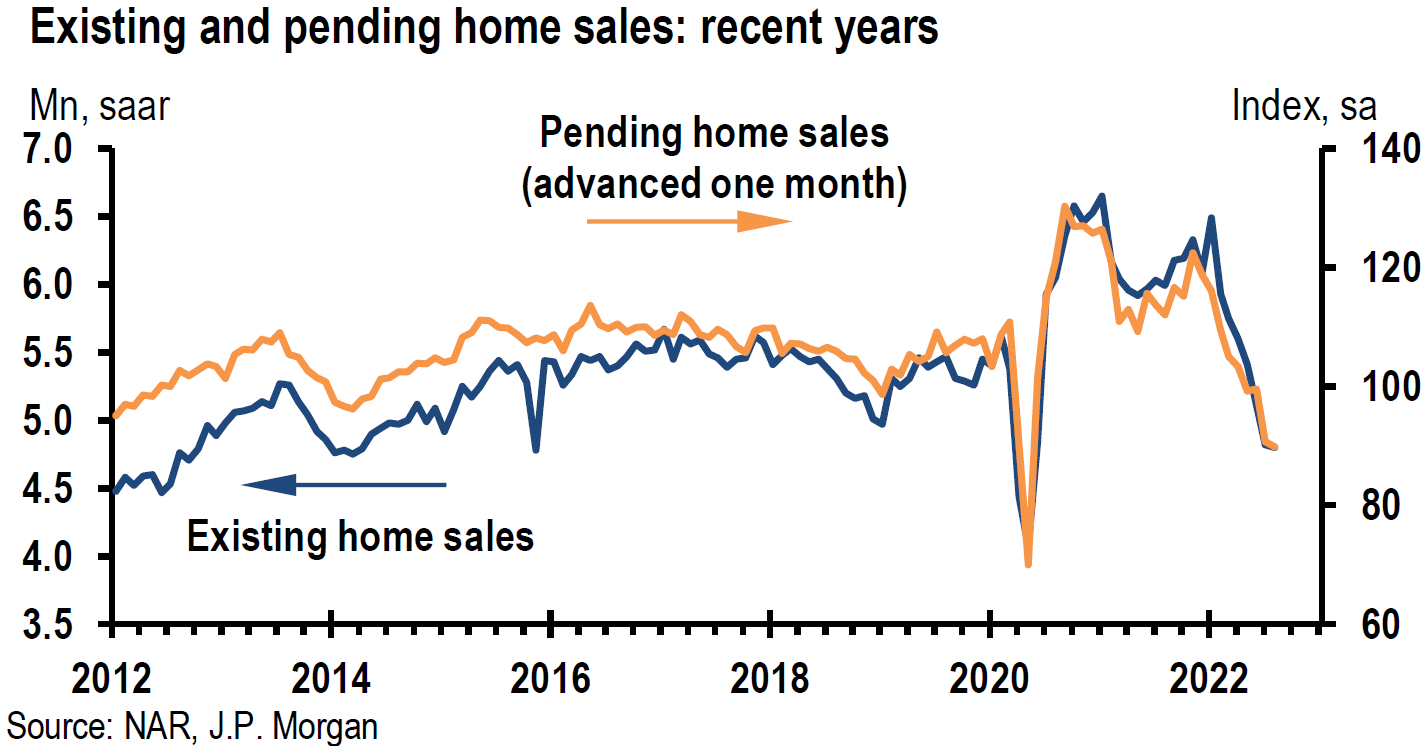
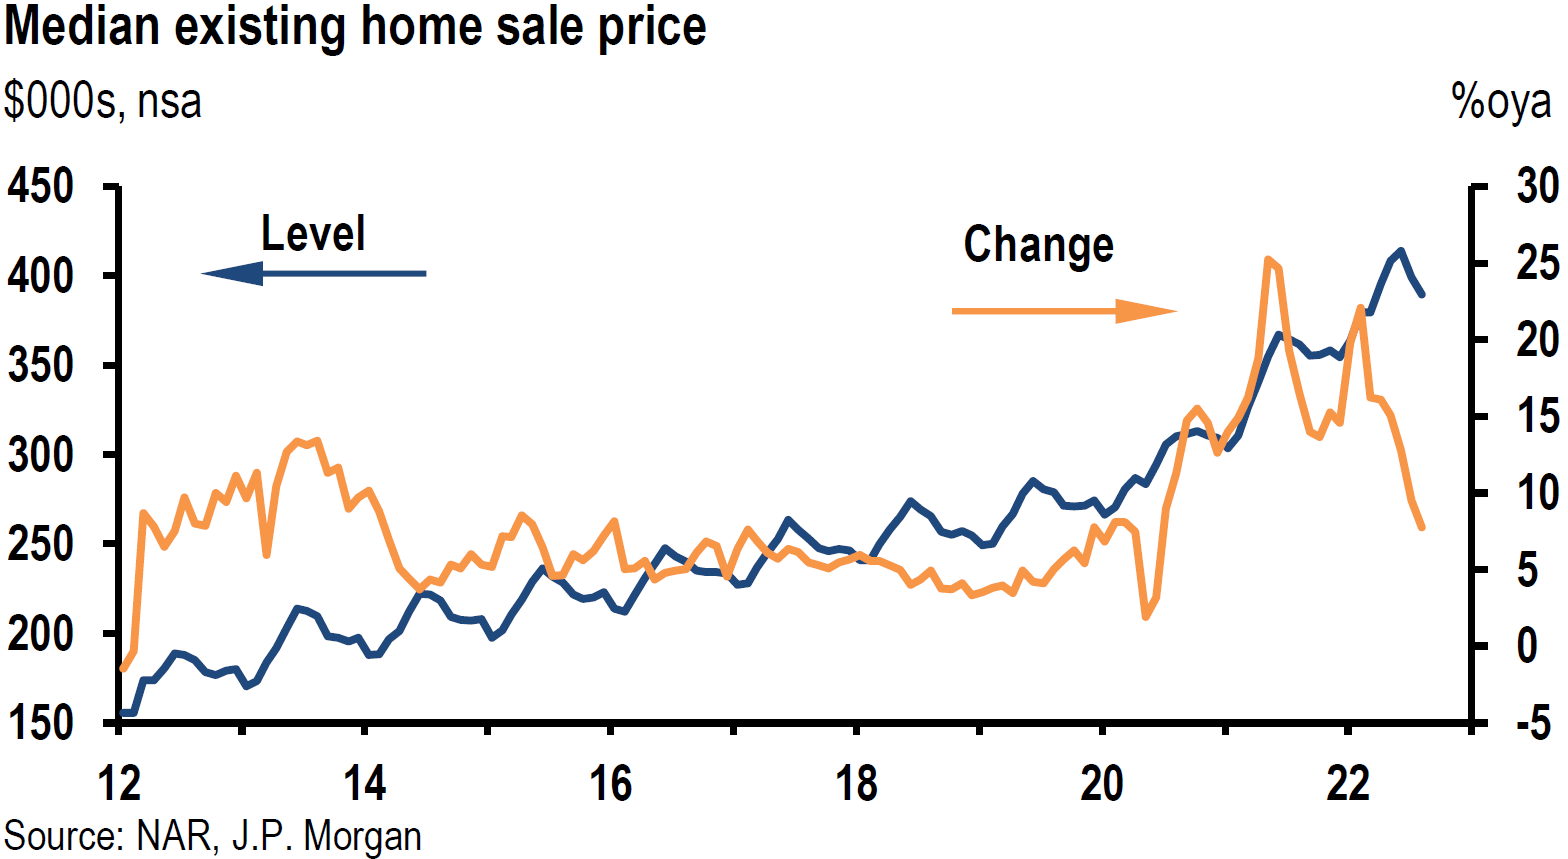
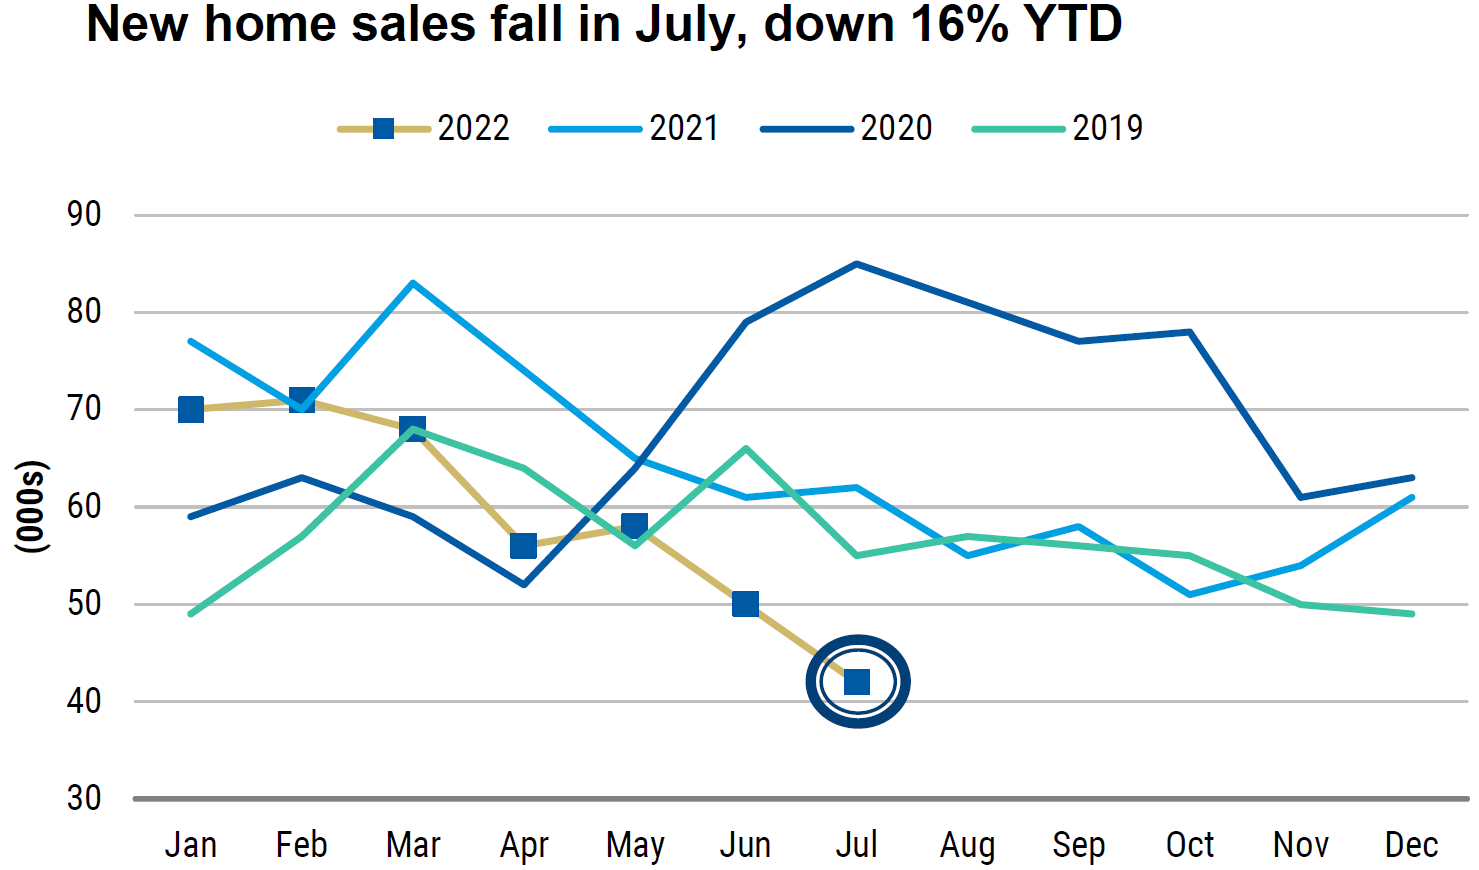
The National Association of Realtors released a report on September 21 that showed existing home sales 0.4% lower m/m in August and 19.9% lower y/y. This was the seventh consecutive month of declining sales and the second consecutive month of sequential price declines. The annualized rate of 4.8 million units based on the monthly August sales represented the slowest pace of sales since June 2020. The next slowest pace was recorded in 2015. Sales represent closing of contracts that were signed probably in June or July. During that time mortgage rates spiked higher before pulling back only to spike higher again recently. The median price of an existing home sold in August was $389,500, an increase of 7.7% y/y. CNBC reported on September 21, that existing home prices decline typically about 2% between June and August, but this year saw a greater decline of about 6%.
Source: JP Morgan, US: Existing home sales edge down (9-21-2022)
Source: Morgan Stanley, US Housing Tracker: Price Deceleration Has Begun (9-16-2022)
Source: US Census Bureau, Monthly New Residential Construction, August 2022 (9-20-2022)
Source: JP Morgan, US: NAHB survey continues to drop lower (9-19-2022)
Conference Board’s Leading Economic Index
The Conference Board’s Leading Economic Index (LEI) fell 0.3% in August to 116.2, following a loss of 0.5% in July and was 2.7% lower over the past six months. This was a reversal of a 1.7% gain over the prior six months. The senior director of economics at the Conference Board stated that the last six straight months of declines were “potentially signaling a recession.” He further stated that “labor market strength is expected to continue moderating in the months ahead. Indeed, the average work week in manufacturing contracted in four of the last six months – a notable sign, as firms reduce hours before reducing their workforce. Economic activity will continue slowing more broadly throughout the U.S. and is likely to contract.” The Conference Board then projected a U.S. recession in the coming quarters. This represents at least one reputable source that sees a less-tight labor market in the not-too-distant future.
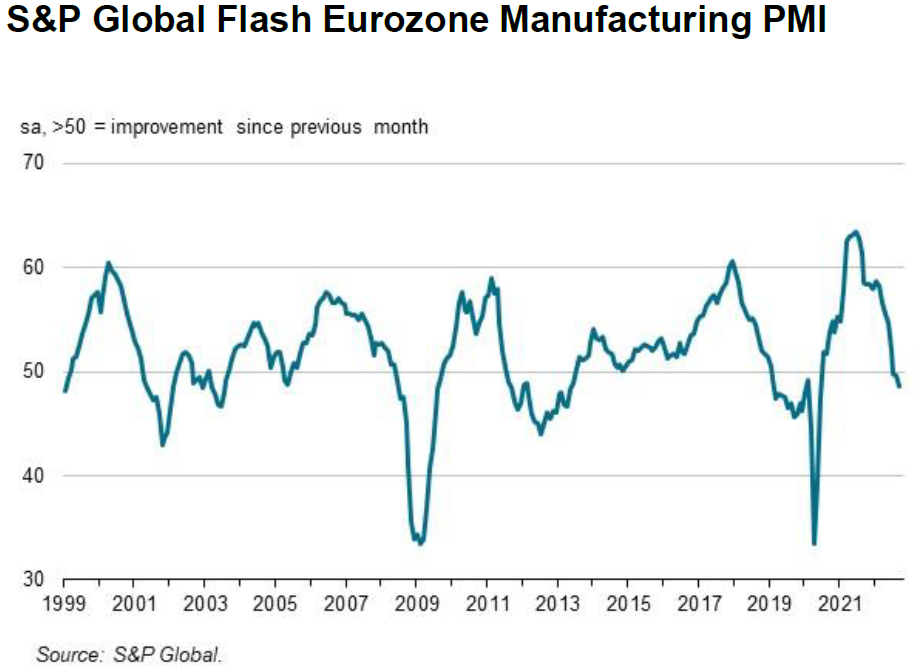
September S&P Global Flash PMIs
The S&P Global Flash Purchasing Managers’ Index (PMIs) for September were released on Friday. All services and manufacturing PMIs for the Eurozone and the UK contracted – below 50 levels. The Eurozone report stated: “Worsening performances were seen in both manufacturing and services, with demand falling at steepening rates in each sector as a result of the rising cost of living and growing gloom about future prospects.” The UK report highlighted that export orders “fell at a sharp and accelerated rate, with goods producers noting the steepest drop in foreign demand for 28 months and services companies signaling the first reduction since December 2021.” By comparison, the U.S. PMIs showed much more favorable trends generally. Although the U.S. manufacturing PMI remained in positive territory (above 50), all of the other measures improved even as they remined in contractionary territory. The most notable increase in the U.S. data was the increase in U.S. services activity index that rose from 43.7 in August to 49.2. Much like the Eurozone, new U.S. export orders “remained in contraction, with the rate of decrease the second-fastest since May 2020.” Although input prices for U.S. firms remained elevated, the rate of input cost increases slowed for the fourth consecutive month and rose at the slowest rate since the beginning of 2021. Prices received for U.S. firms rose at a slower pace as well. But the “moderation was led by service providers as manufacturers registered a sharper uptick in output charges in an effort to pass on higher costs to clients.” The rate of job creation at manufacturers was the “sharpest for six months amid greater success in hiring suitable candidates for vacancies.” We detect a glimmer of hope for a less tight labor market. This mirrors the more favorable hiring experiences of national U.S. restaurant chains noted above.
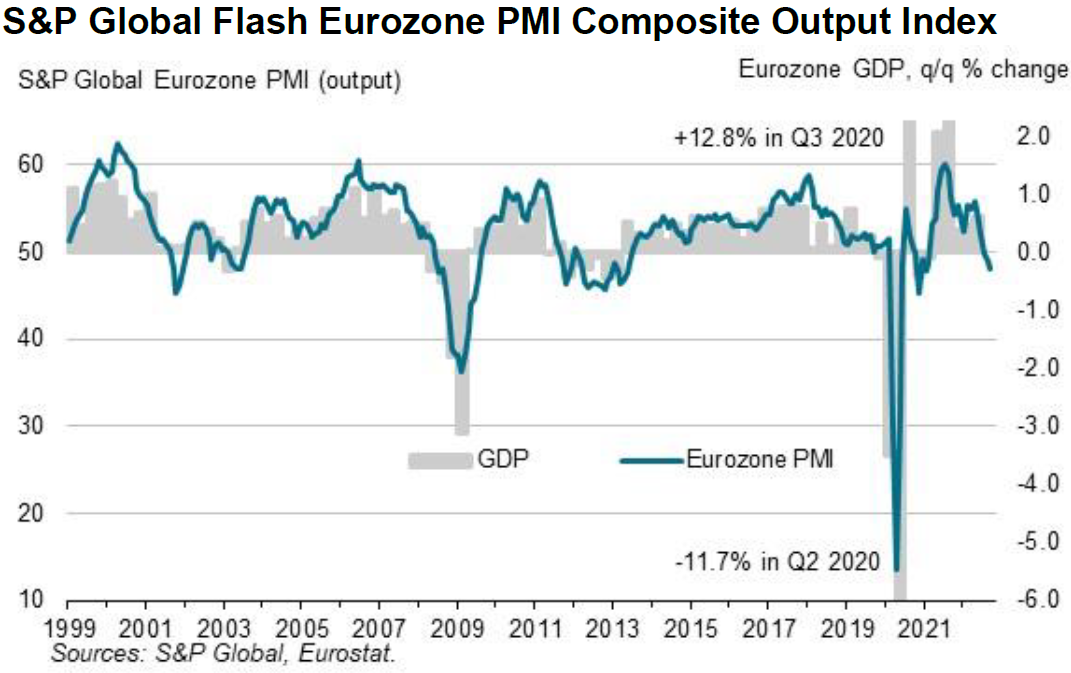
Source: S&P Global, Eurozone downturn deepens in September as price pressures intensify (9-23-2022)
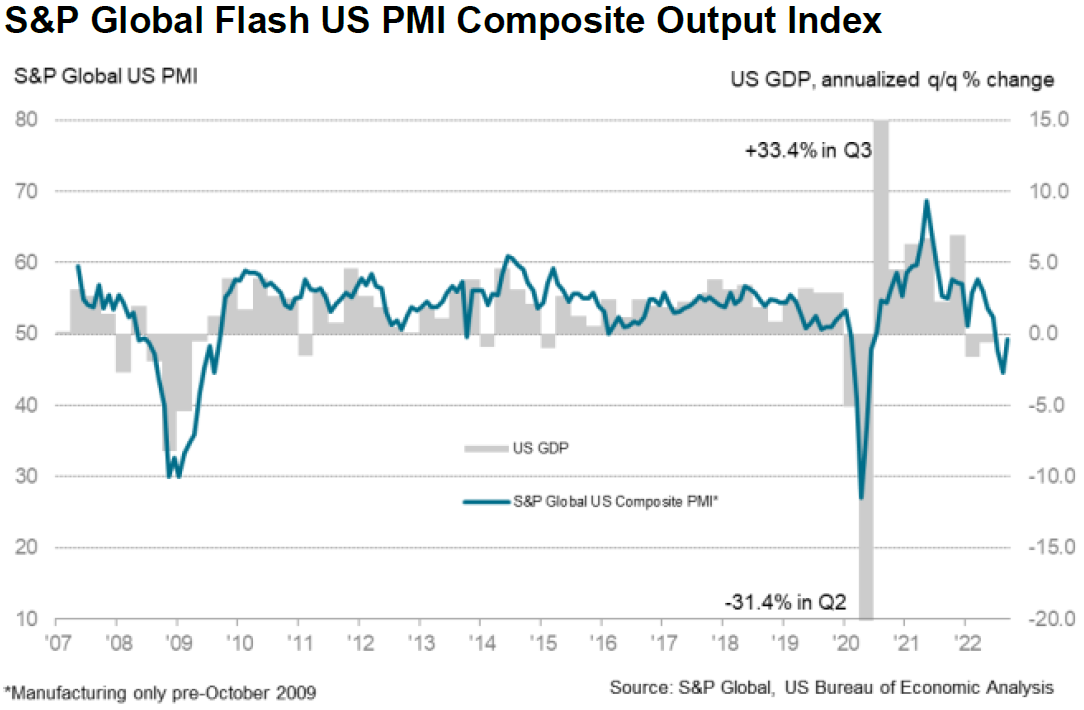
Source: S&P Global, US private sector output falls at softer pace as new orders return to growth in September (9-23-2022)
UK Tax Cuts and Other Support Measures
On Friday, the UK announced extensive tax cuts. The UK government estimated that the tax cuts will total 45 billion British pounds by 2026-27. This was on top of the already announced massive programs to cap energy costs for households and businesses. The UK government was now expected to borrow in excess of an additional 200 billion pounds in the next two years. The UK budget deficit was already growing more than expected recently. The financial markets reacted very abruptly as the British pound fell over 3% vs USD on Friday, UK interest rates spiked higher and UK equities further declined.
Bottom Line
For the time being we are maintaining our basic investment approach as expressed in last week’s commentary. We continue to favor high quality big cap stocks that offer good balance sheets, as well as relatively stable cash flows and profit margins. A well-diversified portfolio for long term investors will be most likely the preferred approach.
We continue to foresee that the continuing weakening trends in the U.S. economy should reduce demand sufficiently so that the rate of inflation would be lower and that the labor market becomes less tight. Unfortunately, we are now convinced that the Fed will not show enough patience for these trends to become more evident as it embarks on its pre-determined increased trajectory of federal funds rate hikes. We foresee an increased probability that the Fed will tighten more than is “required” to rein in inflation. The Fed’s projected higher federal funds rates should increase the risk of a U.S. recession and downside risks for equities.
Source: JP Morgan, Daily Economic Briefing (9-21-2022)


Definitions
Fed Dot Plot – The Fed dot plot is published quarterly as a chart showing where each of the 12 members of the FOMC expect the federal funds rate to be for each of the next three years and the long term.
Federal Funds Rate – The term federal funds rate refers to the target interest rate set by the Federal Open Market Committee. This target is the rate at which commercial banks borrow and lend their excess reserves to each other overnight.
Inverted Yield Curve – An inverted yield curve describes the unusual drop of yields on longer-term debt below yields on short-term debt of the same credit quality. Sometimes referred to as a negative yield curve, the inverted curve has proven in the past to be a relatively reliable lead indicator of a recession.
Frontloading Rate Hikes – Frontloading rate hikes is raising interest rates aggressively in a short period of time.
Fed’s Summary of Economic Projections (SEP) – The Federal Reserve releases a summary of Federal Open Market Committee participants’ projections for GDP growth, the unemployment rate, inflation, and the appropriate policy interest rate. The summary also provides information regarding policymakers’ views on the uncertainty and risks attending the outlook. This happens four times every year.
Financial Conditions Index (FCI) – The financial conditions index summarizes the information about the future state of the economy contained in current financial variables.
Headline PCE Inflation – A measure of the prices that people living in the United States, or those buying on their behalf, pay for goods and services. The PCE price index is known for capturing inflation (or deflation) across a wide range of consumer expenses and reflecting changes in consumer behavior.
Core PCE Inflation – A measure of the prices that people living in the United States, or those buying on their behalf, pay for goods and services that excludes food and energy prices. The core PCE gives a more accurate reading of inflation because food and energy are very volatile parts of the economy.
Basis Points (bps) – A basis point is one hundredth of one percent, used chiefly in expressing differences of interest rates.
Shelter Costs – Shelter costs are mortgage payments, property insurance (if required), homeowner association dues, rent, gas, electricity, heating fuel, water, sewer, garbage collection service, and real property taxes.
Rent – Rent is a tenant’s regular payment to a landlord for the use of property or land.
Owners’ Equivalent Rent (OER) – Owners’ equivalent rent is the amount of rent that would have to be paid in order to substitute a currently owned house as a rental property. This value is also referred to as rental equivalent.
Federal Open Market Committee (FOMC) – The Federal Open Market Committee (FOMC) is the branch of the Federal Reserve System that determines the direction of monetary policy specifically by directing open market operations. The committee is made up of 12 members: the seven members of the Board of Governors; the president of the Federal Reserve Bank of New York; and four of the remaining 11 Reserve Bank presidents on a rotating basis.
Flash Composite PMI – The flash Composite Purchasing Managers’ Index (PMI) provides an early estimate of current private sector business activity by combining information obtained from surveys of the manufacturing and service sectors of the economy.
Flash Services PMI – Flash services PMI is an early estimate of the Services Purchasing Managers’ Index (PMI) for a country, designed to provide an accurate advance indication of the final services PMI data.
Flash Manufacturing PMI – Flash Manufacturing PMI is an estimate of manufacturing for a country, based on about 85% to 90% of total Purchasing Managers’ Index (PMI) survey responses each month.
The Manheim Used Vehicle Value Index – This index measures the prices car dealerships pay for used cars at auctions. The prices are adjusted for seasonal factors but typically offer insight into what dealerships pay for the used cars they sell. Cox Automotive—the company behind Autotrader and Kelley Blue Book—publishes the index and updates the data monthly.
The NAHB/Wells Fargo Housing Market Index (HMI) – The NAHB/Wells Fargo Housing Market Index is a monthly sentiment survey of members of the National Association of Home Builders. The index measures sentiment among builders of U.S. single-family homes and is a widely watched gauge of the U.S. housing sector.
Housing starts – Housing starts are a measure of new residential construction and are considered a key economic indicator.
Housing Permits – Housing permits are a type of authorization that must be granted by a government or other regulatory body before the construction of a new or existing home can legally occur.
Existing home sales – Existing home sales transaction data measure and report sales and prices of existing single-family homes, condos, and co-ops for the United States, and is broken down by region: West, Midwest, South, and Northeast.
Quantitative Tightening (QT) – Quantitative tightening refers to monetary policies that contract, or reduce, the Federal Reserve System’s balance sheet.
Leading Economic Indicators Conference Board – The components of The Conference Board Leading Economic Index for the U.S. include:
- Average weekly hours in manufacturing – The average hours worked per week by production workers in manufacturing industries tend to lead the business cycle because employers usually adjust work hours before increasing or decreasing their workforce.
- Average weekly initial claims for unemployment insurance – The number of new claims filed for unemployment insurance are typically more sensitive than either total employment or unemployment to overall business conditions, and this series tends to lead the business cycle.
- Manufacturers’ new orders for consumer goods and materials – These goods are primarily used by consumers. The inflation-adjusted value of new orders leads actual production because new orders directly affect the level of both unfilled orders and inventories that firms monitor when making production decisions.
- ISM Index of New Orders – This index reflects the levels of new orders from customers. As a diffusion index, its value reflects the number of participants reporting increased orders during the previous month compared to the number reporting decreased orders, and this series tends to lead the business cycle.
- Manufacturers’ new orders for nondefense capital goods excluding aircraft orders – This index, combing with orders from aircraft (in inflation-adjusted dollars) are the producers’ counterpart to consumer goods and materials.
- Building permits for new private housing units – The number of residential building permits issued is an indicator of construction activity, which typically leads most other types of economic production.
- S&P 500 Index of Stock Prices – The Standard & Poor’s 500 stock index reflects the price movements of a broad selection of common stocks traded on the New York Stock Exchange.
- Leading Credit Index – This index is consisted of six financial indicators: 2-years Swap Spread (real time), LIBOR 3 month less 3 month Treasury-Bill yield spread (real time), Debit balances at margin account at broker dealer (monthly), AAII Investors Sentiment Bullish (%) less Bearish (%) (weekly), and Senior Loan Officers C&I loan survey
- Interest rate spread (10-year Treasury bonds less federal funds rate) – The spread or difference between long and short rates is often called the yield curve.
- Average consumer expectations for business condition – This index reflects changes in consumer attitudes concerning future economic conditions.
IMPORTANT DISCLOSURES
The views and opinions included in these materials belong to their author and do not necessarily reflect the views and opinions of NewEdge Capital Group, LLC.
This information is general in nature and has been prepared solely for informational and educational purposes and does not constitute an offer or a recommendation to buy or sell any particular security or to adopt any specific investment strategy.
NewEdge and its affiliates do not render advice on legal, tax and/or tax accounting matters. You should consult your personal tax and/or legal advisor to learn about any potential tax or other implications that may result from acting on a particular recommendation.
The trademarks and service marks contained herein are the property of their respective owners. Unless otherwise specifically indicated, all information with respect to any third party not affiliated with NewEdge has been provided by, and is the sole responsibility of, such third party and has not been independently verified by NewEdge, its affiliates or any other independent third party. No representation is given with respect to its accuracy or completeness, and such information and opinions may change without notice.
Investing involves risk, including possible loss of principal. Past performance is no guarantee of future results.
Any forward-looking statements or forecasts are based on assumptions and actual results are expected to vary from any such statements or forecasts. No assurance can be given that investment objectives or target returns will be achieved. Future returns may be higher or lower than the estimates presented herein.
An investment cannot be made directly in an index. Indices are unmanaged and have no fees or expenses. You can obtain information about many indices online at a variety of sources including: https://www.sec.gov/fast-answers/answersindiceshtm.html or http://www.nasdaq.com/reference/index-descriptions.aspx.
All data is subject to change without notice.
© 2024 NewEdge Capital Group, LLC


