

Weekly Summary: January 9 – 13
Key Observations:
- “Risk-on” sentiment appeared to be in full swing this week as U.S. stocks traded higher, USD traded lower along with lower interest rates. A critical component of this scenario was the continuation of the trend of lower U.S. inflation. We were also encouraged by the positive reversal of many major U.S. bank stocks from their initial stock declines after their earnings announcements on Friday. We were not concerned when banks disclosed that they were setting aside reserves to cover potential credit losses in the event of a possible recession. We viewed such actions as prudent. By day’s end, it appeared that financial markets agreed with us.
- We were very encouraged by the New York Fed’s survey of consumers’ diminished inflation expectations, along with their expectations of a 4.6% increase of household income over the next year. But we were even more encouraged by the very optimistic readings in the University of Michigan’s consumer sentiment survey. In our opinion, these surveys support our view that if the U.S. enters into a recession in 2023, that it should be a relatively mild one. However, we remain concerned about the increased borrowings of the U.S. consumer as the “excess savings” generated through the pandemic are expected to “run out” by midyear.
- Although we expect generally that 2023 global economic growth could be less than 2022, we remain sanguine in regard to economic growth in Europe, China and selected emerging markets (EM). As we have postulated many times, including in last week’s commentary, we anticipate a rather robust “reopening” of China at some point that could be beneficial for commodities in general and for base metals such as copper in particular. “To the extent that China is successful in stimulating its economic growth, we anticipate many beneficial spillover effects for many countries. We expect possible further USD weakening to the extent that the global economy grows relative to the U.S. economy.”
- The NFIB survey of small businesses for December continued to show diminished expectations of business conditions over the next six months. We found the most interesting aspect of this survey to be that the percentage of owners raising their selling prices dropped by eight points to the lowest percentage since May 2020. Only a net 24% of small business owners planned to hike their selling prices in the future. This represented a ten-point drop from November. We surmise that this could be an indication that inflationary trends might accelerate their downturn as companies find it more difficult to pass along rising input costs. To the extent wages prove to be more “sticky” relative to a slowing rate of inflation, profit margins could become “squeezed.”
The Upshot: Our general investment approach remains the same as depicted in last week’s commentary. We maintain our preference for big cap quality stocks with good balance sheets relatively stable cash flows and stable margins. We would also like to highlight the recent outperformance of the small cap Russell 2000 index. Over the past year we speculated that a contributing factor to the underperformance of small caps during the pandemic was that they were at a disadvantage relative to larger companies when supply chains were disrupted and when it was harder to find and retain a desired workforce. Many supply chain issues have been resolved mostly and it is our impression that finding and retaining a desired workforce has become somewhat less onerous. We speculate that this recent outperformance might be an indication of a somewhat less tight labor market.
Volatility across sectors continues to be supportive of a well-diversified global portfolio for long term investors. As the Fed’s “quantitative tightening” (QT — contraction of the Fed’s balance sheet) progresses, we expect liquidity to contract in financial markets. We were very encouraged by the positive reversal of many large cap bank stocks on Friday. We view such reversals as a positive indicator for bank stocks in particular as well as for equites in general.

Source: Goldman Sachs, Strategies for soft and hard landings: Hope for the best, but risk mitigation means also considering the worst (1-12-2023)
Fed Fights Back
Financial markets in the U.S. increasingly appear to be challenging the mantra “don’t fight the Fed.” It seems that Fed officials are very quick in their comments – “Fedspeak” – to express “hawkish” sentiments to try counterbalancing the easing of financial conditions. In last week’s commentary we highlighted the Fed’s frustration when an “unwarranted easing in financial conditions” occurred due to the public’s “misperception” of the Federal Open Market Committee’s (FOMC or Committee) actions. Some Fed officials did not wait for the much-anticipated release of December’s Consumer Price Index (CPI) on Thursday. The easing of U.S. financial conditions to start 2023, as reflected in higher U.S. equity prices and lower interest rates, prompted at least two Fed officials to voice what were perceived as hawkish comments on Monday. Atlanta Fed president Raphael Bostic stated that he saw the federal funds rate rising to between 5.0% and 5.25% and that such rates would have to remain on hold for a “long time,” which could be well into 2024. Bostic also indicated that the Fed was willing to “overshoot” – raise rates higher than might have been needed to achieve the Fed’s 2% targeted rate of inflation. San Francisco Fed president Mary Daly said that she saw the Fed raising the federal funds rate above 5% and then holding such rates at their peak for eleven months, which she viewed as a “reasonable starting point.”
New York Fed Survey of Consumers’ Inflation and Spending Expectations
Also on Monday, the New York Fed released the results from its December survey of consumers’ inflation and spending expectations. One-year-ahead inflation expectations declined 0.2% from November to 5.0%. According to data since 2013, this was the lowest level since July 2021, and was down substantially from its record high of 6.8% in June. Expectations for year-ahead household expenditures dropped 1% from November’s level to 5.9% in December, which was its lowest level since January 2022. Year-ahead expenditure expectations hit a high of 9% in May 2022. Consumers also expected gasoline prices to rise 4.1% over the next year, as well as for food prices to rise 7.6%. Both of these price expectations were 0.7% lower than those expressed in November. Consumers expressed optimism about the future, as reflected in their series-high expectation of a 4.6% increase in household income over the next year.
University of Michigan Preliminary January Consumer Sentiment
Like the New York Fed survey, consumers in this survey expressed optimism about the future. Both current conditions (68.6 vs. 59.4) and expectations (62 vs 59.9) improved to their highest levels since April. Current assessments of personal finances jumped 16% to their highest levels since April as well. According to the survey, this increase was on the basis of higher incomes and easing inflation. Consumer sentiment rose to 64.6 in January from 59.7 in December, highest since April and well above expectations of 60.5. “Although the short-run economic outlook fell modestly from December, the long-run outlook rose 7% to its highest level in nine months and is now 17% below its historical average.” Year ahead inflation expectations fell 0.4% from December’s reading to 4.0% in January, marking the fourth consecutive month of declining inflation expectations. The current reading is the lowest since April 2021. Long run inflation expectations maintained their December 3.0% level. We were very encouraged by the data from this survey and confirms our view that if the U.S. enters a recession in 2023, that it should be rather mild.
Credit Expansion of U.S. Consumers
Many analysts expect U.S. consumers’ “excess savings” to be dissipated by mid-year 2023. These were savings accumulated during the pandemic above what would be expected in a “normal” environment. At their peak, these savings were estimated to be as much as $2 trillion. We have highlighted in prior commentaries that many consumers expect that future credit would become more difficult to obtain. Given these factors, we were not surprised to see the continued expansion of consumer credit recently. According to Fed data, consumers increased their borrowing by $28 billion in November. The November credit expansion was mostly driven by increases in revolving credit, which consists mostly of credit card debt. The 16.9% revolving debt annual rate of increase was the largest increase in three months and the fifth largest ever in the last 55 years. Although total credit expansion fell short of October’s $29.12 billion increase, it exceeded the $25 billion increase expected in November. The average credit card rate was recently 19.07%. Car loans, student loans and personal loans are also included in these aggregate figures. The average rate for a 60-month car loan was recently quoted at 6.55% and personal loans showed an 11.23% rate. It is difficult to imagine how U.S. consumers can keep spending at recent levels. We expect a slowdown around mid-year, although the U.S. consumer has exceeded expected levels of expenditures quite often. Could this become another “rapidity of change” moment in the course of this pandemic?
NFIB Small Business Optimism Index and Diminished Expectations of Selling Price Increases
The National Federation of Independent Business (NFIB) Small Business Optimism Index for December fell 2.1 points to 89.8, which was its twelfth consecutive month below its 49-year average of 98. Owners’ expecting better business conditions over the next six months declined eight points from November to a net negative 51%. Both sales and business conditions were projected to deteriorate further. The net percentage of owners raising their average selling prices dropped eight points to a net 43%. This was the lowest level since May 2021. Only a net 24% of small business owners plan future hikes in their selling prices – a ten-point net decrease from November. The difficulty of passing on increases in input costs was reflected in the drop in the frequency of positive profit trends to a net negative 30% – down eight points from November. This sounds like shrinking profit margins could become more pronounced.
World Bank Lowers Global Economic Growth Forecast
This week, the World Bank issued a global recession “warning” when it stated that the global economy was “perilously close to falling into recession.” The World Bank also reduced its 2023 global GDP forecast of 3% given in June to its current forecast of 1.7%. Except for the recessions of 2009 and 2020, this lowered economic growth forecast would be the lowest since 1991. The World Bank’s president stated that he expected the global economic slowdown to be broad based and that growth in people’s earnings “in almost every part of the world” were likely to be lower than during the ten years prior to the outbreak of COVID-19 infections in 2020.
European and Chinese Economies Expected to Improve
Although we also foresee a slowing global economy in 2023, we agree with Goldman Sachs’ recent upgrade of Europe’s expected 2023 GDP growth from its prior consensus estimate of negative -0.1% to a positive 0.6%. This economic growth upgrade was based largely on warmer European weather that enabled Europe to maintain higher levels of natural gas storage. On January 11, Goldman suggested that the lower need for natural gas acted as a “lifting of the gas supply constraint on economic activity [that acted] like a positive supply shock. A positive economic “shock” was also anticipated for Europe’s economy from China’s earlier-than-anticipated “reopening.” On December 16, Goldman raised its China 2023 GDP forecast from 4.5% to 5.2%, based mostly on China’s accelerated reopening. A more robust Chinese economy should provide an assist to global economic growth. We observed sovereign bond yields of some of Europe’s “periphery” countries trading noticeably lower midweek relative to their more creditworthy neighbors. We interpret this as a renewed confidence in European economic growth that should reduce credit risk for the less creditworthy countries.
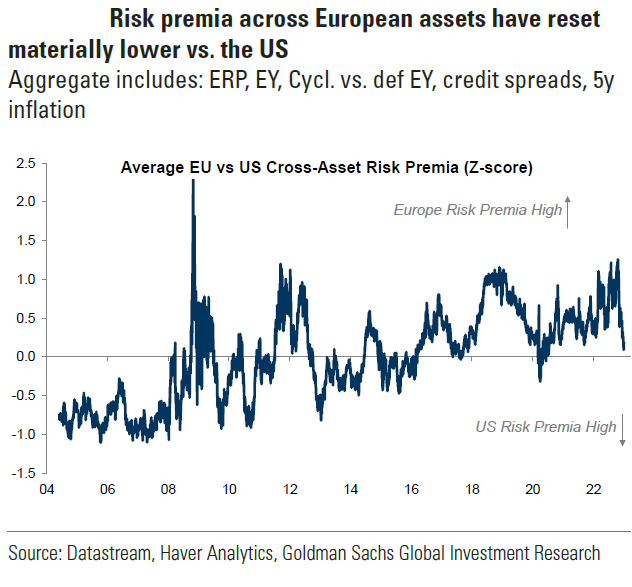
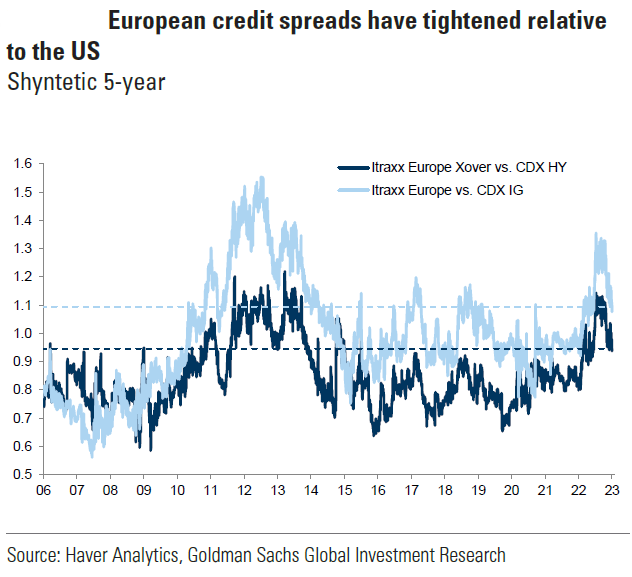
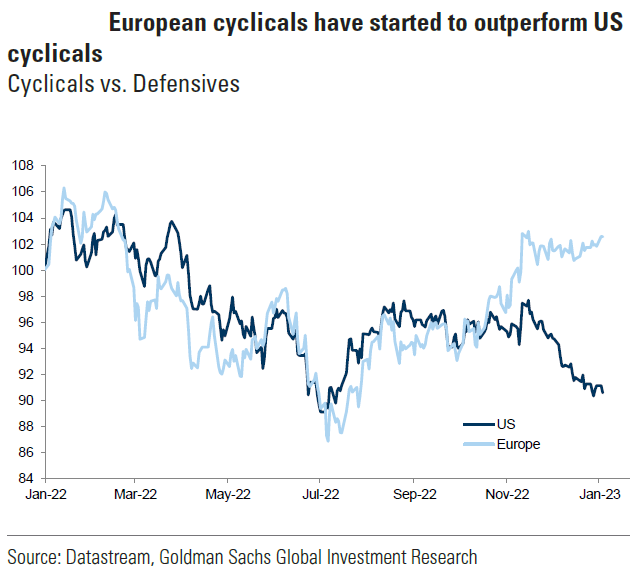
Source: Goldman Sachs, Lower gas prices and China re-opening support European assets (1-9-2023)
Weaker U.S. Housing Market
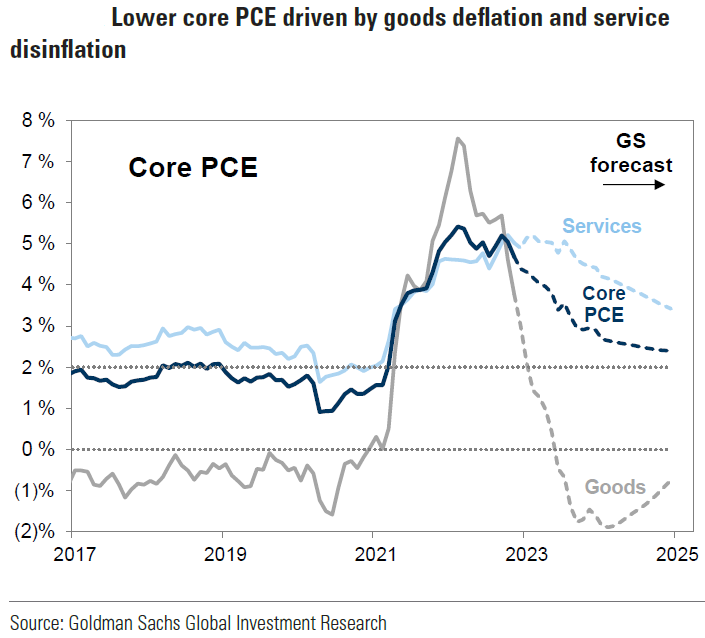
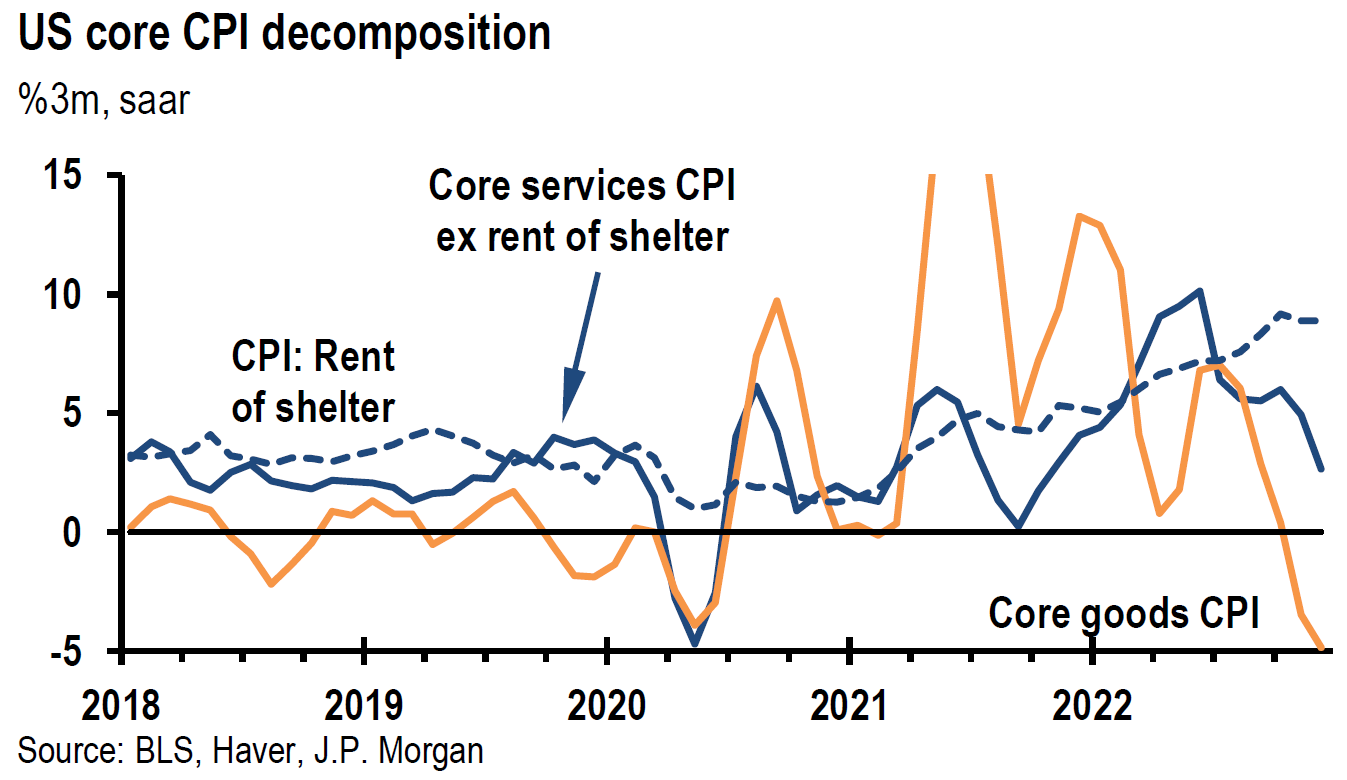
According to Freddie Mac on January 12, the average rate on the 30-year fixed rate mortgage fell from 6.48% the previous week to 6.33%. Data from the Mortgage Bankers Association were slightly different. Mortgage applications to purchase a home was 0.5% lower month-over-month (m/m) in the first week of January and mortgage rates declined during that first week from 6.58% the prior week to 6.42%. The new mortgage rate was the highest level since mid-November. According to a recent Redfin report, a record 42% of homes sold in Q4 2022 included concessions from sellers, compared to 30% in the prior quarter. According to Realtor.com, 13.6% of homes on the market had price cuts in December 2022 versus 7.1% in December 2021. Nevertheless, the median list price is 8.4% higher than a year ago. According to Apartment List, U.S. average national rents fell 0.8% m/m even as the rental component of CPI increased 0.8% in December. On January 12, an economist at Berenberg Capital Markets observed that the lag between the Case-Shiller home price index and the owners equivalent rent (OER) component of CPI can be 12-16 months. The Fed has highlighted this lag and so we feel rather comfortable extrapolating a lower core rate of inflation that is largely affected by elevated shelter inflation.
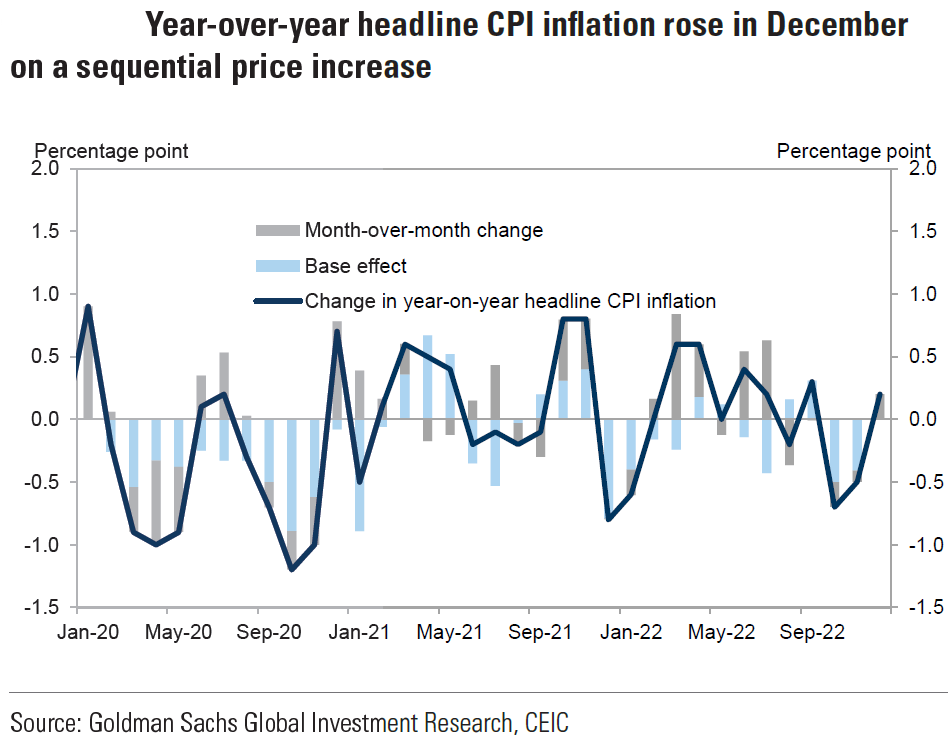
December U.S. CPI
All measures of CPI were mostly as expected for December. Headline CPI was 6.42% higher year-over-year (y/y), which was the lowest inflation rate since October 2021. The y/y peak hit 9.1% in June 2022. This compared to November’s 7.1% y/y rate. December CPI was lower 0.08% m/m versus an increase of 0.1% m/m in November. This was the first monthly decline since May 2020. Core CPI – which excludes food and energy – rose 0.3% m/m. December core CPI inflation increase of 5.69% y/y was higher versus the 6.0% y/y uptick in November. Rents were 0.79% higher m/m compared to a 0.77% increase in November. OER rose 0.78% versus 0.68% m/m in November. Lodging away from home was 1.5% higher m/m. Shelter costs comprise about a third of the overall CPI index and represent the biggest component of services inflation. These increases in rents were in contrast to weakness in the new rental market as depicted above. Services inflation excluding housing rose 0.4% m/m and 7.4% y/y. Used car prices fell 2.5% m/m – sixth consecutive m/m decline – and declined 8.8% lower y/y. Additionally, airline fares were 3.1% lower. New vehicle prices declined 0.1% m/m. Together, these two measures contributed a negative 0.15 % to the monthly core reading. Gasoline prices fell 1.5% m/m following an increase of 10.1% m/m in November. The 0.2% m/m increase in food at home was the smallest m/m increase since March 2021. Overall, food prices rose 0.3% m/m. Food away from home was 0.4% higher. Prices for eggs rose 11.1% m/m. Without eggs, the food at home component would have been virtually flat m/m.
Source: JP Morgan, Daily Economic Briefing (1-12-2023)
Fedspeak
Soon after the release of December’s CPI data, Philadelphia Fed president Patrick Harker said that rate hikes of 25 basis points (bps) “will be appropriate going forward.” On Thursday, the CME Group showed a 91% probability of a 25-bps hike in the federal funds rate at the conclusion of the Fed’s next meeting on February 1. We agree. Susan Collins, the president of Boston’s Fed made similar remarks on Wednesday. Richmond Fed president Tom Barkin said he was “in concept supportive of a path that is slower but longer and potentially higher” depending on how inflation behaves going forward. St. Louis president James Bullard expressed again his preference for getting the federal funds rate above 5% as “soon as possible” since he didn’t “see any purpose in dragging things out.” Bullard maintains that interest rates above 5% are needed to put downward pressure on inflation.
“What’s Going On?”
Judging by recent reactions of a lower U.S. Dollar (USD), lower Treasury yields and higher equity prices, it appears that financial markets have been inclined to “fight the Fed” even after the latest Fed minutes expressed the Fed’s frustration with “unwarranted easing of financial conditions.” We believe that the above depiction of Fedspeak is beginning to show a divergence of opinion as to the pace of rate hikes. Hawkish Fedspeak also seems to have less impact on financial markets that appear to react increasing to incoming economic data almost irrespective of Fed rhetoric. We find ourselves asking “What’s going on?” as expressed in the song “What’s Up?” sung by 4 Non Blondes. We will continue to strive to ascertain better what’s going on? We will try to avoid “feeling a little peculiar” in this process.
U.S. Unemployment Insurance Weekly Claims
Initial claims for “jobless” unemployment insurance for the week ended January 7 fell 1,000 from the previous week’s revised level of 206,000 (up 2,000) to 205,000 versus expectations of 215,000. For the week ended December 31, continuing unemployment claims fell by 63,000 from the previous week’s upwardly revised level (by 3,000) to 1.634 million. These latest figures reflected a still very tight U.S. labor market.
China
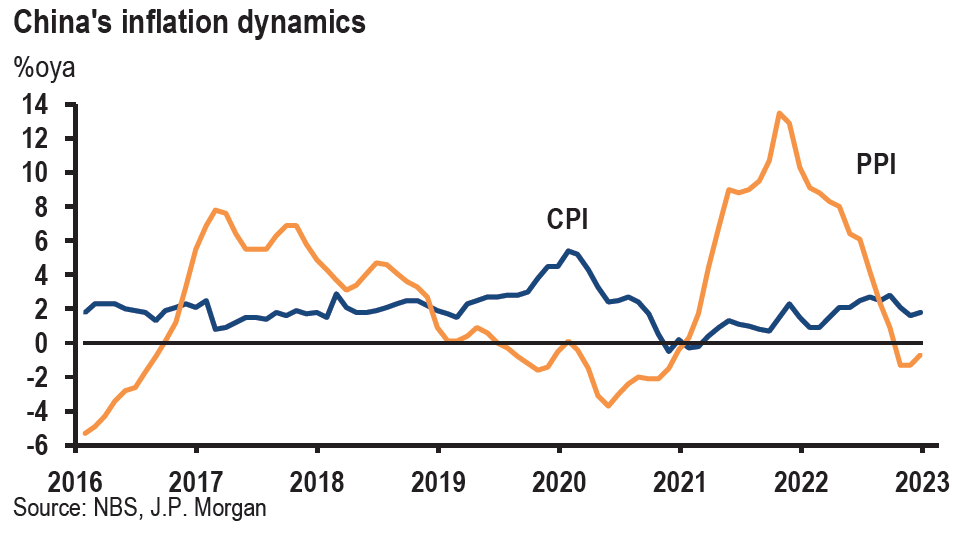
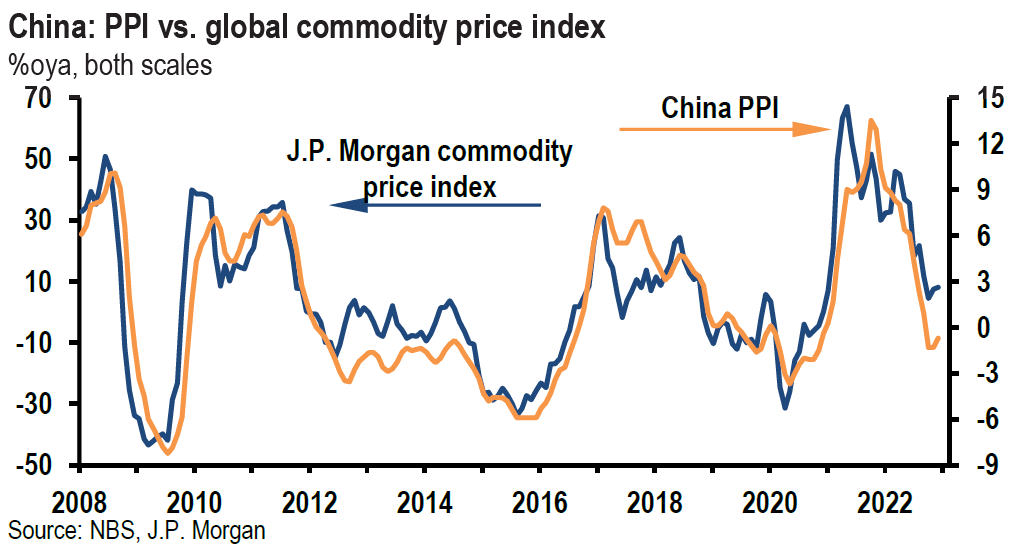
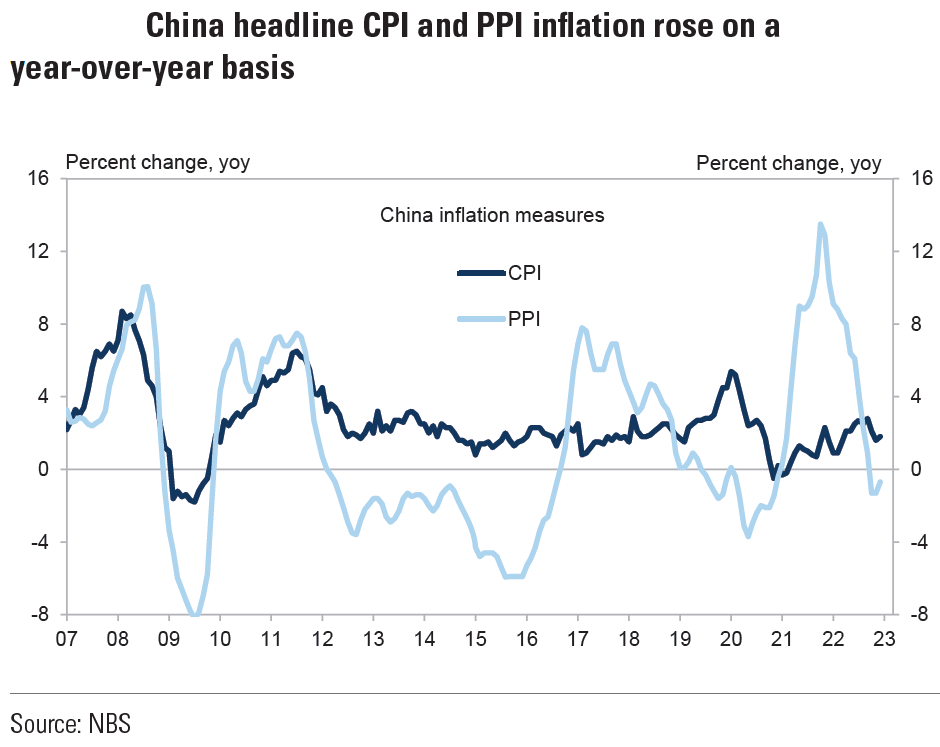
China’s December Producer Price Index (PPI) fell 0.7% y/y versus an expected decrease of 0.1% and November’s 1.3% decrease. December’s PPI was the third consecutive month of deflationary PPI. PPI decreased by 0.1% m/m in December. PPI of metal and coal related sectors increased while those in crude oil related sectors fell. The PPI of the oil and gas extraction industry dropped 8.3% m/m on declining international crude prices. PPI rose 4.1% for all of 2022. J.P. Morgan’s (JPM) latest forecast is for PPI to rise by 0.8% in 2023. China’s PPI is often taken as a precursor of U.S. CPI — to some extent. China’s December CPI rose 1.8% y/y as expected as it surpassed November’s increase of 1.6%. December’s CPI was flat on a m/m basis. In y/y terms, food inflation rose 4.8% compared to November’s 3.7% increase. CPI was 2% higher for all of 2022. On January 12, JPM expects CPI inflation to “stay below 2% for most of this year, due to base effect, before moving up and approaching 3% towards year-end and 1Q24.”
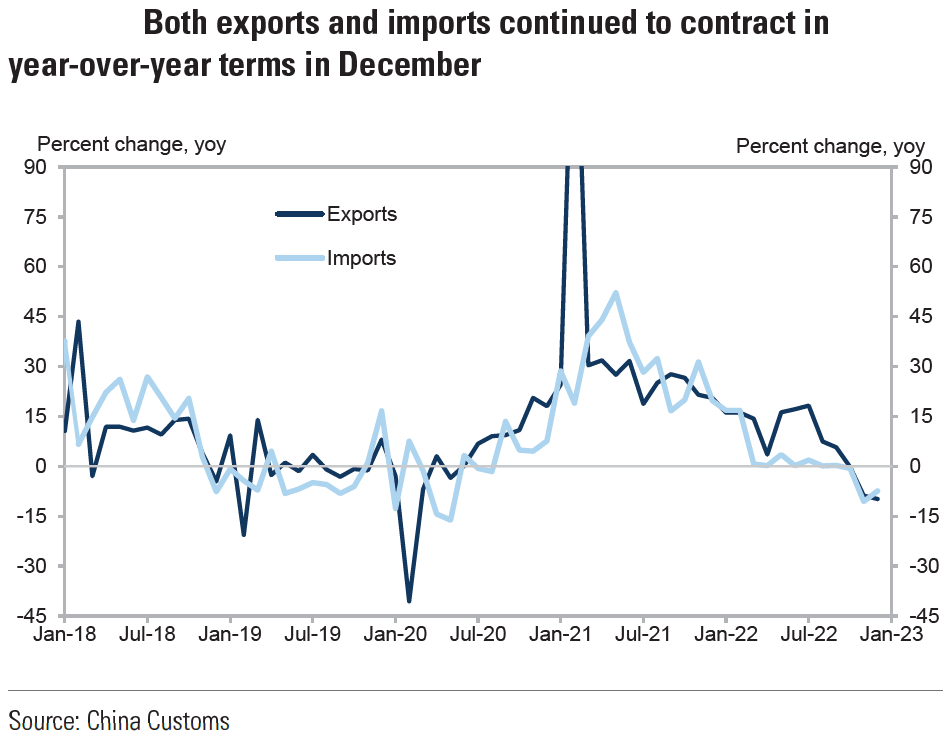
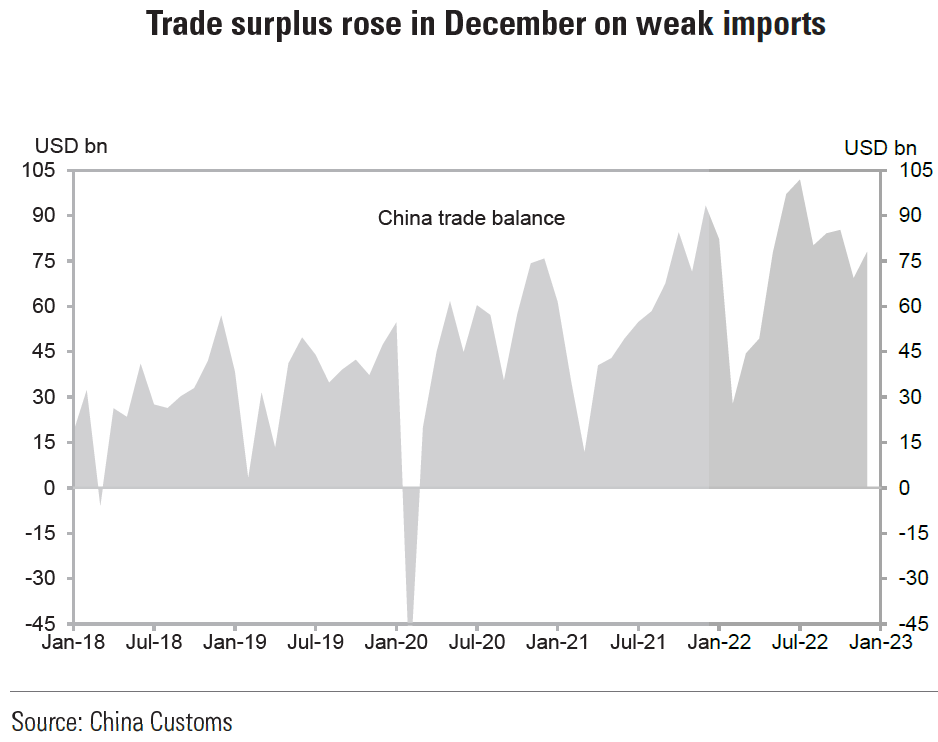
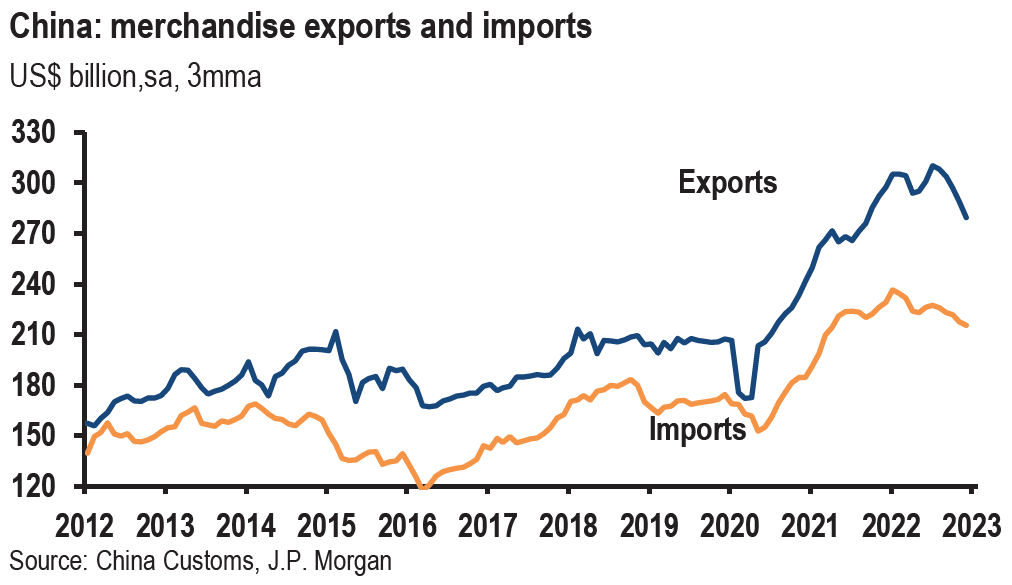
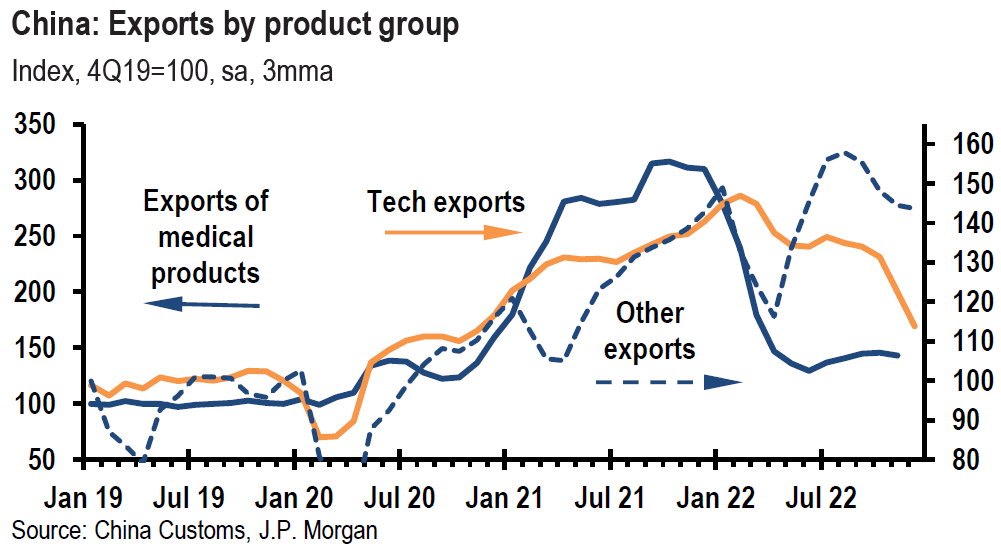
China’s exports fell 9.9% y/y in December, beating expectations of an 11.1% drop, but worse than November’s 8.7% decline (revised down to 8.9%). The y/y drop was the steepest since February 2020. For the full year, measured in USD terms, exports rose 7% to a record $3.6 trillion. Imports fell 7.5%, compared to November’s decline of 10.6% y/y but were 1.1% higher for 2022. Import value contracted partially due to lower commodity prices in December. China reported a record trade surplus of $877.6 billion for 2022, surpassing 2021’s record of $676 billion. The record trade surplus was mostly due to strong Q1 export growth due to a weak Chinese currency and rising prices of goods. Exports dropped 0.3% in October, which was the first decline since mid-2020. The drop in exports then accelerated in November and December. December’s export weakness was primarily driven by weak European demand as exports to Europe fell 17.5% y/y versus a 10.6% all in November. This is in contrast to a moderate increase sequentially of exports to the U.S. and Asian economies. Growth to some major emerging market (EM) economies also expanded. According to Capital Economics on Friday, the December drop in exports “can be pinned on weakening global demand for Chinese goods, as well as some disruption to logistics networks and goods supply due to labor shortages amid the reopening wave of infections.” We expect Chinese imports to rebound sharply at some point as virus infections begin to fade from China’s surprise abandonment of its zero COVID-19 policy. Capital Economics thought that “with growth outside China still slowing, exports may continue to contract until the middle of the year.” We would also like to highlight that China’s trade with Russia hit a record high in 2022, up more than 30% from 2021. On January 13, JPM stated that it expects “net exports’ contribution to China’s overall GDP growth to turn negative (-0.6%) in 2023,” as the export environment should remain “challenging.”
Source: Goldman Sachs, China: Exports contracted less than expected in December (1-13-2023)
Source: JP Morgan, China (1-13-2023)
Source: JP Morgan, China (1-12-2023)
Source: Goldman Sachs, China: CPI and PPI inflation rose in December (1-12-2023)
Bottom Line
For the time being we are maintaining our basic investment approach as expressed in last week’s commentary. We continue to prefer high quality big cap stocks that offer good balance sheets, as well as relatively stable cash flows and profit margins. We prefer a very diversified global portfolio for long term investors.
We anticipate a robust China reopening in the relatively near future. We believe that a strong Chinese economy could enhance global growth relative to U.S. economic growth. This could lead to further USD weakening at some point.
We were very encouraged by the positive reversal of many large cap bank stocks on Friday. We view such reversals as a positive indicator for bank stocks in particular as well as for equities in general.
Definitions
Small-Cap Stocks – A small-cap stock is a stock from a public company whose total market value, or market capitalization, is about $300 million to $2 billion.
Large-Cap Stocks – Large-cap (sometimes called “big cap”) refers to a company with a market capitalization value of more than $10 billion.
Russell 2000 – The term Russell 2000 Index refers to a stock market index that measures the performance of the 2,000 smaller companies. The Russell 2000 is managed by London’s FTSE Russell Group and is widely regarded as a bellwether of the U.S. economy because of its focus on smaller companies that focus on the U.S. market.
Producer Price Index (PPI) – The producer price index (PPI), published by the Bureau of Labor Statistics (BLS), is a group of indexes that calculates and represents the average movement in selling prices from domestic production over time. It is a measure of inflation based on input costs to producers.
Consumer Price Index (CPI) – The CPI calculates the cost to purchase a fixed basket of goods to determine how much inflation is occurring in the broad economy. The CPI uses a base year and indexes the current year’s prices, according to the base year’s values.
Emerging Markets – An emerging market economy is the economy of a developing nation that is becoming more engaged with global markets as it grows.
China Reopening – A “reopening” in China means an easing of their zero-covid policy which includes a relaxation of travel rules and domestic travel.
Fedspeak – Fedspeak is a technique for managing investors’ expectations by making deliberately unclear statements regarding monetary policy to prevent markets from anticipating, and thus partially negating, its effects.
U.S. Dollar Index (DXY) – The U.S. dollar index is a measure of the value of the U.S. dollar relative to a basket of foreign currencies.
Case-Shiller Housing Index – The Case-Shiller Index, formally known as the S&P CoreLogic Case-Shiller U.S. National Home Price NSA Index, is an economic indicator that measures the change in value of U.S. single-family homes on a monthly basis.
NFIB Small Business Optimism Index – The Small Business Optimism Index is a composite of ten seasonally adjusted components. It provides an indication of the health of small businesses in the U.S., which account of roughly 50% of the nation’s private workforce.
IMPORTANT DISCLOSURES
The views and opinions included in these materials belong to their author and do not necessarily reflect the views and opinions of NewEdge Capital Group, LLC.
This information is general in nature and has been prepared solely for informational and educational purposes and does not constitute an offer or a recommendation to buy or sell any particular security or to adopt any specific investment strategy.
NewEdge and its affiliates do not render advice on legal, tax and/or tax accounting matters. You should consult your personal tax and/or legal advisor to learn about any potential tax or other implications that may result from acting on a particular recommendation.
The trademarks and service marks contained herein are the property of their respective owners. Unless otherwise specifically indicated, all information with respect to any third party not affiliated with NewEdge has been provided by, and is the sole responsibility of, such third party and has not been independently verified by NewEdge, its affiliates or any other independent third party. No representation is given with respect to its accuracy or completeness, and such information and opinions may change without notice.
Investing involves risk, including possible loss of principal. Past performance is no guarantee of future results.
Any forward-looking statements or forecasts are based on assumptions and actual results are expected to vary from any such statements or forecasts. No assurance can be given that investment objectives or target returns will be achieved. Future returns may be higher or lower than the estimates presented herein.
An investment cannot be made directly in an index. Indices are unmanaged and have no fees or expenses. You can obtain information about many indices online at a variety of sources including: https://www.sec.gov/fast-answers/answersindiceshtm.html or http://www.nasdaq.com/reference/index-descriptions.aspx.
All data is subject to change without notice.
© 2024 NewEdge Capital Group, LLC


