The backdrop
“These things gotta happen every five years or so, ten years. Helps to get rid of the bad blood. Been ten years since the last one. You know, you gotta stop them at the beginning.” – The Godfather
As expected, the Federal Reserve raised the Federal Funds rate by 75 basis points on Wednesday, July 27th for the second consecutive meeting as the FOMC feverishly attempts to fight inflation. Policy makers, facing the hottest cost pressures in 40 years, lifted the target for the Federal Funds rate on to a range of 2.25% to 2.5% – the lower end of the range that the Fed believes to be neutral. That takes the cumulative June-July increase to 150 basis points (1.5%) – the largest two-month increase since the price-fighting era of Paul Volcker in the early 1980s. Today, the market (as measured by CME Federal Funds futures) is expecting the Fed to reach 3.39% by the end of 2022 only to cut rates by 53 basis points in 2023.
The drumbeat of recession has become audibly louder, although many investors and other market participants still expect the FOMC to try and beat down inflation to the 2% stated target rate, according to the latest CNBC Fed Survey (dated 7/26/22). Indeed, the survey revealed that 63% of respondents believe that the Federal Reserve’s campaign to bring down inflation to its 2% target would create a recession, versus 22% in the no recession camp.
U of Michigan Consumer Sentiment – Monthly – 3 Years
Source: Bloomberg as of 7/19/2022
The University of Michigan Consumer Sentiment Index ticked up to 51.1 in July, fractionally higher than last month’s all-time low of 50, driven by inflation and a record high proportion of Americans expecting their finances to worsen in the coming year. Indeed, nearly 49% of consumers attributed their negative views regarding personal finances to inflation (38% in May), matching the all-time high seen during the 2008 financial crisis, and a mere 18% expect their incomes to rise more than inflation, a rebound from last month’s 13% read, but still historically low.
Recession or inflation…do we really need to choose?
“What we’ve got here is a failure to communicate.” – Cool Hand Luke
While there is some dissension regarding the likelihood of a recession during the current FOMC tightening campaign, given the relative strength of consumer and business balance sheets, the predictive history of inverted U.S. Treasury yield curves is more clear – 2/10yr inversions occurred prior to seven of the last eight recessions and 3m/10yr inversions prior to all eight recessions, with no false signals. While we have not yet seen the 3m/10yr rate inversion, further Fed tightening may force the issue.
The knee-jerk reaction of a flattening yield curve after each inflation report surprising on the upside, implies markets are more worried about growth of the economy than of long-term inflation.
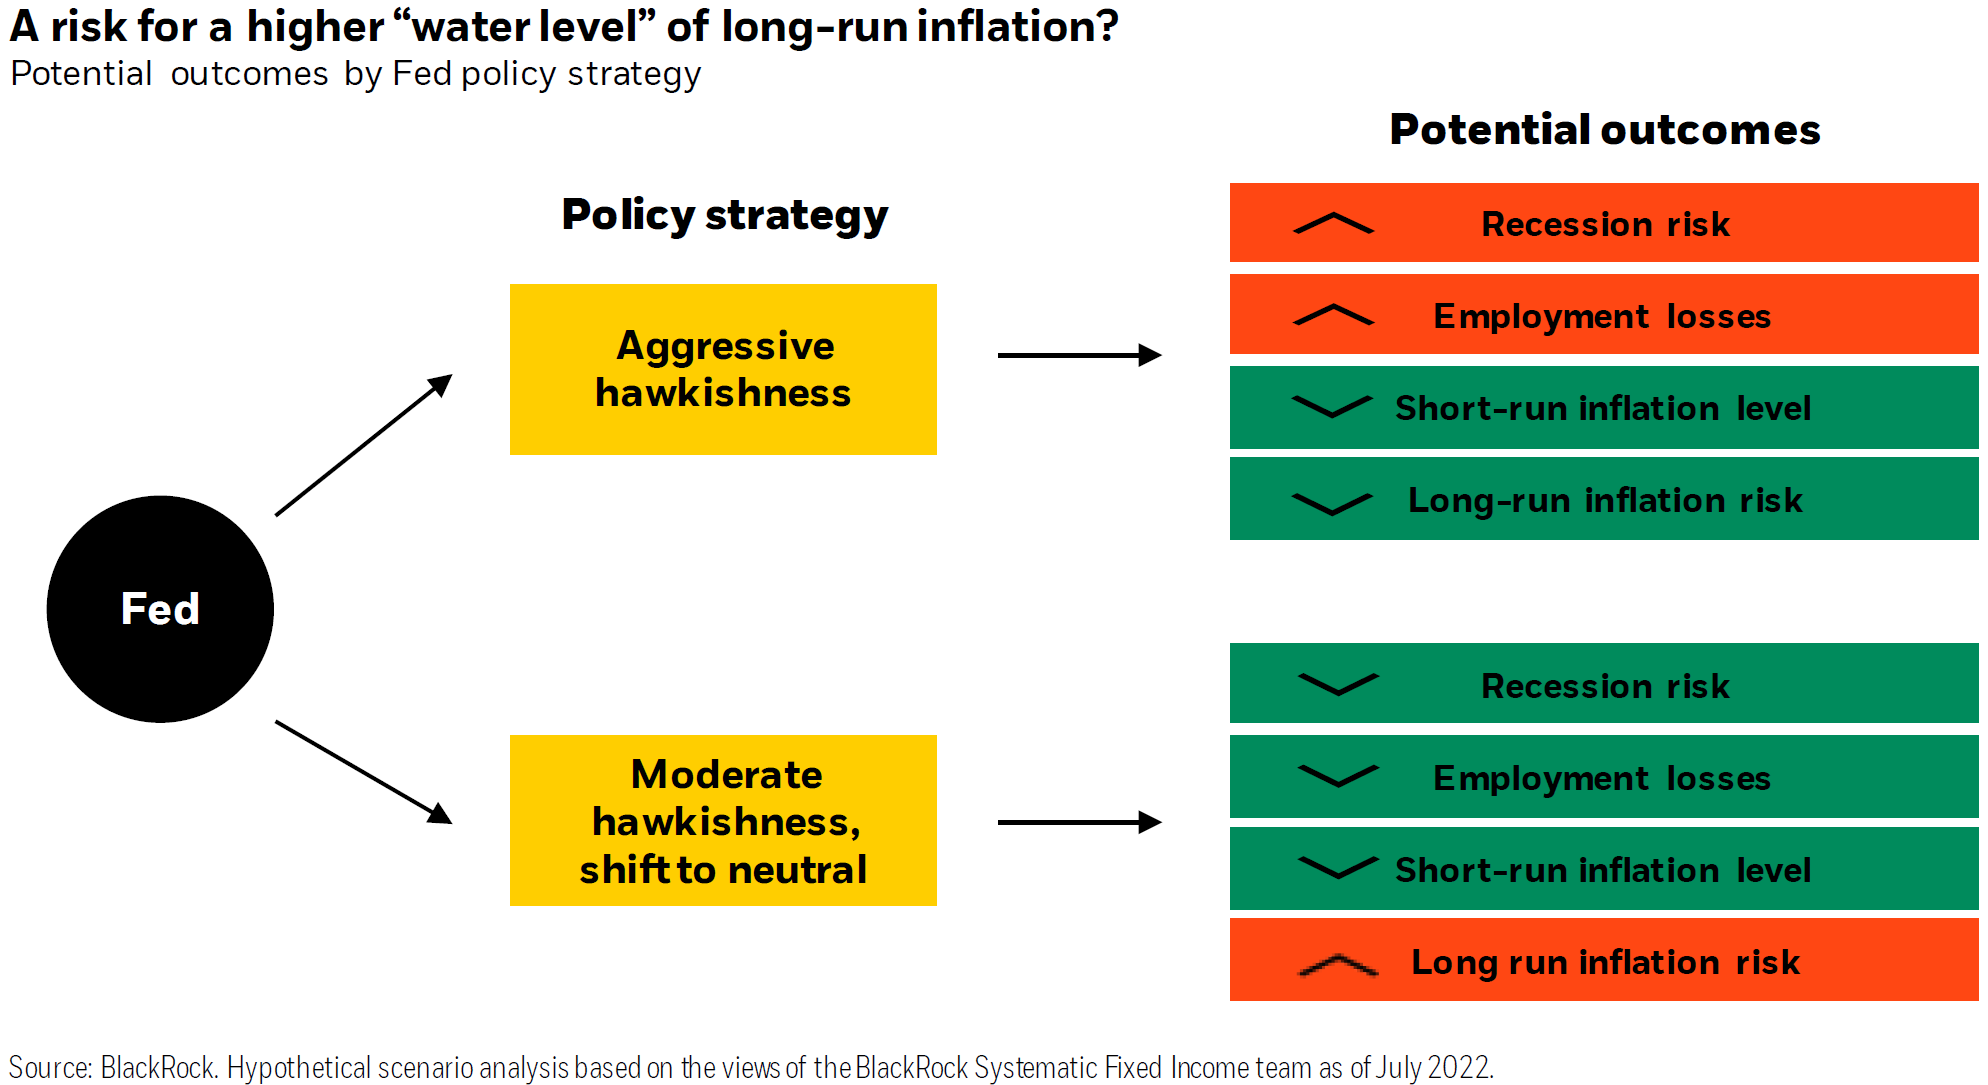
The current state of affairs
“Gentlemen prefer bonds.” – Andrew Mellon
The $4 trillion municipal-bond market is having its best month (July 2022) of performance since rebounding from a steep crash in Spring 2020. State and local debt is poised to return nearly 2.5% in July, which would be the market’s best showing since May 2020, according to Bloomberg index data.
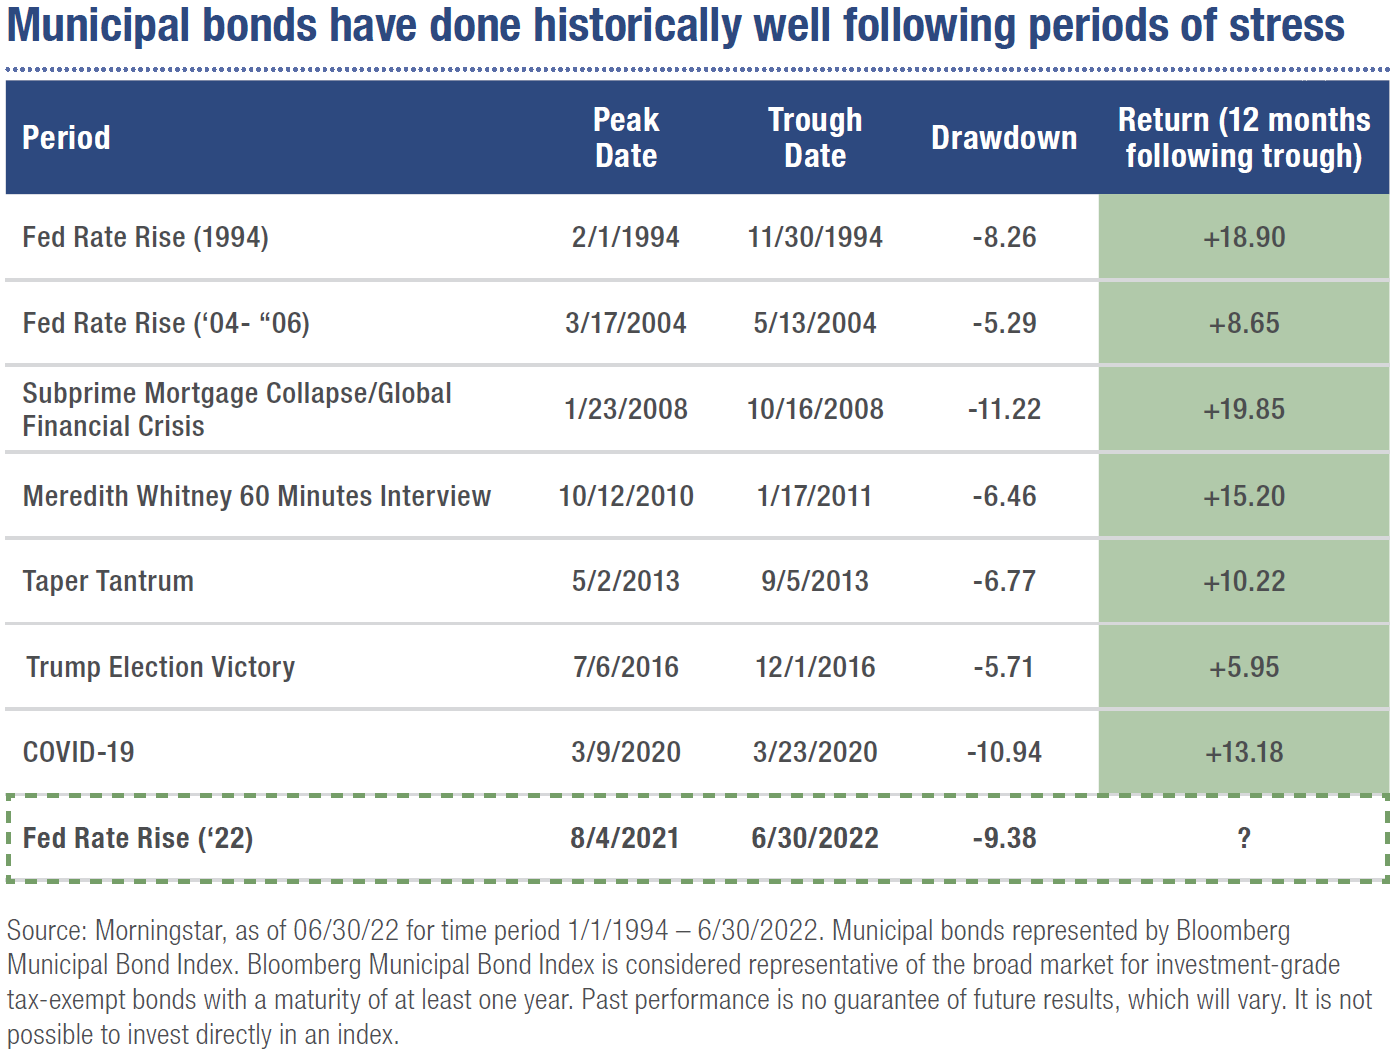
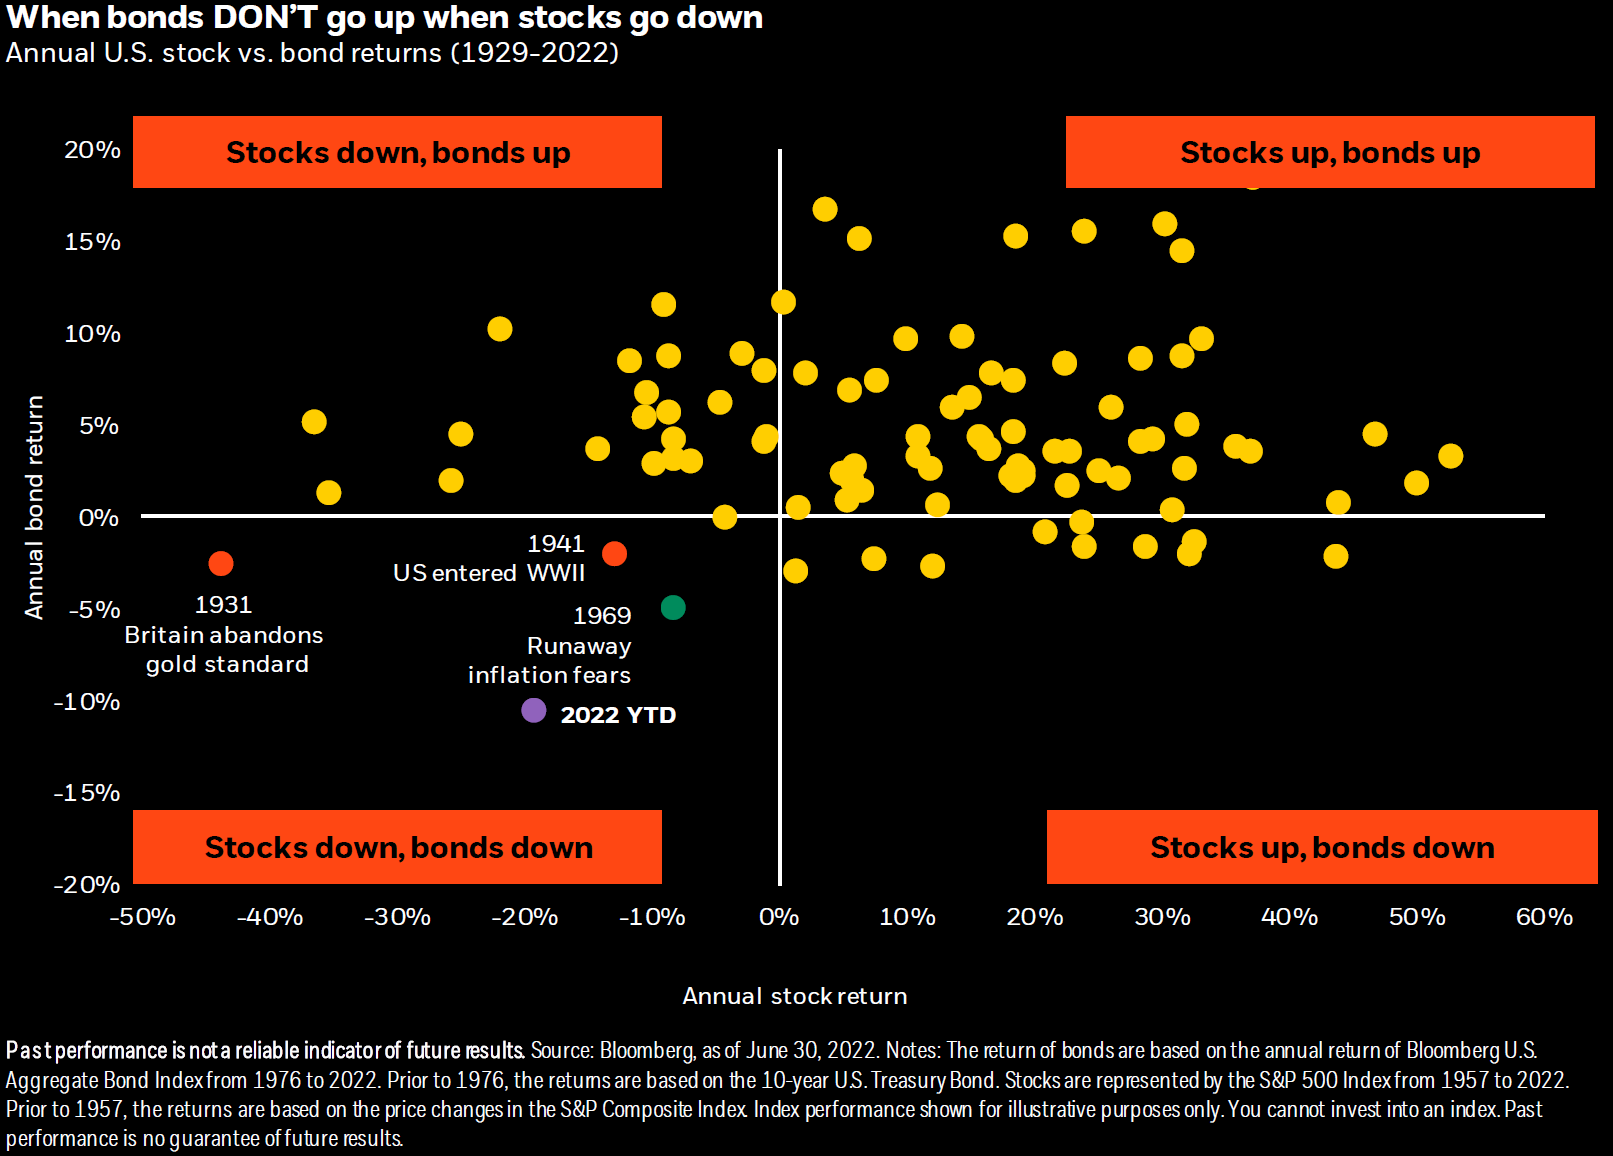
…but not so far in 2022. In fact, the 2022 performance remains an outlier for stocks and bonds as shown below.
Source: BlackRock, A Bigger Boat (7/20/22)
Based on history, simultaneous declines in both stocks and bonds are truly rare looking back to 1929. 2022 so far stands as the worst year on record for bonds which leads to the second worst year of combined stock and bond performance in nearly a century. Going back to 1929, there have only been three years where bonds did not go up when stocks went down.
Outside of 1931 when Britain abandoned the gold standard (leading to falling stocks but rising interest rates to defend the currency) and 1941 when the U.S. entered World War II (leading to rising inflation and falling stocks), 1969 had stood as the exception that proved the rule for reliable stock-bond diversification.
The reasons for losses in that period mirror today, with rapidly rising inflation unleashing a Fed tightening cycle that eventually resulted in recession. That period illustrated that bonds act as a robust diversifier to stocks, unless stocks are falling due to concerns over inflation.
The July bond market rally has been spurred in part by uncertainty around a U.S. recession, with some investors piling into municipal debt because it is considered safe. Recession alarm bells have been ringing louder after the U.S. economy shrank for the second straight quarter. Skeptics have also warned that still-high inflation could prevent the central bank from backing off from its aggressive policy-tightening regime, which could push the economy into a recession.
Mid-year Municipal Bond data points
“Life can only be understood backwards; but it must be lived forwards.” ― Søren Kierkegaard
- Through 1Q22, state total tax collections are 16% above 2021 collections, led by a 19.6% increase in personal income tax receipts and a 17% increase in sales tax receipts.
Source: National Association of State Budget Officers (NASBO), as of June 2022
- Forty-nine states reported that fiscal year 2022 general fund revenue collections are exceeding budget forecasts compared to just nine states in fiscal year 2020.
Source: NASBO, as of June 2022
- In fiscal year 2021, state rainy day fund balances reached a record high of $124.5 billion. Fiscal year 2022 rainy day fund balances are projected to close the year at a new high of $132.2 billion. Source: NASBO, as of June 2022
- Issuers exhibited positive rating momentum, with upgrades of 60 vs. downgrades of 18. 89.4% of the Fitch Public Finance sector has a stable outlook.
Source: Fitch, as of June 2022
- Massachusetts is postponing a $2.7 billion bond sale as they wait for bond yields to move back down. This postponement is another sign others are anticipating the markets are nearing their pricing lows, betting on yields to move down. We expect higher-rated states to follow this lead as we move through the year’s balance.
- Year to date through June 30th, the Bloomberg Municipal Bond Index returned -8.98% and outperformed the Bloomberg U.S. Aggregate Bond Index, which returned -10.35%, by +1.37%. Municipals also outperformed U.S. investment grade corporate bonds, which were down -14.39% over the same time period, as measured by the Bloomberg U.S. Corporate Bond Index.
Source: Bloomberg, as of 6/30/2022
- The yield spread between high yield and investment grade municipal bonds only slightly widened in the first half of 2022, starting at 202 bps and ending at 209 as of June 30, 2022. Contrast this spread with High Yield Corporate Bond spread levels, which rose significantly from 278 bps to 569 bps.
Source: Bloomberg, as of 6/30/2022
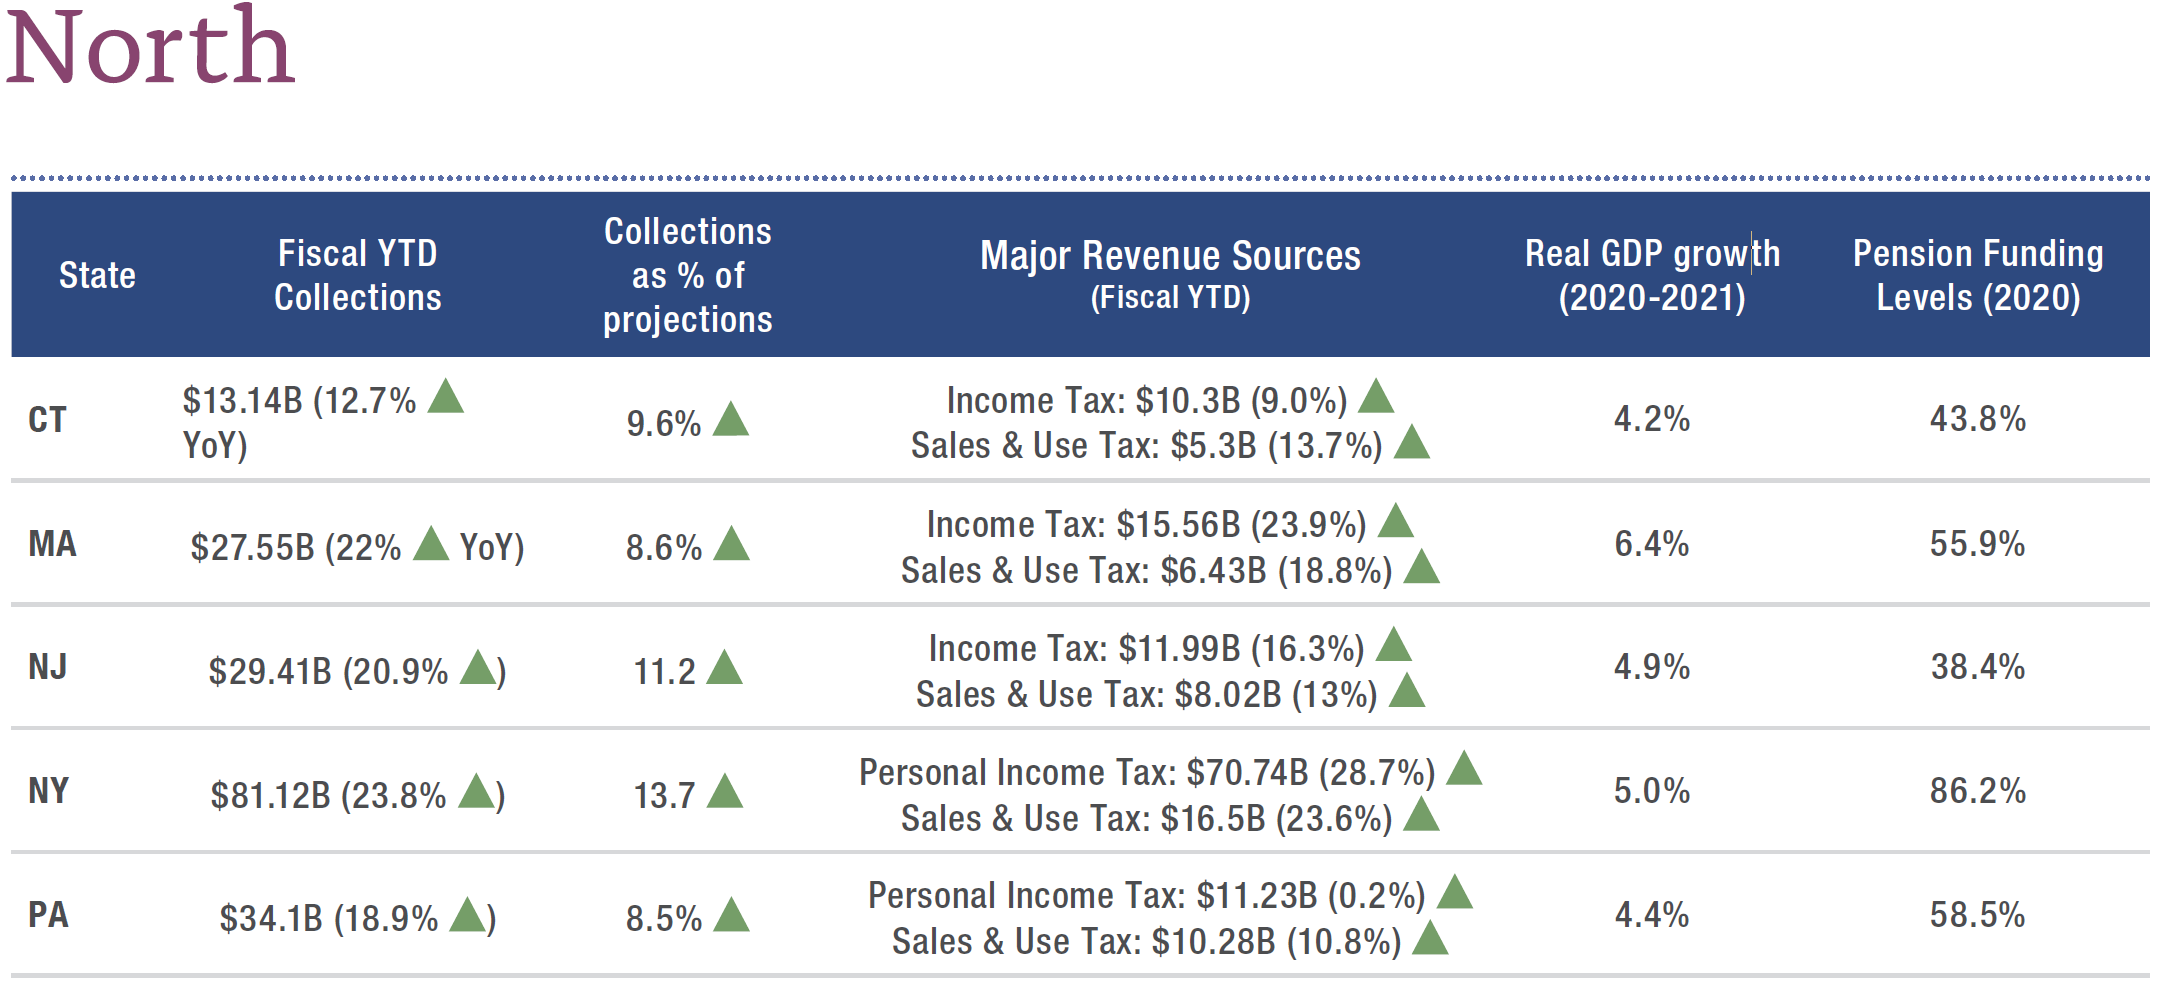
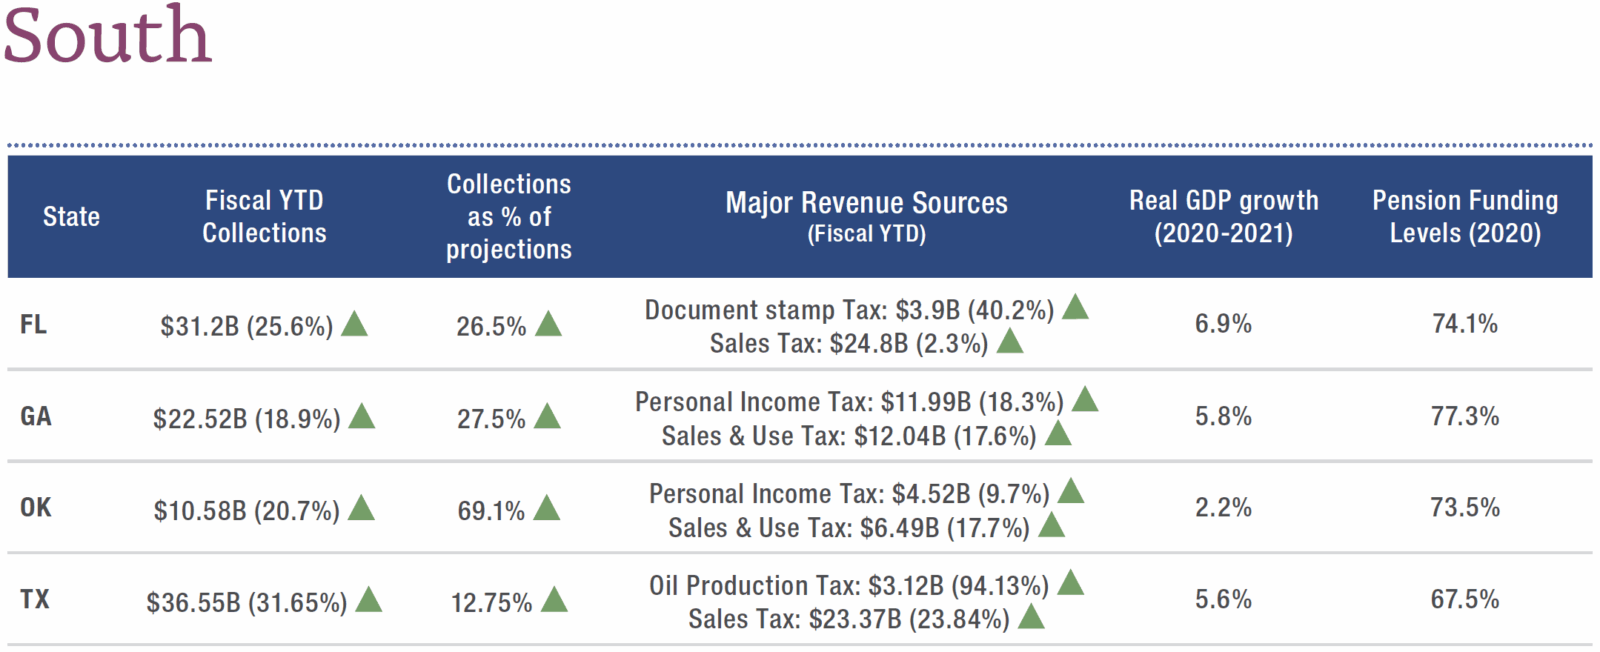
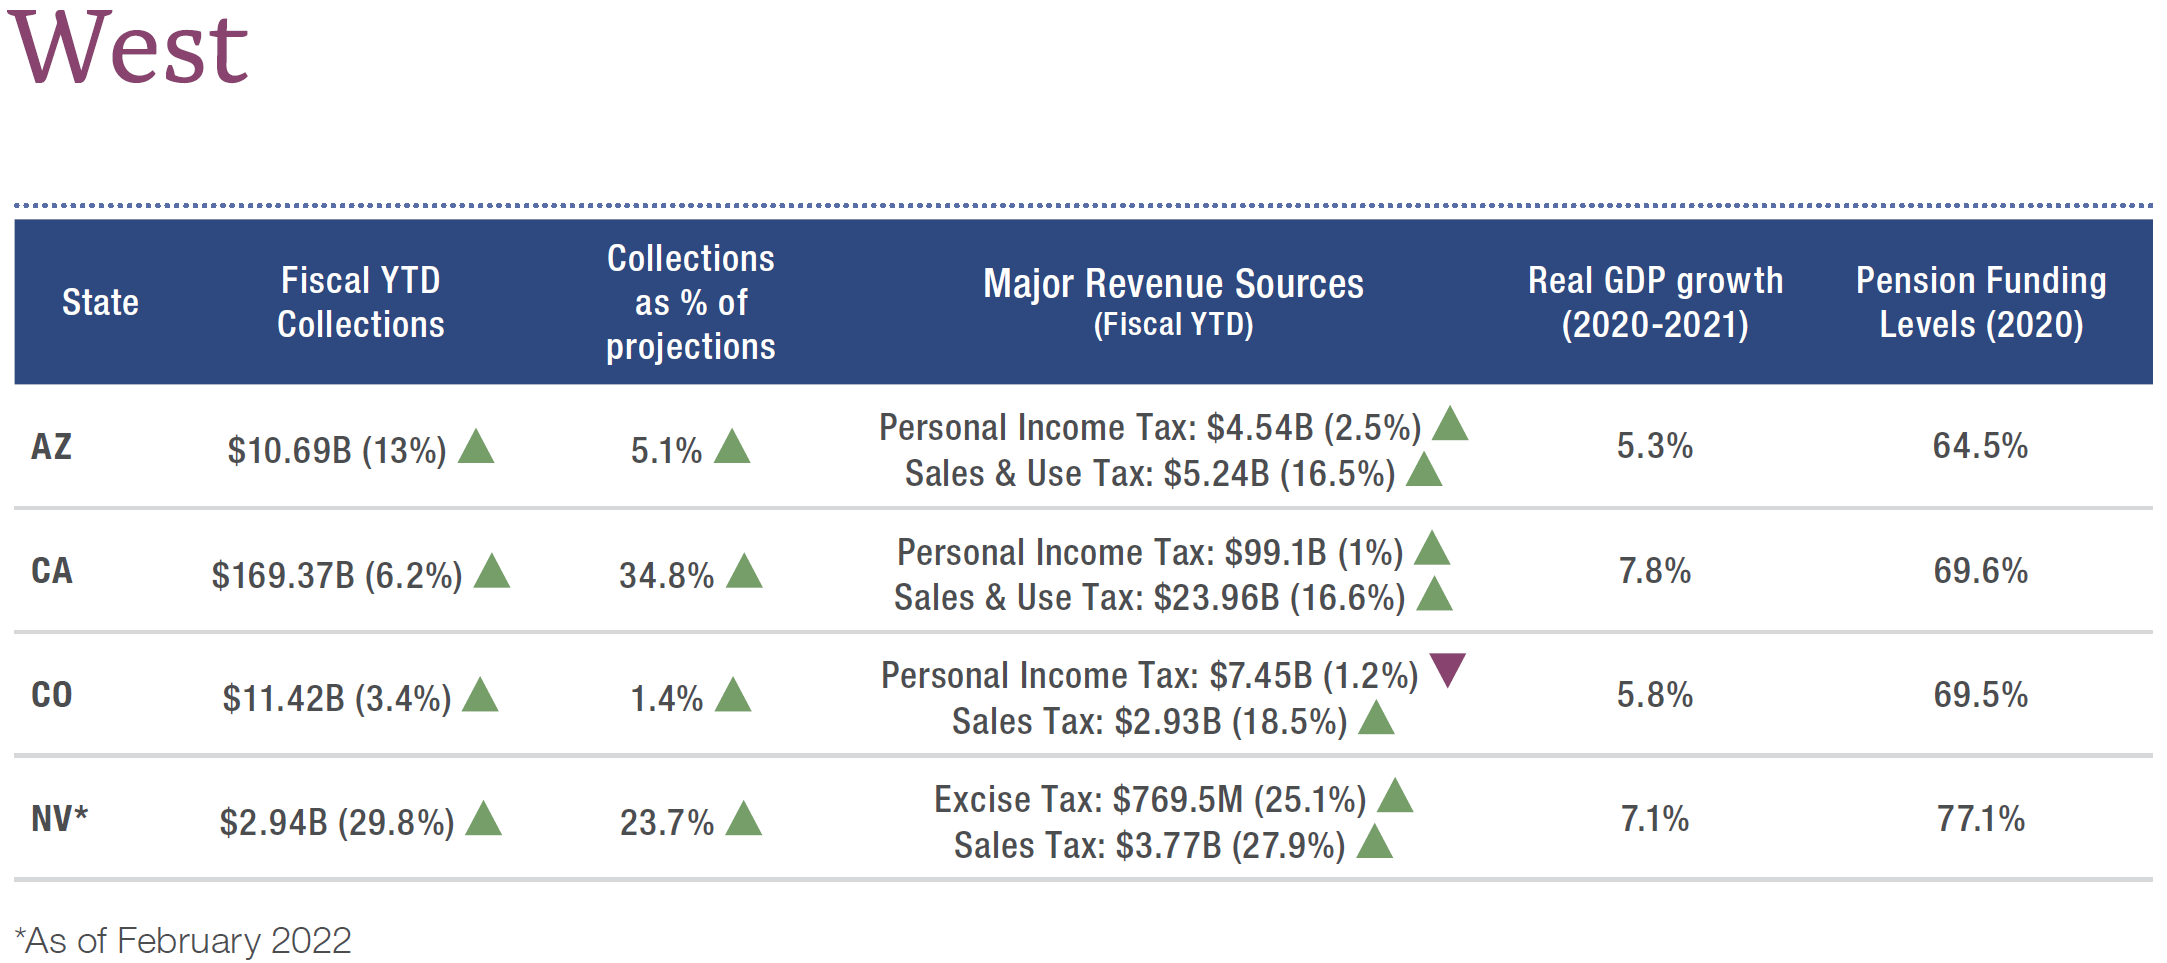
Source: New York Life Investments, Muni 360: The comprehensive view of the municipal bond market (7/1/22)
Structure mattered
“It’s only a flesh wound.” – Monty Python and the Holy Grail
The market penalty on lower coupon bonds was dramatic this year… much more than just a flesh wound. Lower coupon bonds underperformed the broad national investment grade benchmark index, year to date. Two percent and 3% coupon bonds returned -17.84% and -16.44%, respectively, compared to -9.28% for the total index. Meanwhile, 5% coupon bonds outperformed, returning -6.96%.
Source: ICE Data as of 6/30/2022
The sharp rise in rates has demonstrated the importance of coupon structure in portfolios. As interest rates rose significantly, lower coupon bond performance suffered due to 1) the tax treatment of discount bonds, as well as 2) duration extension on callable bonds priced to maturity.
The tax treatment of discount bonds: If a bond’s price falls below a de minimis threshold, the discount is taxed at an investor’s personal income tax rate, not the capital gains tax rate. For individuals, this can be significant. The de minimis rule sets the threshold at ¼ of a point a year (0.25%) for each year to maturity. A market discount on a ten-year bond with a price below $97.5 [$100 – (0.25*10)] is Federally taxed at the personal income tax rate.
Worries
“What, me worry?” – Alfred E. Neuman
Once-boring German bunds are jumping around by the most on record, while Australian bond futures are near the most volatile in 11 years. Japanese bankers are grappling with days when not a single benchmark bond trades.
Japan’s bond buyers are finding it harder to complete transactions since any period outside the 2008 global credit crunch. There have been bouts of low volume in both the cash market for government securities and in futures. Sellers failed to deliver 3.53 trillion yen ($26 billion) of government bonds in June, the second-largest amount ever in BOJ data dating back to 2001.
However, it’s in the $23 trillion U.S. Treasuries market where the dislocations are causing the most trouble. With U.S. Treasuries serving as the risk-free benchmark for more than $50 trillion of fixed-income assets, extreme volatility in their yields could make it tougher for private-sector companies to raise capital easily and at the lowest possible cost. With risk-free securities more difficult to trade, it is undermining the environment for assets that are benchmarked against them — so-called spread products.
U.S. regulators moved ahead with a plan to slash the required time to report many bond trades to one minute from 15. The Financial Industry Regulatory Authority and the Municipal Securities Rulemaking Board asked for comments on the proposal. While the majority of such transactions are already reported within one minute, “it is also clear from the data that certain types of trades are taking longer,” MSRB CEO Mark Kim said. How this may further impact liquidity remains to be seen.
Our strategy for the remainder of 2022
“Wait! Wait! Wait! Let me get this straight. You asked a psychic for decisions on municipal issues?” – The Powerpuff Girls
While we hate to speak in absolutes and, just like the Federal Reserve, we intend to be data/market dependent, the following are our general thoughts for the balance of the year.


Source: AllianceBernstein, The Week in Muniland (8/1/22)
- Municipal bonds generally remain cheap relative to taxable bonds, particularly in the 10+ year range.
- Taxable corporate bonds are likely to have more volatility than tax-exempt bonds due to underlying Treasury volatility – taxable Munis could be a good alternative.
- Under 2 years, we prefer Treasury bonds versus Munis.
- High Yield Munis continue to look attractive to us.
- Structure matters and bonds with coupons of 4% or higher are safest from a price performance standpoint.
Important Disclosures
The information contained herein has been prepared solely for educational purposes and is not intended as an offer or solicitation of an offer with respect to the purchase or sale of any security and should not be relied upon by you in evaluating the merits of investing in any securities or investment strategy. Please remember that different types of investments involve varying degrees of risk, and there can be no assurance that the future performance of any specific investment or investment strategy (including those undertaken or recommended by NewEdge) will be profitable or equal any historical performance level(s). Investors should carefully consider their own investment objectives and never rely on any single chart, graph or marketing piece in making investment decisions. NewEdge is neither a law firm, nor a certified public accounting firm, and no portion of its services should be construed as legal or accounting advice.
Certain economic and market information contained herein has been obtained from published sources prepared by other parties, which in certain cases has not been updated through the date of the distribution of these materials. While such sources are believed to be reliable for the purposes used herein, NewEdge does not assume any responsibility for the accuracy or completeness of such information. Further, no third party has assumed responsibility for independently verifying the information contained herein and accordingly no such persons make any representations with respect to the accuracy, completeness or reasonableness of the information provided herein. Unless otherwise indicated, market analysis and conclusions are based upon opinions or assumptions that NewEdge considers to be reasonable.
Forward Looking Statements:
Certain information contained herein may constitute “forward-looking statements,” which can be identified by the use of forward-looking terminology such as “may,” “will,” “should,” “expect,” “anticipate,” “project,” “estimate,” “intend,” “continue,” or “believe,” or the negatives thereof or other variations thereon or comparable terminology. Due to various risks and uncertainties, actual events, results or the actual performance of an adviser’s investments [or portfolio companies] may differ materially from those reflected or contemplated in such forward-looking statements. Nothing contained in this piece may be relied upon as a guarantee, promise, assurance or a representation as to the future.
Index and Performance Disclosures:
Investing involves risk, including possible loss of principal. Past performance is no guarantee of future results.
Historical performance results for investment indices, benchmarks, and/or categories have been provided for general informational/comparison purposes only, and generally do not reflect the deduction of transaction and/or custodial charges, the deduction of an investment management fee, nor the impact of taxes, the incurrence of which would have the effect of decreasing historical performance results. It should not be assumed that your account holdings correspond directly to any comparative indices or categories. Please Also Note: (1) performance results do not reflect the impact of taxes; (2) comparative benchmarks/indices may be more or less volatile than your accounts; and (3) a description of each comparative benchmark/index is available upon request.
Investment Disclosures:
Bonds are subject to interest rate risk. When interest rates rise, bond prices fall; generally, the longer a bond’s maturity, the more sensitive it is to this risk. Bonds may also be subject to call risk, which is the risk that the issuer will redeem the debt at its option, fully or partially, before the scheduled maturity date. The market value of debt instruments may fluctuate, and proceeds from sales prior to maturity may be more or less than the amount originally invested or the maturity value due to changes in market conditions or changes in the credit quality of the issuer. Bonds are subject to the credit risk of the issuer. This is the risk that the issuer might be unable to make interest and/or principal payments on a timely basis. Bonds are also subject to reinvestment risk, which is the risk that principal and/or interest payments from a given investment may be reinvested at a lower interest rate.
Bonds rated below investment grade may have speculative characteristics and present significant risks beyond those of other securities, including greater credit risk and price volatility in the secondary market. Investors should be careful to consider these risks alongside their individual circumstances, objectives and risk tolerance before investing in high-yield bonds. High yield bonds should comprise only a limited portion of a balanced portfolio. Interest on municipal bonds is generally exempt from federal income tax; however, some bonds may be subject to the alternative minimum tax (AMT). Typically, state tax-exemption applies if securities are issued within one’s state of residence and, if applicable, local tax-exemption applies if securities are issued within one’s city of residence.
Definitions:
Federal Open Market Committee (FOMC) – The Federal Open Market Committee (FOMC) is the branch of the Federal Reserve System that determines the direction of monetary policy specifically by directing open market operations. The committee is made up of 12 members: the seven members of the Board of Governors; the president of the Federal Reserve Bank of New York; and four of the remaining 11 Reserve Bank presidents on a rotating basis.
Federal Funds Rate – The term federal funds rate refers to the target interest rate set by the Federal Open Market Committee (FOMC). This target is the rate at which commercial banks borrow and lend their excess reserves to each other overnight.
Bloomberg Barclays Municipal Bond Index – The Bloomberg Barclays Municipal Bond Index is an unmanaged index considered to be representative of the tax-exempt municipal bond market.
Bloomberg US Aggregate Bond Index – The Bloomberg US Aggregate Bond Index is a broad-based benchmark that measures the investment grade, U.S. dollar-denominated, fixed-rate taxable bond market. This includes Treasuries, government-related and corporate securities, mortgage-backed securities, asset-backed securities and collateralized mortgage-backed securities
Bloomberg US Corporate Bond Index – The Bloomberg US Corporate Bond Index measures the investment grade, fixed-rate, taxable corporate bond market. It includes USD denominated securities publicly issued by US and non-US industrial, utility and financial issuers.
Credit Spread – A credit spread is the difference in yield between a U.S. Treasury bond and another debt security of the same maturity but different credit quality. Credit spreads between U.S. Treasuries and other bond issuances are measured in basis points, with a 1% difference in yield equal to a spread of 100 basis points.
NewEdge Wealth is a division of NewEdge Capital Group, LLC. Investment advisory services offered through NewEdge Wealth, LLC an investment adviser registered with the US Securities and Exchange Commission. Securities offered through NewEdge Securities, Inc. Member FINRA/SIPC.


