


“We shall not cease from exploration
And the end of all our exploring
Will be to arrive where we started
And know the place for the first time.”
– T.S. Eliot, from “Little Gidding,” Four Quartets
As the final days of December dwindle away, this time of year is filled with a sense of both reflection and expectation. Reflection for the year that was and expectation for the year that could be.
In a few weeks’ time, we will be sharing our expectations for 2023, but before that, we want to share our reflections on the turbulence of 2022.
Here are 22 charts that capture the turmoil, major shifts, present fears, opportunities, and (sometimes surprising) resilience of 2022.
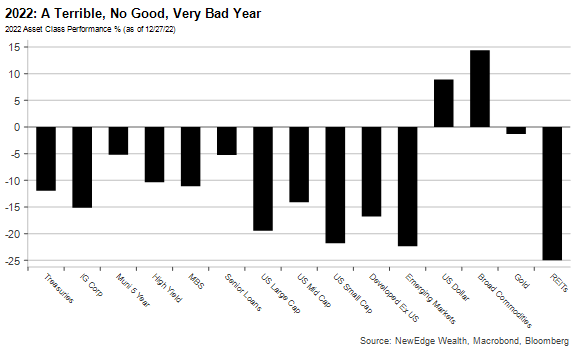
1. A Terrible, No Good, Very Bad Year
Almost every major asset class struggled in 2022, except for the US Dollar and broad commodities. Some asset classes, mostly in fixed income, experienced record drawdowns during the year.
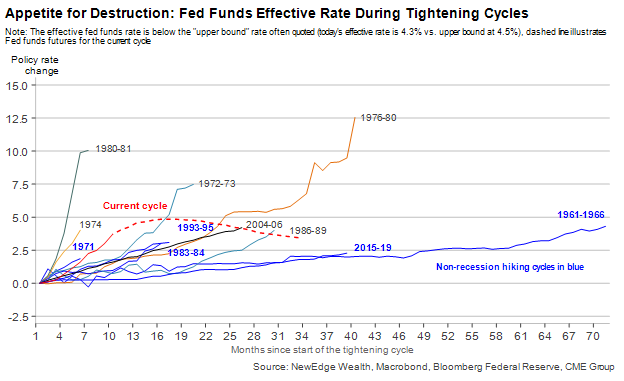
2. Appetite for Destruction
The Fed engaged in its most rapid tightening cycle since the Volker era of the early 1980s, raising rates by 450 bps in just 10 months.
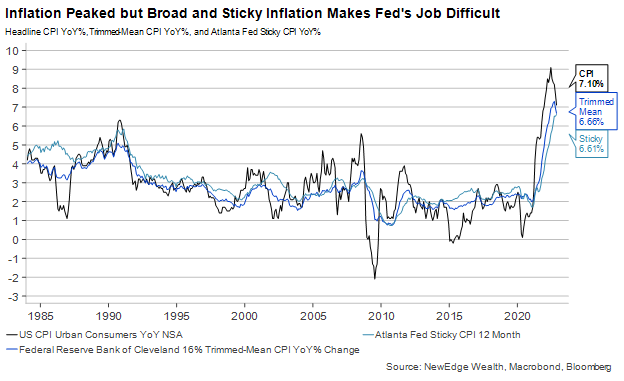
3. Transitioning From Transitory
The Fed’s rapid tightening cycle in 2022 was in response to inflation that proved to be far more elevated and persistent than the Fed had hoped during its “transitory” era of assertions of 2021. Inflation appears to have peaked in mid-2022, but inflation remains far above the Fed’s 2% target, including in important measures of sticky inflation and inflation breadth (trimmed mean).
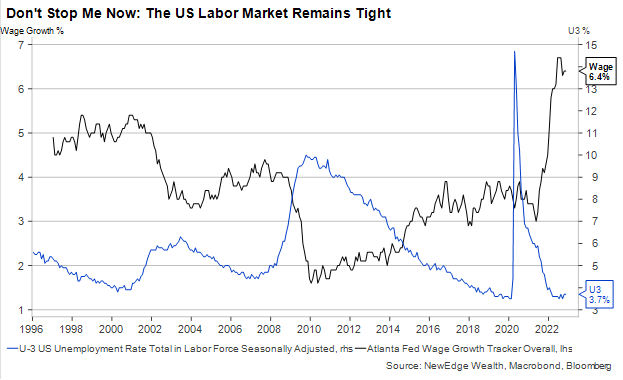
4. Don’t Stop Me Now
For all of the Fed’s tightening in 2022 and commentary about the need for “slack” in the labor market in order to control inflation, the US labor market ends 2022 just as tight as it started. Unemployment is near 50-year lows at 3.7%, wage growth is still running hot at +6.4%, and there are still 1.7 jobs per unemployed worker. The resilient labor market is why US consumer demand remained firm in 2022, despite the pressures from inflation.
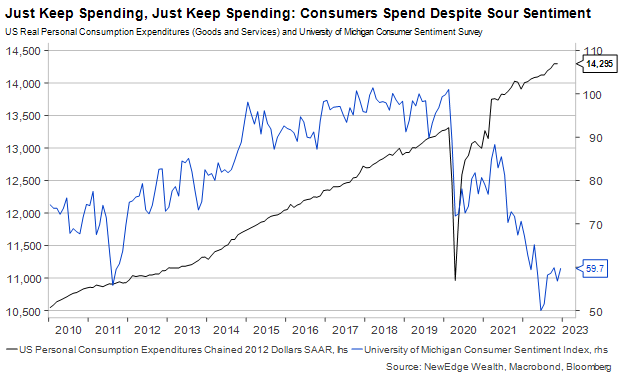
5. Just Keep Spending, Just Keep Spending
Consumer sentiment was abysmal all throughout 2022, falling to Great Financial Crisis lows. Despite feeling awful, consumers continued to spend in 2022, supported by the strong jobs market, wage gains, spending down of pandemic savings/wealth effect, and falling energy prices in 2H22.
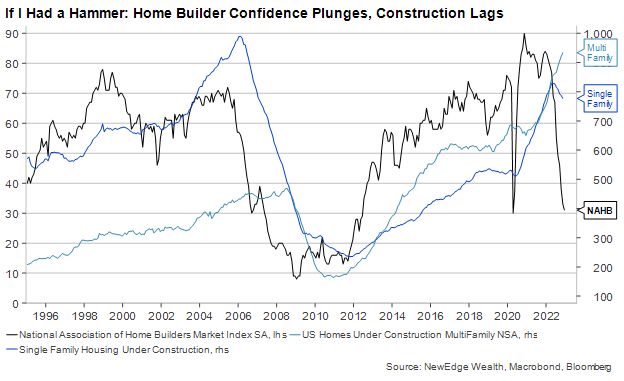
6. If I Had a Hammer
As mortgage rates soared in 2022, and housing activity slowed materially, home builders’ assessment of market conditions plunged to 2020 lockdown-lows. Despite this sour sentiment, new homes and apartments under construction remained robust. This is a great example of the time it takes rate hikes to work their way through to the real economy, as the construction of new homes, and all of the related employment and industries, lags home builder sentiment and house price growth.
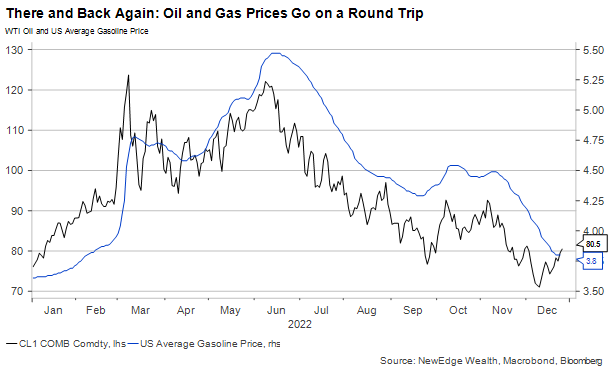
7. There and Back Again
The first half of 2022 saw soaring oil and gas prices, but come summer, these prices peaked and proceeded to roundtrip the majority of the early 2022 gains. This contributed to moderating inflation and improved consumer sentiment in the second half of 2022.
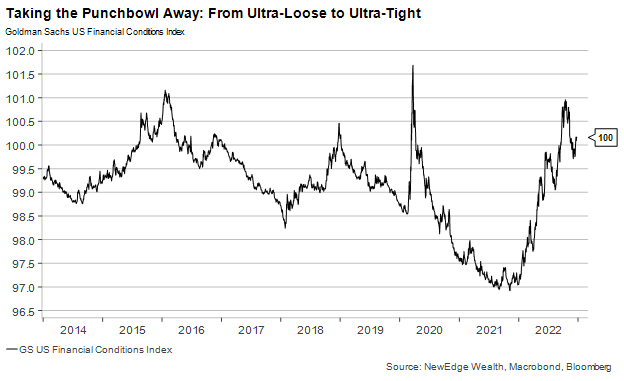
8. Taking the Punchbowl Away
In response to the Fed’s rapid tightening cycle, financial conditions tightened materially. Financial conditions tightening reflects lower equity valuations, higher interest rates, wider credit spreads, and a stronger USD. 2022 started with ultra-loose, ultra-accommodative financial conditions (the Fed was still stimulating even as inflation and growth were running hot) and ended with financial conditions near prior peaks of tightness (2016, 2018, 2020). The rally in bonds and equities in 4Q22 led to a quick loosening in conditions late in the year.
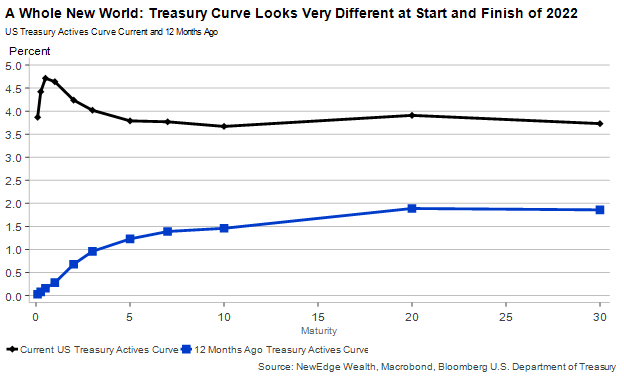
9. A Whole New World
In response to the rapid and significant tightening of policy from the Fed, the US Treasury yield curve (a plot of yields of Treasury bonds of each maturity) finished 2022 very different from how it started, with all yields along the curve meaningfully higher. The biggest moves were in the front end of the curve (i.e., the 2 Year yield went from 0.7% to 4.3%), which is most sensitive to Fed policy. You can almost hear the 2-year singing, “I’m like a shooting star, I’ve come so far, I can’t go back to where I used to be”.
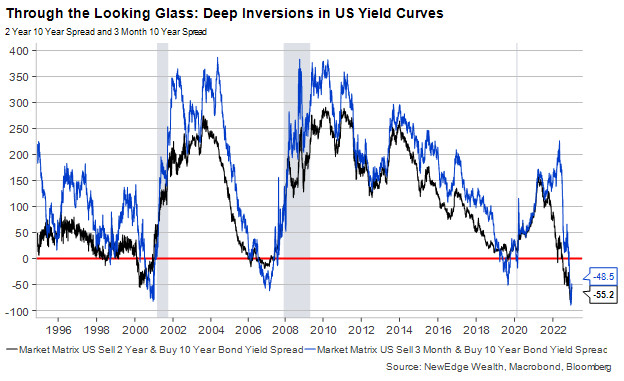
10. Through the Looking Glass
Exiting 2022, the yield curve is deeply inverted (meaning short yields are higher than long yields). This inversion is often used as a recession signal because it could reflect the bond market warning that the Fed is becoming too tight for the underlying economy. We note the most reliable signal for impending recession is when the yield curve begins to re-steepen due to the bond market pricing in imminent rate cuts into shorter term yields.
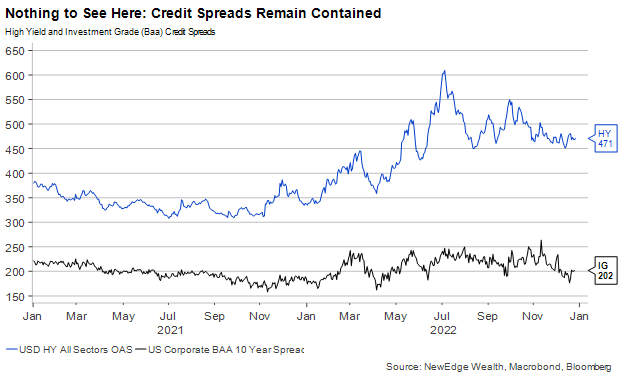
11. Nothing to See Here
Despite the inverted yield curve and widespread fears about an impending recession, credit spreads (the extra yield credit investors earn for lending to riskier borrowers) have remained contained in 2022. This is likely due to a combination of still-resilient economic data/corporate earnings, stronger corporate balance sheets (many used ultra-low interest rates in 2020 and 2021 to “term out” their debt), low supply of new bonds in 2022, and all-in yields being near decade-plus highs (meaning buy and hold investors could lock in relatively attractive yields).
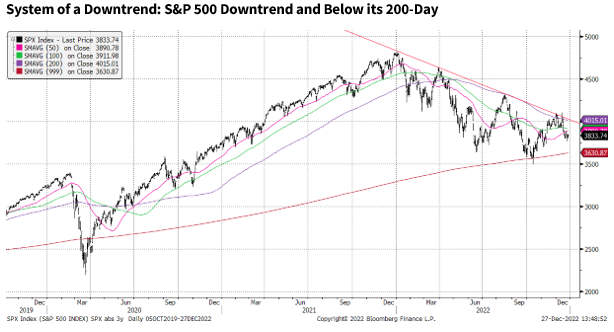
12. System of a Downtrend
US equities swiftly got off to a weak start in 2022, with the S&P 500 forming a distinct downtrend of lower highs and lower lows. Many powerful rallies were experienced along the way, sparking hope by bulls that “buy the dip” would prove profitable again. These hopes were dashed, with the downtrend remaining firmly in place and no escape velocity to break above the 200-day moving average. Note the support that held ~3500 at the 200-week moving average.
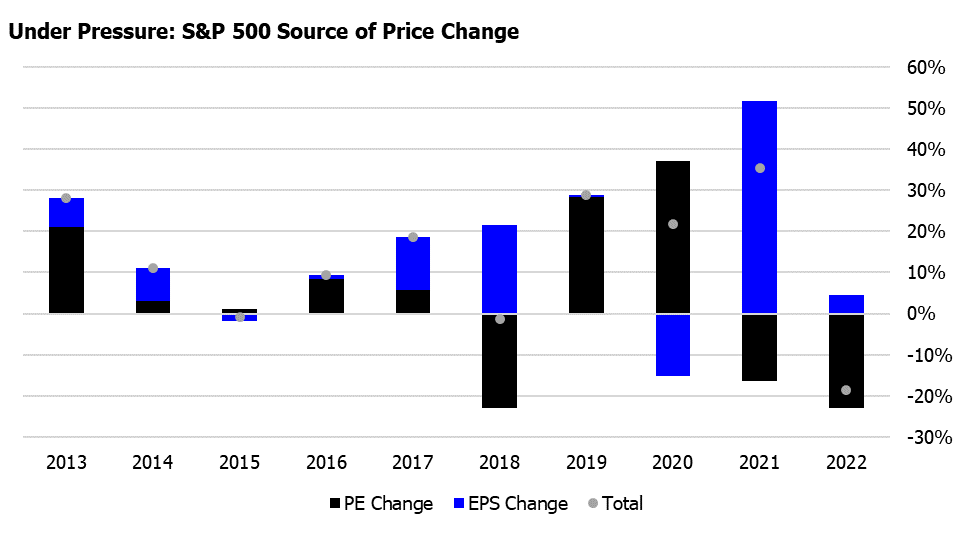
13. Under Pressure
The source of the S&P 500’s downside in 2022 was entirely due to a decline in the index’s PE multiple (valuation multiple compression), as earnings grew slightly in 2022. The fall in valuation was due to the removal of pandemic-era, aggressive stimulus, which had suppressed interest rates and unsustainably boosted valuations to bubble territory in 2020 and 2021. The unwind in valuations began in 2021 but was offset by powerful earnings growth that year. With only slight earnings growth in 2022, indices struggled as valuations fell back to reality.
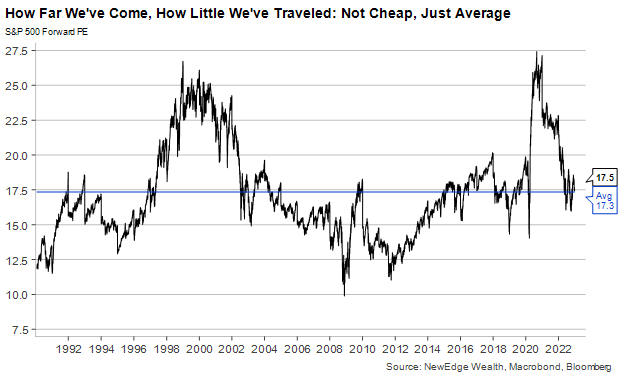
14. How Far We’ve Come, How Little We’ve Traveled
For as much turmoil as investors experienced in 2022, we’ve made surprisingly little progress toward the S&P becoming “cheap”. Current valuations, though down from the 2020/2021 bubble highs, are now just in line with the average (based on consensus earnings estimates, which could be optimistic for 2022).
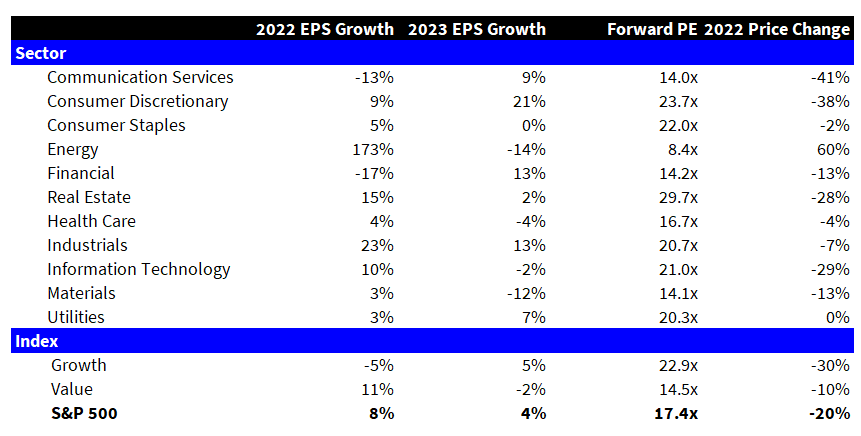
15. If You Ain’t First, You’re Last
Energy was the one and only sector that delivered a positive price return in 2022, +60% for the year. The dispersion in returns was incredible, with the spread between the best (Energy) and worst (Communication Services) an eye-popping 100%! Energy was boosted by huge earnings growth in 2022 (+175%), while Financials saw the weakest earnings performance in 2022 (-17%).
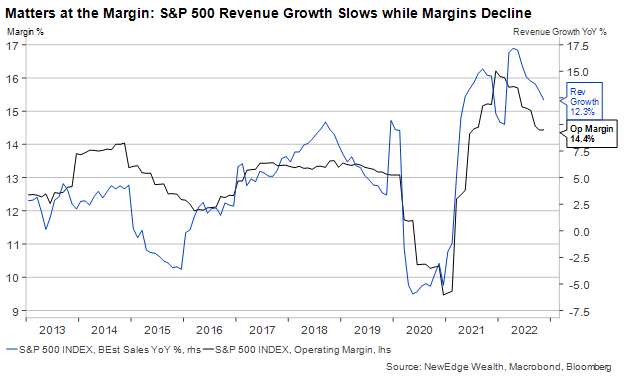
16. Matters at the Margin
2022 saw S&P 500 revenues climb to a new all-time high with robust low-teens growth, but margins fell over the course of the year (margins were the source of downside earnings revisions in 2022). If revenue growth continues to slow in 2023 (tough comparisons, less pricing power/inflation, slowing GDP), the risk is that margins decline further, which could result in S&P 500 YoY EPS declines.
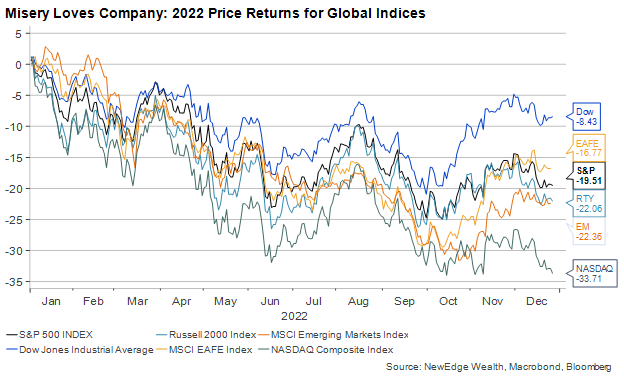
17. Misery Loves Company
All major global stock indices fell in 2022, with the worst decline experienced by the NASDAQ Composite (which had the highest valuation going into 2022). The Dow Jones Industrial average outperformed thanks to its higher weighting to relative winners like Health Care, Industrials, and Financials (Value) and lower weighting to Technology (Growth). Non-US indices, both Developed and Emerging, staged a powerful rebound in 4Q22 given the sharp weakening in the US Dollar and hopes for China reopening.
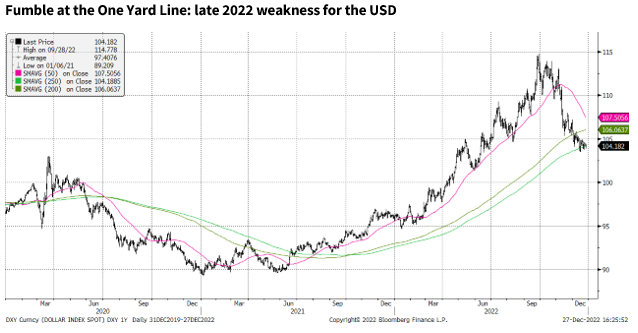
18. Fumble at the One Yard Line
The US Dollar (USD, DXY Index) staged a powerful rally throughout 2022 until November when the currency experienced a rapid and pronounced sell off (boosting shares of non-US stocks). The USD has found support at its 50-week moving average (shown here as the 250-day moving average), with the path of the USD being hugely important for equity market leadership in 2022.
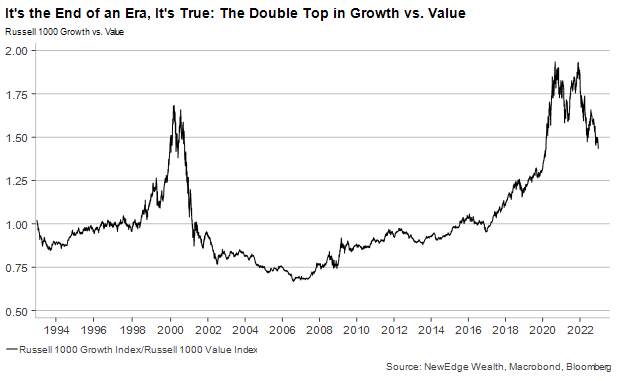
19. It’s the End of an Era, It’s True
Similar to the underperformance of the NASDAQ Composite vs. the Dow Jones Industrial Average, Growth significantly underperformed value in 2022 as the COVID growth bubble popped. This underperformance (and the double top that preceded it) is reminiscent of the early 2000’s unwind of the tech bubble. One key ingredient of the 2000’s Value rally was a weak USD that boosted cyclical and commodity-oriented sectors (along with non-US stocks).
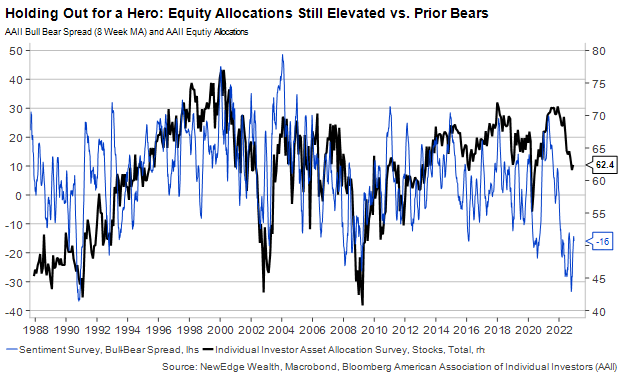
20. Holding Out for a Hero
Despite terrible investor sentiment all year, individual equity investors were slow to reduce their holdings in equities. Overall allocations to equities are off of their highs (down from 70% to 62% today) but remain well above prior major bear market lows (45-50% in 2001 and 2009).
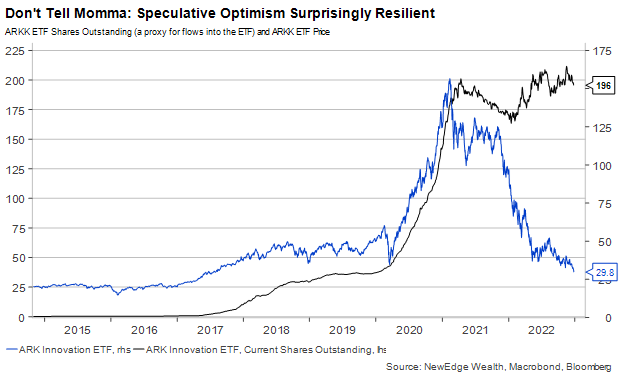
21. Don’t Tell Momma
ARKK Innovation is one of the best proxies and poster children for 2020 and 2021’s valuation and speculative excesses. Despite the weak performance by growth, and even weaker performance by the most speculative growth parts of the market (ARKK -85% from the 2021 peak), there are now more shares outstanding in this ETF (a proxy for flows into the fund) than at the peak of the ETF price in 2021. There are other signs that speculative optimism has not been fully squashed by 2022’s rout, such as DogeCoin’s market cap still hovering near $10B.
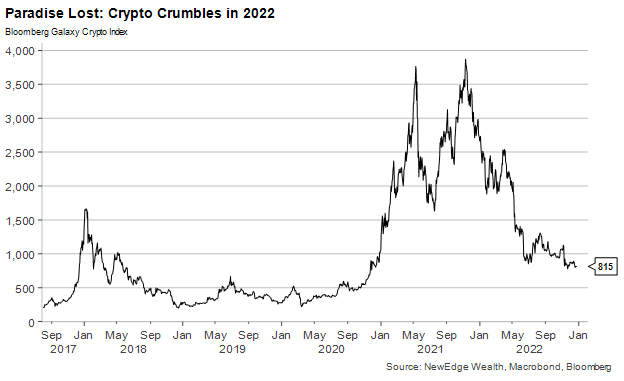
22. Paradise Lost
Another expression of 2020 and 2021’s speculative liquidity bubble, and 2022s subsequent unwind, is crypto. As liquidity left markets and crypto prices fell, there were many high-profile crypto participants who were caught swimming without their proverbial shorts (overleverage, potential frauds, etc.). The past three years in crypto were a harsh reminder that there is great danger in ascribing narrative to price action.
IMPORTANT DISCLOSURES
The views and opinions included in these materials belong to their author and do not necessarily reflect the views and opinions of NewEdge Capital Group, LLC.
This information is general in nature and has been prepared solely for informational and educational purposes and does not constitute an offer or a recommendation to buy or sell any particular security or to adopt any specific investment strategy.
NewEdge and its affiliates do not render advice on legal, tax and/or tax accounting matters. You should consult your personal tax and/or legal advisor to learn about any potential tax or other implications that may result from acting on a particular recommendation.
The trademarks and service marks contained herein are the property of their respective owners. Unless otherwise specifically indicated, all information with respect to any third party not affiliated with NewEdge has been provided by, and is the sole responsibility of, such third party and has not been independently verified by NewEdge, its affiliates or any other independent third party. No representation is given with respect to its accuracy or completeness, and such information and opinions may change without notice.
Investing involves risk, including possible loss of principal. Past performance is no guarantee of future results.
Any forward-looking statements or forecasts are based on assumptions and actual results are expected to vary from any such statements or forecasts. No assurance can be given that investment objectives or target returns will be achieved. Future returns may be higher or lower than the estimates presented herein.
An investment cannot be made directly in an index. Indices are unmanaged and have no fees or expenses. You can obtain information about many indices online at a variety of sources including: https://www.sec.gov/answers/indices.htm.
All data is subject to change without notice.
© 2026 NewEdge Capital Group, LLC

