Weekly Summary: October 18 – 22, 2021
Key Observations:
- Most investors now appear to have a bullish bias towards equities but differ greatly in their choice of preferred holdings.
- Both analysts and investors are in general agreement on the principal issues confronting the financial markets. However, there is a great dispersion of views and potential outcomes.
- We believe that in this uncertain environment, stock selection will become increasingly important, and a detailed analysis of each company’s idiosyncrasies will be critical in assessing the risk/reward of buying, holding or selling any particular security.
- Many surveys and data show slowing, but still expansionary economic growth trends, as well as rising inflation and wages, and a myriad of supply chain issues.
The Upshot: The ability to maintain and even grow profitable margins will be a critical element in determining the desirability of individual equity investments. Energy supplies and their costs, along with the cost and availability of electricity could have a dramatic effect on supply chains, economic growth and inflation if the world experiences a colder than normal winter.
If Home is Higher Equity Prices, Investors Disagree on Direction Home
In the words of Bob Dylan, the financial markets act lately like they have “no direction home … like a rolling stone.” In other words, although we maintain our view that Value/Cyclical type stocks continue to offer a better risk/reward opportunity relative to more Defensive/Growth type of stocks in the near to intermediate-term, investor sentiment appears to shift almost on a daily basis with “no direction home.” These shifts in sentiment appear to be among sectors, yield curves, etc. and not about the overall positive trend of equities. Ever since the most recent negative trading pattern of U.S. equities – trading higher in the morning and lower in the last hour – was broken last week, the S&P 500 has gained a total of over 4% on seven consecutive positive trading days, which is the longest such streak since July.
Variability
While the first two-thirds of October clearly shows a positive bias towards the Value/Cyclical type stocks, the first part of this week was much more mixed in terms of performance. For example, the Consumer Discretionary sector was the best and worst performing sector on consecutive days this week. Last week, the yield curve aggressively flattened on one day whereas this week, the yield curve aggressively steepened on one day. In general, the shape of the yield curve has been rather unpredictable day-to-day during these past two weeks. Yield curves flatten when longer duration yields trade lower relative to the movement of shorter duration yields.
Divergence of Opinions
The rather erratic trading patterns in certain sectors seem to reflect investors’ uncertainty as to their preferred investments. The usual questions dominate with perhaps the most important question being whether inflation is “transitory” or more persistent. The definition of what is transitory seems to depend on one’s individual bias. For those who think that inflation is transitory, this period tends to be longer than for those who think it’s persistent. Some investors even seem to believe that we are at or close to peak inflation. We do not share that view. There is a wide divergence of opinion as to global economic growth rates. Economic growth rates continue to be affected negatively by sourcing constraints and disruptions, labor shortages, rising shipping costs and supply chain interruptions and many investors and analysts believe that economic growth is slowing worldwide.
P&G as an Example of Idiosyncrasies
In its earnings release on October 19, Proctor & Gamble (P&G) revealed many of these issues. The company raised its forecasted inflation “hit” to its fiscal-2022 earnings from the previous outlook of $1.9 billion to the revised estimate of $2.3 billion. These costs included higher commodity and freight costs. Due to its large size and pricing power, P&G selectively chose to raise some prices to cover a portion of its higher costs. Also, Citi Research (Citi) observed in its October 19 report that P&G’s “productivity/cost savings opportunities remain deep and intact, and that the company has some sourcing flexibility in the supply chain to react to the current environment.” Our focus on P&G is to illustrate that larger companies will most likely be better able to protect their profit margins, in terms of their pricing power and their ability to adjust their sourcing patterns and further optimize their supply chain networks.
Stock Selection Becoming Increasingly Important
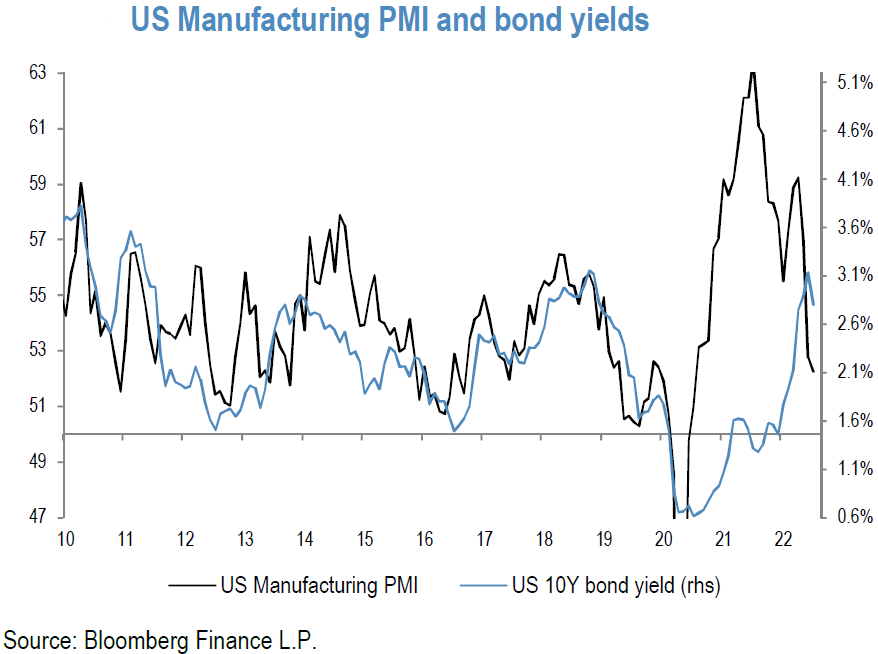
As we progress through Q3 earnings reports, we believe that stock selectivity will become increasingly important. Profit margins and pricing power should be carefully scrutinized and a company’s guidance on these factors will be important. Many surveys continue to highlight slowing, but still expansionary economic growth, labor shortages that will lead to wage increases, as well as rising input costs and companies’ ability to increase their prices received. As indicated in our prior commentaries, these trends were exemplified by many Purchasing Managers’ Index (PMI) reports of the past few months for both manufacturing and services.
Fed’s Beige Book
The Federal Reserve System’s (Fed’s) Beige Book released this week confirmed these trends as well. This report, which the Fed publishes eight times per year, is meant to characterize changes in economic conditions since the previous report.
In general, the majority of Districts reported that economic activity grew at a modest to moderate rate and several noted that the pace of growth had slowed during the period covered by the report, which includes September. The typical reasons given for slowing growth included supply chain disruptions, labor shortages and uncertainty around the Delta variant – same old story. The majority of Districts reported “robust” wage growth along with a low supply of labor. Most Districts also reported “significantly elevated prices.” Input price increases were widespread across almost all industry sectors. Increased shipping costs, insufficient labor supply and commodity shortages added to inflationary pressures on input prices. Supply chain bottlenecks further contributed to product scarcity. However, many firms were able to raise their selling prices and pass along these cost increases to customers amid strong demand. The report also confirmed our general impression that inflation expectations vary widely. Some firms expected price growth “to remain high or increase further while others expected prices to moderate over the next 12 months.”
Source: Citi, Global Economic Outlook & Strategy: Stagflation is a metaphor (for now) (10/20/2021)
U.S. Housing Data More Positive Generally
Additionally, the U.S. housing related data released this week generally supported the outlook of a relatively healthy economy. The National Association of Homebuilders (NAHB) survey of homebuilders’ confidence rose more than expected in October and delivered the largest monthly increase since November. The latest U.S. housing starts and permits data was disappointing on the surface. But the disappointments were focused on volatile data for multi-family units. Data for single family homes were generally stable. Finally, according to the National Association of Realtors (NAR), while down 2.3% year-over-year, existing home sales rose more than expected at a rate of 7% month-over-month in September. CNBC’s October 21 report indicated that first time buyers accounted for only 28% of sales, the lowest since July 2015. The high median price of $352,800 in September was 13.3% higher than it was 12 months ago. This increase was due at least partly because of low inventory levels, which were down 13% year-over-year and evidently played a role in the dearth of first-time buyers. The NAR characterized the prices as high, but now moderating.
Leading Indicators Continue Positive
The associated rhetoric tied to this week’s release of the U.S. Conference Board Leading Economic Index (LEI) for September, which continued to increase, was supportive of the above observations. According to the Senior Director of Economic Research at the Conference Board, the U.S. “economy remains on a more moderate growth trajectory compared to the first half of the year.” Despite the slower growth of the index over the past few months, the Senior Director viewed the “strengths among the components” as remaining widespread. He stated that the headwinds for the U.S. economy included the “Delta variant, rising inflation fears, and supply chain disruptions.” The Conference Board determines the value of LEI from 10 key variables as an indication of future economic activity.
U.S. Industrial Production
We did not find the disappointing U.S. industrial production numbers announced early this week as very troublesome. According to a J.P Morgan (JPM) report from October 18, about half of the reported shortfall was attributed to lingering effects from Hurricane Ida. A sharp decline in auto production also negatively impacted the results.
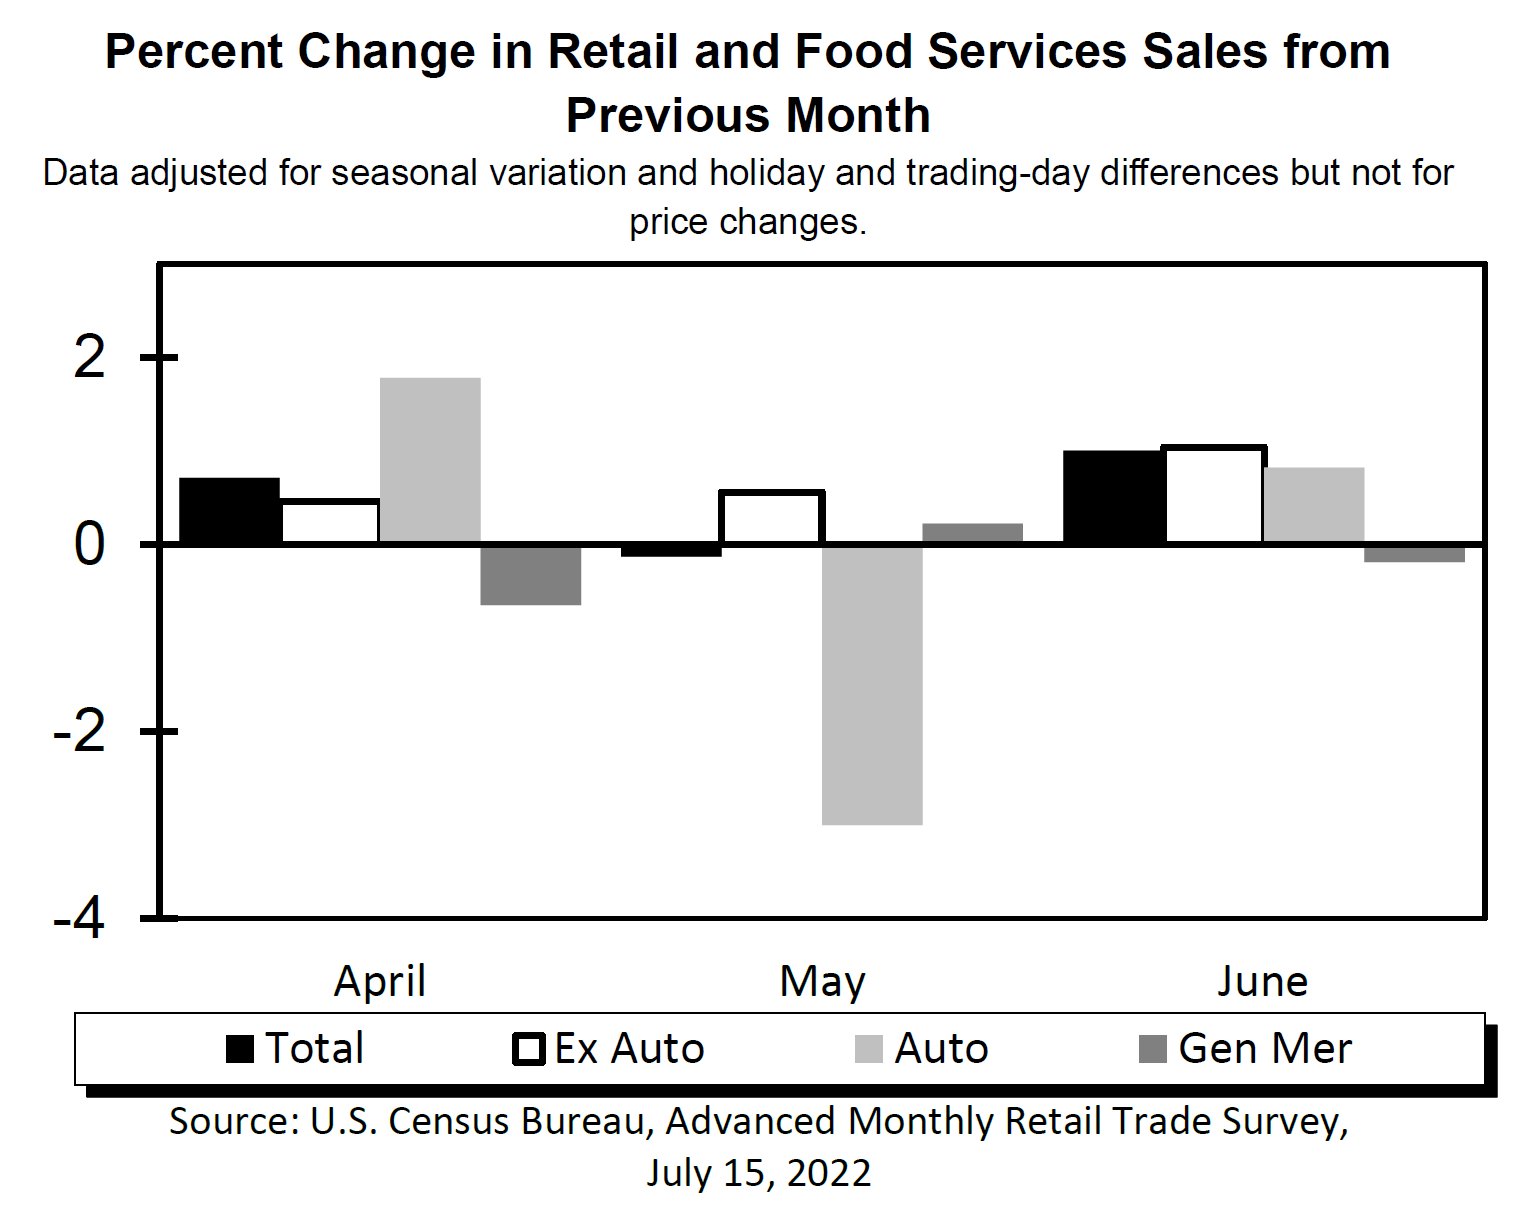
U.S. Retail Sales – Demand vs. Supply
Auto sales had a very positive effect on the much better than expected U.S. retail results that were announced at the end of last week. Citi remarked in its October 15 report that the “continued rise in consumption supports the story of still very strong demand despite recent concerns over softer growth.” Citi also acknowledged that at least part of the surprising strength of September retail sales was due to higher prices.
The supply shortages evident at retailers are causing consumers to buy early for fear of empty shelves later. This might be true especially for the holidays. October sales could remain strong before a drop-off in November and December. Likewise, CNBC quoted on October 20 the CEO of supply chain technology firm Quincus, who stated that, “Suddenly retailers and manufactures are overordering because of these supply chain issues, and that’s just leading to essentially an even worse scenario.”
Sources of Supply Chain Issues
As we have recently highlighted in our commentaries, the energy crisis in mainland China and Europe has further disrupted supply chains. This has been especially true with respect to China, which even has resorted to rationing power. China has further compounded this problem by more strictly implementing its “dual control energy” policy. The recently announced weaker than expected China Q3 GDP report has amplified further economic growth concerns. As we have previously described, a colder than normal winter could lead to further slowing of economic growth accompanied with higher inflation. The longer such conditions persist, the more likely that higher inflation expectations could become embedded. The newly discovered Delta variant in the U.K. could have further unknown ramifications. We expect that the zero-carbon emissions goals of many countries will make solving the energy and electricity needs a more expensive and a more unpredictable process that could lead to future supply chain issues.
Agreement on Identifying Main Issues
The common theme in the data is signs of slower but still expansionary global economic growth rates, higher inflation rates, supply chain disruptions and shortages, higher wage growth, persistent labor shortages and shipping logistic issues. Most investors would probably agree with these concerns. But there is a wide dispersion of opinions regarding the trend and magnitudes of these issues.
Idiosyncratic Approach
As the Q3 earnings season unfolds, we believe that it will become increasingly important to be very selective in stock picking. We anticipate that a more idiosyncratic approach will yield the best results. A detailed analysis should include at minimum supply chains, availability, and price of inputs — including labor –, pricing power, shipping costs and reliability, as well as the ability to maintain and even grow profit margins. The ability to substitute inputs might also be of interest where appropriate. The pandemic has resulted in very uneven and unpredictable effects. This seems to mandate a more idiosyncratic approach to stock selection.
Noteworthy Mention this Week – Debut of Bitcoin Futures Exchange-Traded Fund (ETF)
After being “greenlighted” by the Securities and Exchange Commission (SEC) last week, the ProShares Bitcoin Strategy ETF (BITO), which tracks Bitcoin futures contracts that are pegged to the future prices of Bitcoin, began trading on October 19. The SEC allowed ProShares application for its ETF to become effective without explicitly approving it. This was the first Bitcoin-linked investment product ever “approved” by the SEC.
According to a CNBC report of October 20, Bitcoin set a new record intra-day high price of $66,900 on the second day of BITO trading, surpassing the prior intra-day high of $64,899 set in mid-April. This ETF does not own any Bitcoins. It does not even track spot (actual) prices of where Bitcoin trades. It tracks only futures contracts of Bitcoins. A futures contract is an agreement to buy or sell an asset in the future at some specified price. It is a derivative contract, which is not directly backed by physical Bitcoins. Furthermore, futures ETFs hold contracts that periodically expire and have to be repurchased to continue to have exposure to Bitcoin price movements. This will result in a “tracking” error between the ETF and actual, spot Bitcoin prices. According to NextAdvisor on October 21, the expense ratio for the BITO ETF is 0.95% — $95 for every $10,000 invested in BITO will go towards the fund’s operating expenses. For comparison, low-cost index funds have expense ratios of less than 0.03%.
There were two prior significant announcements that precipitated Bitcoin trading at new highs. The first was PayPal’s announcement in October of 2020, that it would allow people to trade certain cryptocurrencies, including Bitcoin, on its sites and applications. The second was the mid-April 2021 public listing of Coinbase, which operates a cryptocurrency exchange platform. Each of these announcements was taken as a sign that despite being very speculative, Bitcoin was becoming further accepted as “legitimate.”
It is well known that Bitcoin spot prices are extremely volatile. Futures are typically even more volatile than the underlying asset to which they are linked. Bitcoin has a history of large price swings over short time frames. It is our impression that most long-term holders of actual Bitcoins are prepared to “live with” huge volatility and believe in a “network effect.” An example of the network effect is the increasing adoption and use of the internet which led to the increase in the values of internet stocks, everything else being equal. In essence it means that something becomes more valuable as more people want to consume or use certain products.
Bottom Line
Considering the uneven effects caused by the pandemic, we believe that a detailed analysis of each company would be greatly beneficial for properly assessing the attractiveness of investing in such a company. Given P&G’s comments, which accompanied its earnings results, it would appear that larger companies might have an advantage over smaller companies in maintaining and perhaps even growing their profit margins. In general, larger companies would most likely have stronger pricing power and would be able to deal more effectively with supply issues. Of course, pricing power would also depend on many other factors including the competitive environment.
We maintain our view that inflation will prove to be persistent. Additionally, we expect that economic growth will continue to be expansionary and that the reopening of economies will gather momentum as the coronavirus is further contained. We expect the yield on the 10-year Treasury to continue its ascent in what could be an erratic fashion as investors’ sentiment shifts. Furthermore, we maintain our view that the risk/reward opportunity to buy is more favorable for Value/Cyclical type stocks over Defensive/Growth type stocks as our higher interest rate scenario is realized. Our base case is for a weaker USD in the short to intermediate term. However, we would expect a strengthening USD if a stagflation possibility became the predominant thesis. We expect future surprises.
Charts of Interest
Source: Morgan Stanley, The Oil Manual: Which Will Peak Earlier? Supply? Or Demand? (10/19/2021)
Source: Goldman Sachs, China power shortages – tracking 4Q, thinking green beyond in UN SDG approach (10/20/2021)
Source: Goldman Sachs, EM ex-China as a separate equity asset class (10/20/2021)
Source: Citi, US Economics: The Daily Update (10/22/2021)


INDEX DEFINITIONS
KBW Nasdaq Bank Index (BKX): The KBW Bank Index is designed to track the performance of the leading banks and thrifts that are publicly-traded in the U.S. The Index includes 24 banking stocks representing the large U.S. national money centers, regional banks and thrift institutions.
MSCI EM Value Index: The MSCI Emerging Markets Value Index captures large and mid cap securities exhibiting overall value style characteristics across 27 Emerging Markets (EM) countries.
MSCI EM Index: The MSCI Emerging Markets Index captures large and mid cap representation across 27 Emerging Markets (EM) countries.
NASDAQ: The Nasdaq Composite Index is the market capitalization-weighted index of over 2,500 common equities listed on the Nasdaq stock exchange.
PCE: Personal Consumption Expenditures (PCEs) refers to a measure of imputed household expenditures defined for a period of time.
Russell 1000 Growth: The Russell 1000 Growth Index measures the performance of the large-cap growth segment of the U.S. equity universe. It includes those Russell 1000 companies with higher price-to-book ratios and higher forecasted and historical growth values.
Russell 1000 Value: The Russell 1000 Value Index measures the performance of the large-cap value segment of the U.S. equity universe. It includes those Russell 1000 companies with lower price-to-book ratios and lower expected and historical growth rates.
S&P 500: The S&P 500 Index, or the Standard & Poor’s 500 Index, is a market-capitalization-weighted index of the 500 largest publicly-traded companies in the U.S.
VIX: The VIX Index is a calculation designed to produce a measure of constant, 30-day expected volatility of the U.S. stock market, derived from real-time, mid-quote prices of S&P 500® Index (SPX℠) call and put options.
Z-Score: A Z-score (also called a standard score) gives an idea of how far from the mean a data point is. It is a measure of how many standard deviations below or above the population mean a raw score is.
IMPORTANT DISCLOSURES
The views and opinions included in these materials belong to their author and do not necessarily reflect the views and opinions of NewEdge Capital Group, LLC.
This information is general in nature and has been prepared solely for informational and educational purposes and does not constitute an offer or a recommendation to buy or sell any particular security or to adopt any specific investment strategy.
NewEdge and its affiliates do not render advice on legal, tax and/or tax accounting matters. You should consult your personal tax and/or legal advisor to learn about any potential tax or other implications that may result from acting on a particular recommendation.
The trademarks and service marks contained herein are the property of their respective owners. Unless otherwise specifically indicated, all information with respect to any third party not affiliated with NewEdge has been provided by, and is the sole responsibility of, such third party and has not been independently verified by NewEdge, its affiliates or any other independent third party. No representation is given with respect to its accuracy or completeness, and such information and opinions may change without notice.
Investing involves risk, including possible loss of principal. Past performance is no guarantee of future results.
Any forward-looking statements or forecasts are based on assumptions and actual results are expected to vary from any such statements or forecasts. No assurance can be given that investment objectives or target returns will be achieved. Future returns may be higher or lower than the estimates presented herein.
An investment cannot be made directly in an index. Indices are unmanaged and have no fees or expenses. You can obtain information about many indices online at a variety of sources including: https://www.sec.gov/fast-answers/answersindiceshtm.html or http://www.nasdaq.com/reference/index-descriptions.aspx.
All data is subject to change without notice.
© 2024 NewEdge Capital Group, LLC


