You know, for years, scientists have wondered, can you make grown men and women weep tears of joy by playing Tom Jones’ “It’s Not Unusual”? And the answer is yes, you can, as long as it is preceded by seven “What’s New Pussycat”’s.
–John Mulaney
John Mulaney’s stand-up bit about “the best meal he ever had in his life” is a side-splitting opus on the power of desensitization and conditioning.
It is better if you just watch it, but to set the scene: Mulaney and a friend buy 21 plays of Tom Jones’ “What’s New Pussycat” on a local diner’s jukebox. After the song incessantly plays, weighing on the nerves of their fellow diners, the duo planned a brilliant head fake reprieve: slipping in one “It’s Not Unusual” into the endless march of “Pussycats”.
That is when Mulaney discovers that grown men and women could “weep tears of joy” when hearing Sir Jones’ “It’s Not Unusual”, as long as it was preceded by the obnoxious annoyance of seven “What’s New Pussycat”’s. Of course, when the “Pussycats” kick back in, the diner erupts in angered exasperation and the jukebox is eventually unplugged.
We think this is a perfect parallel for today’s market response to tariff headlines and impacts, answering the question: can you make grown men and women (and equities) weep tears of joy by implementing the highest tariff rates since the 1930s Smoot-Hawley? The answer is yes, you can, as long as it is preceded by the threat of incredibly high, onerous tariffs.
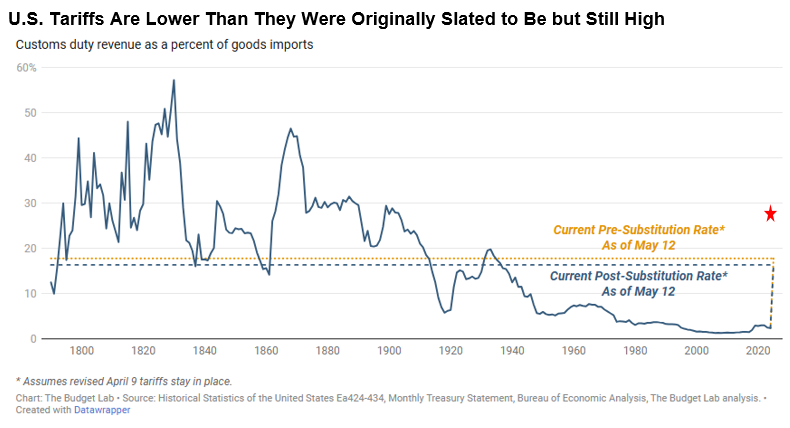
The reality is that today’s current tariff rate, reflecting the various “pauses”, still rests at 17.8%, a level far higher than the “worst case scenario” of most forecasters coming into the year. Even after accounting for some expected substitution away from Chinese imports, tariffs are still being assessed at their highest rate since the Great Depression.
Let’s start with the good news. This lower tariff rate is far less likely to trigger an outright recession on its own compared to the prior set of rates, which would have averaged out to about 28%, following the April 9th revision to the Rose Garden tariffs (the red star on the graph above).
The bad news is we do still expect current tariffs to have real impacts on both growth and inflation in the coming months. In fact, as we’ll detail below, we may already be seeing some of the effects.
Further below, we will assess the equity market’s “tears of joy”, as it rockets higher on trade “deal” optimism, looking at the tailwinds and headwinds for the near term path of US equities.
The big question is if markets will erupt in exasperation if a proverbial “What’s New Pussycat” comes back on the jukebox, meaning will we see another bout of volatility as the reality of weakening hard data due to still-high tariffs starts to materialize? Or will investors look through any hard data impacts to tariffs, effectively unplugging the jukebox so they can be spared from more of Sir Jones’ crooning. This is the question for the summer months ahead.
Outlook for Tariffs
Market optimism has certainly turned higher, in part, due to the promise of imminent trade deals with countries other than China. The first such deal reached with the U.K. was light on substance but delivered with a large splash, and we expect more such rollouts in the coming weeks.
What should concern investors, however, is that while these deals seem to ensure, for now, that reciprocal tariffs do not return to their Liberation Day levels, countries may be unable to negotiate away the permanence of the 10% global tariff on U.S. imports. And countries that do not strike deals in time to meet the 90-day deadline may find their exports to the U.S. assessed according to the infamous Rose Garden chart.
Finally, Some Signs of Tariffs in the Hard Data
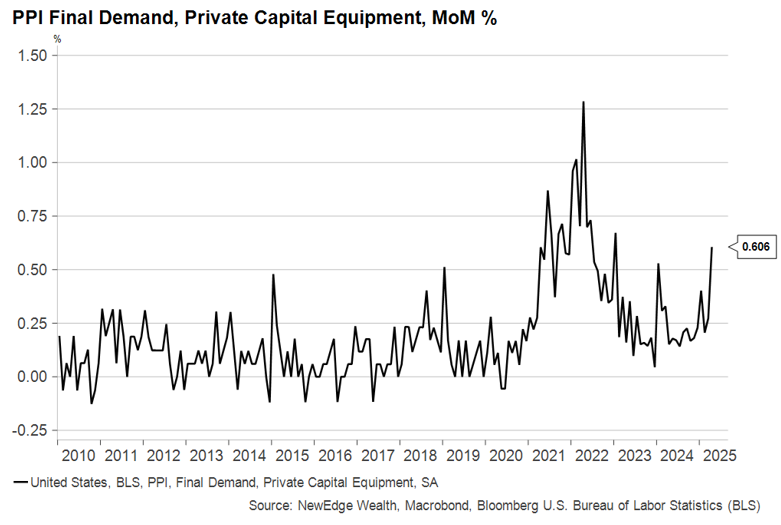
The grains of sand that tariffs have thrown into U.S. economic gears showed up last week in U.S. inflation data, though not in the consumer report, as many had anticipated. The Producer Price Index (PPI) provides prices on transactions made between businesses as well as estimates of profit margins. In April, prices rose while margins shrank on the categories most affected by tariffs.
Prices for finished capital goods rose by 0.6%, their largest monthly increase since the supply chain bottlenecks that formed after the COVID pandemic:
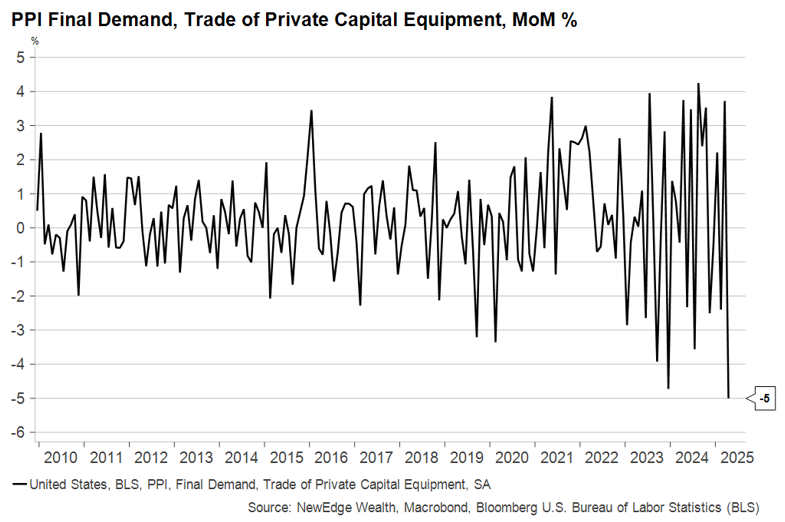
While this may represent just the tip of the iceberg for the inflation impact to come, it could also have been a lot worse had companies fully passed on their cost increases to customers. Trade in capital equipment, which measures profit margins for wholesalers and retailers on their finished capital goods sales, plunged by the most ever in a single month:
The story in consumer goods is directionally similar, but not as great in magnitude yet. Firms are more reluctant to raise prices on consumers than they are on other businesses, for now. But the bulk of the tariffs had only been in effect for a matter of weeks when this data was collected, meaning this data does not reflect the full impact of today’s tariff rates.
Further, as we heard from Walmart this week, saying that price increases were on the horizon for products in its stores, there remains a significant delay in how stated tariffs work their way through business and consumer data.
Just as the Soft Data Turns…Higher?!
The tragicomedy of U.S. survey data took another absurd turn this week, even as the first signs of higher prices and squeezed margins showed up in the PPI. The Philadelphia Fed Business Outlook, which tends to capture manufacturing sentiment early in the supply chain, surged out of deep recession territory to a much more optimistic outlook in the May reading:
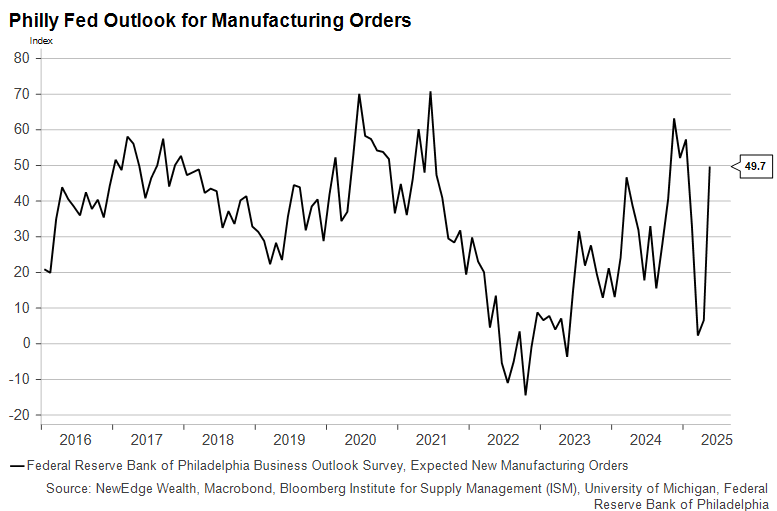
The pause in the bulk of U.S.-China tariffs undoubtedly had something to do with it. And if this index lives up to its reputation as a leading indicator of leading indicators, we may begin to see other “soft” data pull back from the abyss they had been staring into since Liberation Day.
It should be noted that markets and growth forecasts never priced in the full extent of the deterioration in soft data we saw in April (a lesson learned from misleading soft data in the post-COVID era?), so the sharp rebound in soft data may not spark big upward revisions to forecasts either.
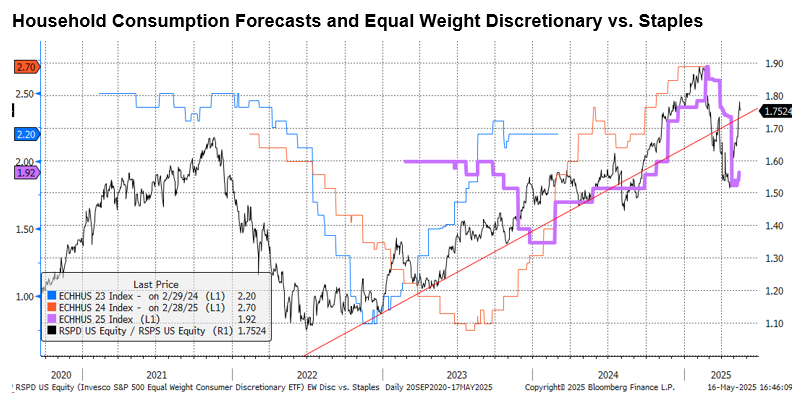
That being said, we did see Household Consumption forecasts tick back higher this week, as shown in the purple line below, following the rebound in the important Equal Weight Discretionary vs. Staples ratio (which has been a helpful signal about how the equity market views the health of the US consumer).
Tailwinds and Headwinds for Equities
This brings us to our assessment of the US equity market. In just over a month, the S&P 500 has soared an impressive 20.25% from its April closing low, bringing the index above its 200-day moving average and defying many expectations that the rally in shares would stall.
Below, we provide a ledger of the tailwinds and headwinds for equities, but we would like to highlight one vitally important factor: positioning.
Despite the massive rally, we still find measures of institutional investors’ equity positioning to be “light”/underweight/short equities, meaning that many institutional investors have sat on the sidelines as the equity market has ripped higher. As of May 12, the Goldman Sachs Positioning Indicator was still 1.5 standard deviations below average, indicating an underweight allocation to equities. As of May 5, the Deutsche Bank Consolidated Positioning Indicator was still in just the 12th percentile. Other measures like Bloomberg’s Hedge Fund Sensitivity to equities, shown below with commentary from the Daily Shot, indicate that many hedge funds are still underweight stocks.
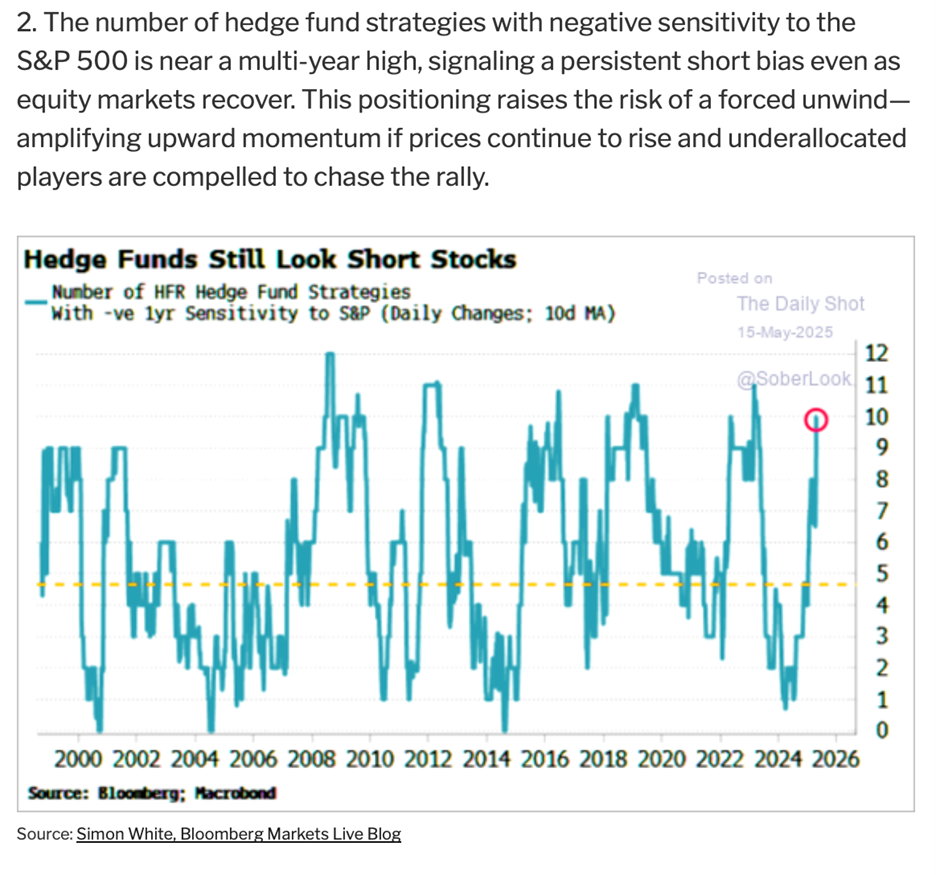
This data is inherently lagging, and some of it is clearly stale, so we look to next week’s updates to get a sense of how much investors have chased this market higher. However, we think the degree to which institutional investors remained underweight equities off the April lows helps to explain the power of the rally we have seen and why it has been able to shake off any hints of bad news, as investors clamor to get back in.
Speaking of clamoring to get back in, this brings the good news for the equity market. In addition to the light institutional positioning that could drive shares higher in the short term, we also saw a “breadth thrust” on Monday of this week that showed investors racing to get exposure after the China tariff relief.
As technical analysis greats like Jeff DeGraff have noted, historical forward returns for equities have been above average after seeing readings of the percentage of names at 20-day highs go over 50%. This signal triggering on Monday suggests a falling probability that a retest of the April lows is experienced, though we would note that there have been exceptions to this rule (such as the breadth surge experienced last July that has been followed by 10 months of effectively flat equities).
We also note in the positive camp that high yield spreads continue to contract, showing signs of growth fears abating, along with the better pro-cyclical stock performance shown above with Discretionary vs. Staples.
Similar to this last point is the pro-risk outperformance of high beta stocks, including the IPO index, which is up over 40% from the April lows. The outperformance of recently IPO’s stocks has often helped to embolden the return of IPO considerations for companies that have been sitting on the sidelines.
And now for the headwinds (you can imagine the opening notes of “What’s New Pussycat” as background for this section!).
As markets have rallied robustly, it has been entirely driven by PE multiple expansion. The valuation of the S&P 500 now sits at 21.7x forward earnings, a level that is just shy of the 22.6x forward peak in late 2024 when the “American Exceptionalism” narrative was at its peak, Trump was expected to deliver only pro-business policies, and DeepSeek had not threatened the US AI dominance. We do think this late 2024 peak could act as a ceiling for valuations, given the current backdrop of heightened policy uncertainty and falling/slowing growth estimates.
On growth estimates, we are continuing to see EPS estimates get cut for both 2025 and 2026 as corporate earnings are calibrated for the new economic reality. Both years’ EPS estimates have been trimmed by about 5% from their recent peaks, with further downside to estimates highly dependent on how the current tariff floor rates impact demand and margins.
The last important watch item is the long yields, which had crept back towards April highs earlier in the week on the tax bill negotiations and fading growth fears. Yields that press above 4.5% on the 10-year and 5% on the 30-year could prove to be a formidable opponent for equities trading at these valuations.
Conclusion
We think the “pain trade” could still be higher for equities in the near term, given how light positioning remains, but could see strength fade in the summer months as valuations hit a ceiling and EPS estimates continue to fade as the tariff realities set in to the hard data. Given the degree of underweight positioning, we don’t rule out a retest of the prior highs, but we see the risk reward fading for new capital as this positioning tailwind begins to fade and the economic reality of slowing growth and higher inflation begins to threaten the peace of relieved markets (much like a teenager standing in front of a jukebox armed with a fistful of dollar bills).
IMPORTANT DISCLOSURES
The views and opinions included in these materials belong to their author and do not necessarily reflect the views and opinions of NewEdge Capital Group, LLC.
This information is general in nature and has been prepared solely for informational and educational purposes and does not constitute an offer or a recommendation to buy or sell any particular security or to adopt any specific investment strategy.
NewEdge and its affiliates do not render advice on legal, tax and/or tax accounting matters. You should consult your personal tax and/or legal advisor to learn about any potential tax or other implications that may result from acting on a particular recommendation.
The trademarks and service marks contained herein are the property of their respective owners. Unless otherwise specifically indicated, all information with respect to any third party not affiliated with NewEdge has been provided by, and is the sole responsibility of, such third party and has not been independently verified by NewEdge, its affiliates or any other independent third party. No representation is given with respect to its accuracy or completeness, and such information and opinions may change without notice.
Investing involves risk, including possible loss of principal. Past performance is no guarantee of future results.
Any forward-looking statements or forecasts are based on assumptions and actual results are expected to vary from any such statements or forecasts. No assurance can be given that investment objectives or target returns will be achieved. Future returns may be higher or lower than the estimates presented herein.
An investment cannot be made directly in an index. Indices are unmanaged and have no fees or expenses. You can obtain information about many indices online at a variety of sources including: https://www.sec.gov/answers/indices.htm.
All data is subject to change without notice.
© 2026 NewEdge Capital Group, LLC