


Oh no buddy, no need to be concerned with this
Emotional haircut
It’s part of the game
Yeah man, it’s just part of the feat
“Emotional Haircut”, LCD Soundsystem
With Thanksgiving next week, it is incredible that the 2025 holiday season is already upon us (time flies when you live in interesting times).
This season typically ushers in two great things about which to be excited: a Santa Claus rally for risk assets and LCD Soundsystem’s annual NYC residency. The latter reliably kicks off this weekend, replete with disco balls and cow bells, but the former, a strong rally to end the year, is feeling more distant after recent volatility.
November’s unseasonable weakness reminds us of the LCD deep cut from their 2017 american dream album, “emotional haircut” (very rarely played live, but to evoke singer James Murphy in the song “Losing My Edge”, this author can proclaim “I was there!” the last time they did in 2022).
After a truly ebullient September and October, where “Chicken Fried”, “Silly” stocks experienced significant rallies, this “emotional haircut” to sentiment and risk appetite should be seen as a healthy and welcome development for the durability of this bull market.
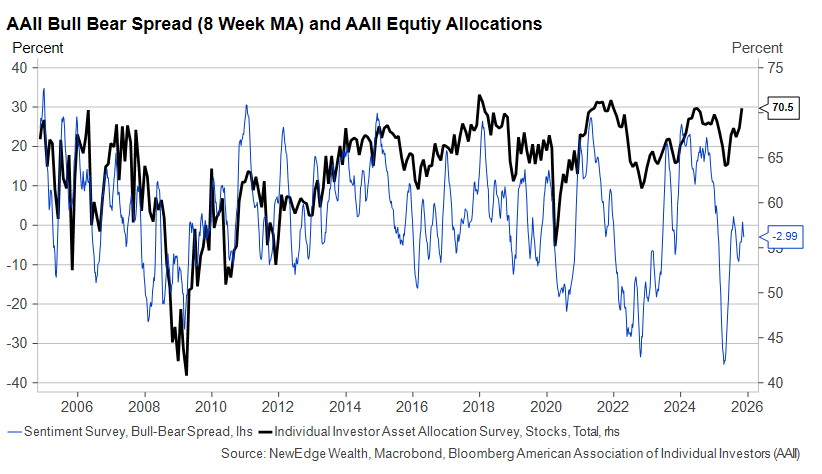
Nowhere did sentiment and risk become more stretched and subject to an “emotional haircut” than in the household/retail investor cohort. As shown below, metrics like FINRA margin loan balances growing at a faster pace over the last six months than in 2020 when rates were 0%, or household equity allocations returning to prior peaks in the AAII survey, were a flashing light that retail sentiment and risk appetite had grown frothy.

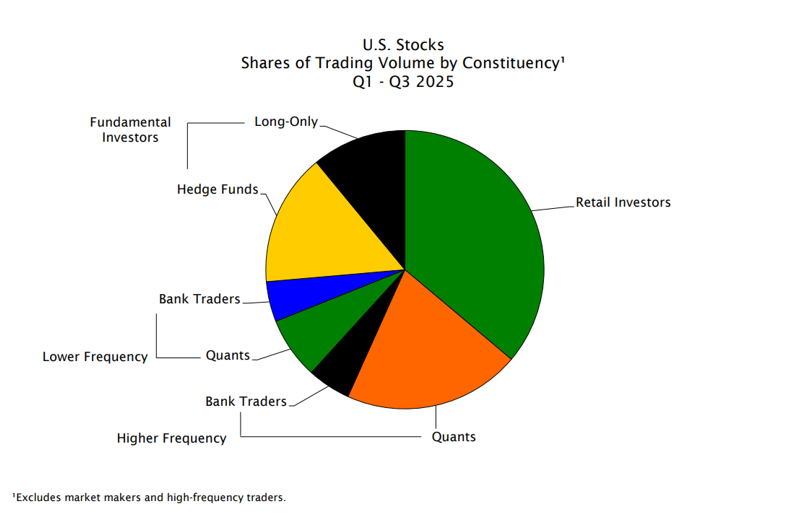
A reasonable question in response to this is: just how important are retail investors to the U.S. equity market? It turns out that the answer in 2025 is very important, as seen in the Empirical Research Partners’ analysis of trading volume this year, with retail investors acting as the largest source of trading volume in the market!
This “all-in” nature of retail positioning is contrasted with institutional investors that still just remain in the “neutral” camp, as measured by the Deutsche Bank Consolidated Equity Positioning shown below in just the 47th percentile in data going back to 2010.

So the next major question is: how long and far will this corrective episode, or this “emotional haircut”, go? And this is where we turn to market technicals in order to remove the narrative and emotion (be like James Murphy once again singing “Now I ain’t Dionysian, man”) in order to get a sense of the different paths the market could take into year-end.
“Cause I got eyes going every which way”: Looking for Support
The good news, as of writing on late Friday afternoon, is that the S&P 500 appears to have found its footing at its 100-day moving average, which also corresponds roughly to the starting point of the “silly” September-October run in markets.
It will be important to watch over the next week (which will have lighter trading volumes thanks to the Thanksgiving holiday), to see if the S&P 500 can maintain this 100-day support. A break below could put the 200-day moving average in play (~6100, which is also the February, pre-liberation high). This would represent an ~11% peak-to-trough correction for the S&P 500. If the market were to experience a correction of this magnitude, it would likely be accompanied by alarming headlines; however, it is important to remember that, historically, forward returns following 10%+ drawdowns did drastically improve (READ THIS).

Turning back to this week, the S&P 500 did not get fully oversold on an external basis (as seen with the relative strength index above) or an internal basis (as seen in breadth measures like the % of names above their 50 day moving average below) during its Thursday swoon, but this isn’t necessary to find a near term bottom (just noting that the odds of better forward returns do move higher when these measures do hit oversold extremes, like they did back in April).
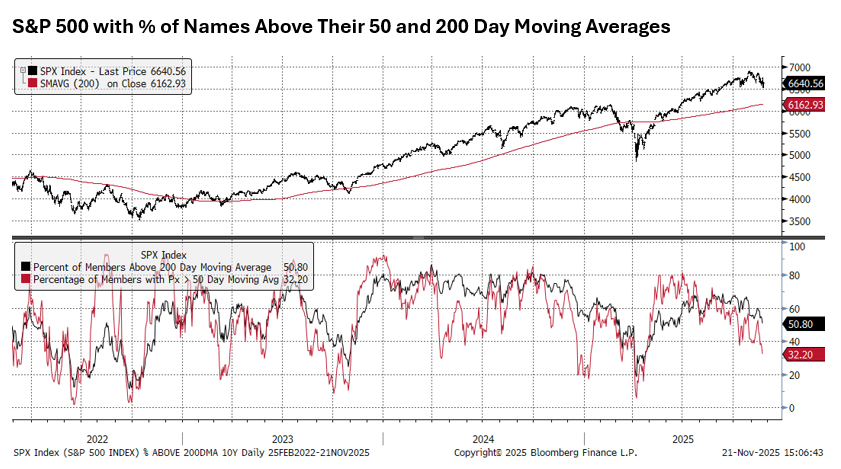
Note in the chart above that the number of names above their longer-term 200-day moving average has now dropped to just 50%, which means that there has been significant trend deterioration in half of the S&P 500, even as the broader market was making new highs. You can see this is a glass half empty (the market is weaker under the surface!) or a glass half full (opportunities have been created for active selection!).
“It ain’t a disease, it’s just harder to do whatever you please”: Longer Term Technicals
There are a few longer-term metrics that must be monitored closely, as they suggest that there has been deterioration in the markets’ longer-term breadth and momentum, which could be a harbinger of continued choppy trading.
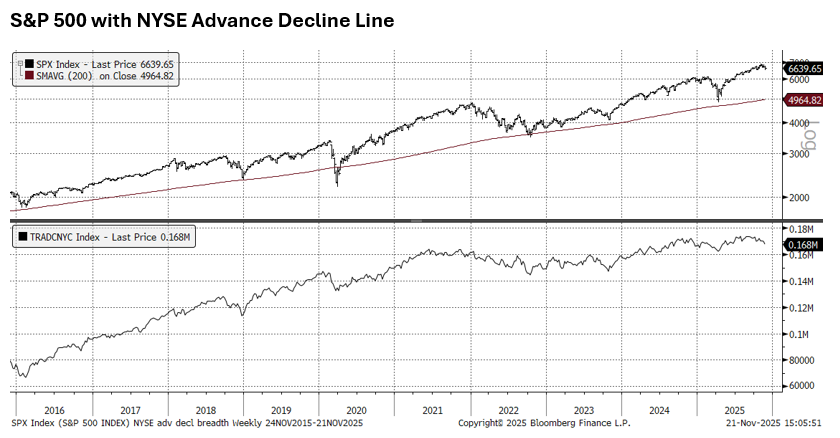
This is where we are grateful for the technical prowess and wisdom of 22V’s John Roque, who poignantly wrote on Thursday evening in analyzing the deterioration in the NYSE’s cumulative volume and cumulative breadth measures that “nobody makes money on the long side consistently when these lines move lower”. Below, we show a version of this with the NYSE’s Advance Decline Line moving lower.
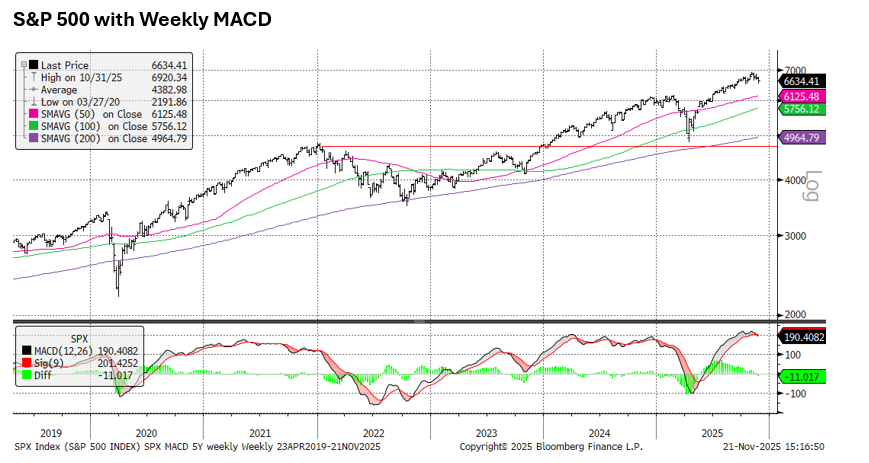
Mr. Roque also flagged the weekly Moving Average Convergence Divergence (MACD) turning negative for the first time since the April lows, suggesting that this era of ultra calm, up-and-to-the-right markets may be replaced by a choppier market experience.
“Now we all get ideas, I know I should shut em down with the emotional haircut”: Conclusion
There are five weeks left in the year (but only three weekends of LCD Soundsystem residency, FYI), so a lot can still happen in markets into year-end. We are encouraged by Friday’s price action off of support but balance this encouragement with awareness that there has been deterioration in the market’s trend and momentum.
The reason for showing these technical measures is to remove emotion out of decision making during times of volatility. Back in March, we wrote about the power of using fear as a tool (and it was a TOOL themed piece) to help us make better decisions, arguing that fear on an individual basis can be paralyzing and lead to poor decisions (selling at lows), while fear when measured in aggregate can be illuminating and lead to powerful decisions (allocating capital to equities when forward returns improve near lows).
We do not have a crystal ball (or even a disco ball like LCD!), but we hope to use these measures in order to drive rational decision making in the short term, which allows for maintaining the course for long-term investment strategies.
IMPORTANT DISCLOSURES
The views and opinions included in these materials belong to their author and do not necessarily reflect the views and opinions of NewEdge Capital Group, LLC.
This information is general in nature and has been prepared solely for informational and educational purposes and does not constitute an offer or a recommendation to buy or sell any particular security or to adopt any specific investment strategy.
NewEdge and its affiliates do not render advice on legal, tax and/or tax accounting matters. You should consult your personal tax and/or legal advisor to learn about any potential tax or other implications that may result from acting on a particular recommendation.
The trademarks and service marks contained herein are the property of their respective owners. Unless otherwise specifically indicated, all information with respect to any third party not affiliated with NewEdge has been provided by, and is the sole responsibility of, such third party and has not been independently verified by NewEdge, its affiliates or any other independent third party. No representation is given with respect to its accuracy or completeness, and such information and opinions may change without notice.
Investing involves risk, including possible loss of principal. Past performance is no guarantee of future results.
Any forward-looking statements or forecasts are based on assumptions and actual results are expected to vary from any such statements or forecasts. No assurance can be given that investment objectives or target returns will be achieved. Future returns may be higher or lower than the estimates presented herein.
An investment cannot be made directly in an index. Indices are unmanaged and have no fees or expenses. You can obtain information about many indices online at a variety of sources including: https://www.sec.gov/answers/indices.htm.
All data is subject to change without notice.
© 2026 NewEdge Capital Group, LLC

