


You were the best thing in my life
I can recall you and me we had it all
I know that we can never live those times again
So I let my dreams take me back
“We Had it All”, Waylon Jennings
No genre of music captures longing for the past better than classic country. And no country music singer evokes this yearning for the way things were better than Mr. Waylon Jennings.
The king of the “outlaw movement” in country music in the 1970s, Waylon Jennings’ provides an apt soundtrack for how equity investors are looking at today’s market and (Georgia) pining for what used to be.
Over the last three years, equity investors could sing “We Had It All” when it came to tailwinds for markets. The combination of an uptrend in earnings growth forecasts and a downtrend in 2 Year Treasury yields was incredibly powerful for risk asset returns.
Looking at these two components, the uptrend in earnings growth forecasts supported risk appetite, and thus valuations, while rising estimates also boosted total equity market returns as earnings growth consistently surprised to the upside.
2 Year Treasury yields being in a downtrend reflected expectations for Fed rate cuts as inflation receded. This expectation for easier monetary policy provided liquidity support to markets and helped to keep equity and credit market valuations near record highs/tights, even when the growth outlook got muddied at various times.
Investors really did “have it all”: stronger growth and policy support. True halcyon days for equity and credit market investors.
The chart below shows this dynamic, where you can see the 2023-2025 backdrop of falling yields and rising EPS forecasts, which contrasts with the 2022 backdrop of rapidly rising rates and falling EPS forecasts. Investors can certainly remember the stark contrast in equity market returns between 2023-2025 (which were strong) and 2022 (which was weak).
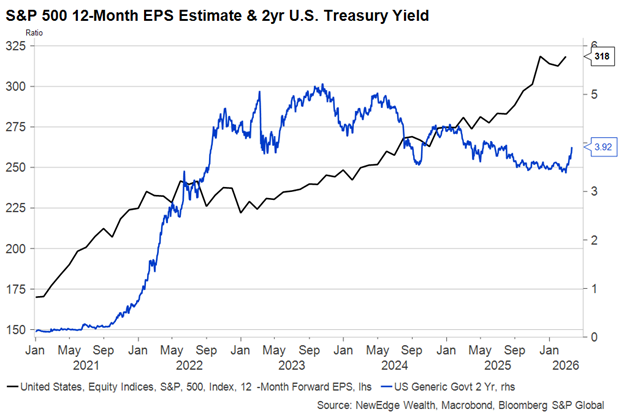
As of 3-20-26
Now that we are in 2026, these tailwinds from the last three years are starting to become just a memory, like Mr. Jennings singing “I can hear the wind a blowing in my mind, just the way it used to sound through the Georgia pines”.
Let’s unpack how these winds have shifted, starting with yields and then growth forecasts. We will conclude the piece with a slice of good news, which is that markets did get oversold on Friday. These contrarian technical signals are a helpful tool to take the emotion out investment decision-making when market volatility, and thus market emotion, spikes.
“Oh it Was So Good, Oh it Was So Good”: Good News Cuts Are Gone
Looking at yields, this year we have seen short term yields vault higher, pricing out Fed cuts as rising oil prices create an inflationary impediment to further central bank easing. The chart below shows the breakneck ascent of 2 Year Treasury yields which are reflecting expectations for not just a lack of rate cuts but even potential rate hikes.
US 2 Year Treasury Yield
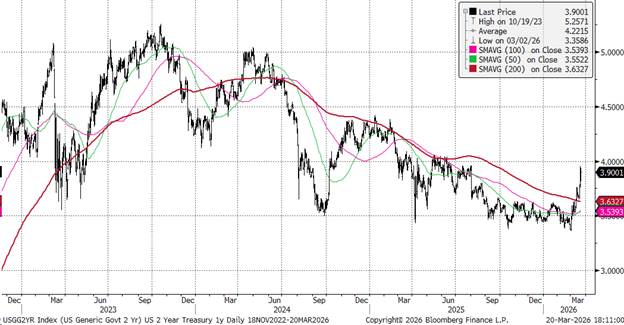
Source: Bloomberg, NewEdge Wealth, as of 3-20-26
The table below is a screen shot of the Bloomberg World Interest Rate Probability screen, which shows the market’s pricing of what it expects from the Fed. In the 10/28/26 line, you can see that as of the close on Friday, the bond market was pricing in a 37% chance of a cut by October.
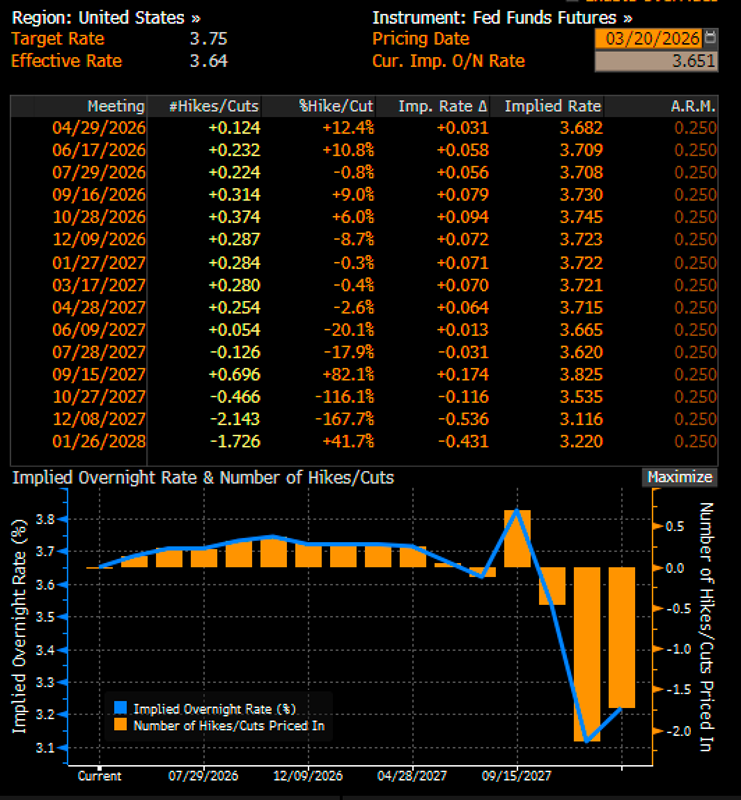
Source: Bloomberg, as of 3-20-26
We think this pricing of Fed hikes is aggressive, mostly because we would see a sustained higher oil price scenario as having deleterious effects on growth as it pushes up inflation. Given the Fed’s dual mandate for stable prices (inflation) and full employment, if energy prices do remain elevated, the Fed will have to choose between fighting an exogenous supply shock that pushes up inflation and supporting a flagging employment backdrop, as the demand destruction from higher energy prices ripple through the economy.
The scenario where the Fed would be hiking would likely require sustained high oil prices that metastasizethrough the economy, pushing up inflation for other goods and services, while also seeing a resilient jobs market that would allow the Fed to prioritize the inflation fight over needed support for employment (this was the 2022 scenario, where inflation was elevated but job additions were running at 200k+ a month).
Given the moderation in job growth that we have seen over the last year, we do not see the jobs market as a source of inflation (through wages) nor do we see it as stable enough to withstand a shift to hikes by the Fed. Talk about a pickle if inflation remains elevated.
All of this should be a wakeup call to markets that the days of “good news rate cuts”, or cutting rates in an environment of stable growth, are firmly behind us (recall that the Fed has cut rates by 150 bps points over the last two years, all the while US GDP and corporate earnings growth was revised higher).
Instead, we think that a higher, stickier inflation environment suggests that rate cuts that we could get in the near future would be “bad news rate cuts”, meaning they would come along with job losses and expectations for weaker growth, which bring us to our next section on growth forecasts.
“I’ll Never Stop Believing in Your Smile”: Growth Forecasts Have Been Remarkably Resilient (Or Complacent?)
Despite the volatility in global equity, fixed income, and commodity markets, analysts have remained remarkably steadfast in their expectations for strong growth in 2026 and 2027.
The chart below shows how earnings per share (EPS) estimates for the S&P 500 in 2026 and 2027 have actually been revised higher in the past month, with EPS growth still expected to be in the mid-teens this year and next. This is a stark contrast to 1Q and 2Q in 2025, as the tariff shock drove analysts to rapidly slash earnings forecasts.
S&P 500 Price and EPS Estimates for 2026 and 2027
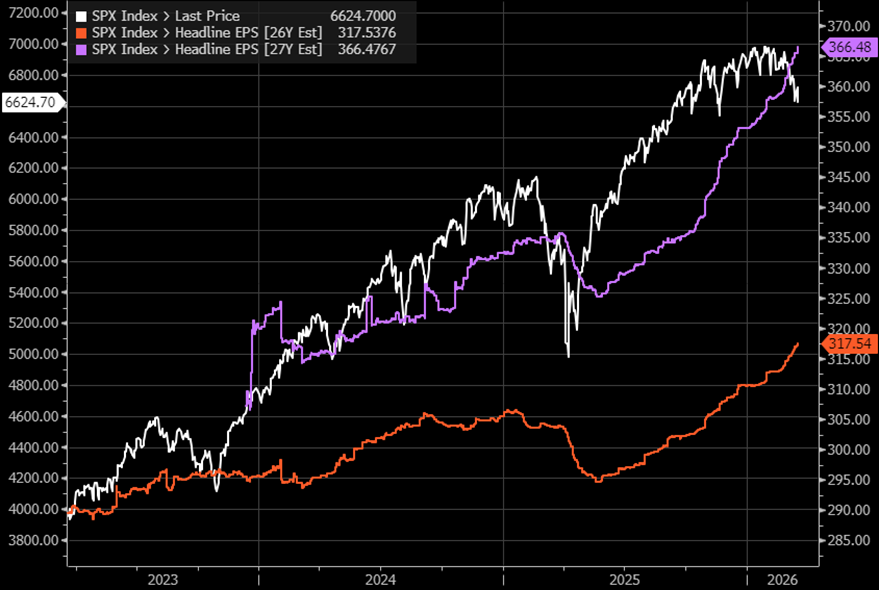
Source: Bloomberg, NewEdge Wealth, as of 3-20-26
We can see a similar dynamic with GDP forecasts, with the chart below showing 2026 GDP estimates remaining resilient at 2.5%. Unlike early 2025, analysts are not responding to today’s uncertainty by cutting growth forecasts yet.
2026 US Real GDP Consensus Growth Forecast
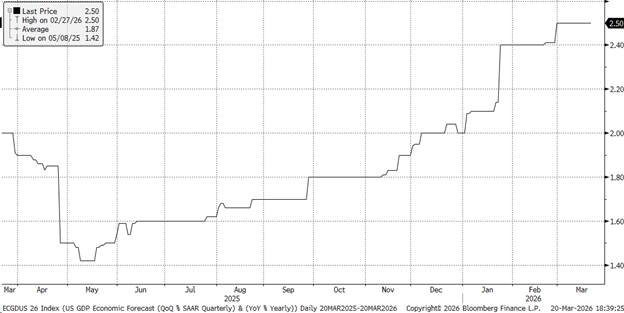
Source: Bloomberg, NewEdge Wealth, as of 3-20-26
This brings us to our question as to whether or not these stable growth forecasts are a sign of resilience or complacency.
Clearly, analysts are hoping and wishing that this conflict will be short-lived, with an imminent, TACO-flavored de-escalation just around the corner.
Further, analysts have arguably been burned in recent years by cutting growth forecasts too resolutely, whether it was in 2022 after Fed rate hikes, 2023 after the regional bank melt-down, or 2025 after Liberation Day. After each of these events, analysts were forced to chase growth statistics higher as the US economy proved to be more resilient than the dire forecasts had contemplated. Importantly, this chasing and raising of forecasts to a more resilient reality was a powerful tailwind to equity and credit markets, which enjoyed the backdrop of positive estimate revisions.
Today, analysts “holding the line” in the face of record energy production and transportation disruption is a risky game. In our view, we think these forecasts for GDP and EPS growth are too high if the current level of oil prices is sustained or worse, pushed higher.
If EPS and GDP estimates do begin to be revised lower, we would see this as a more challenging backdrop for equity and credit markets, which have typically struggled in environments where growth forecasts were falling (remember that markets will lead these fundamental trends, as markets will often peak and trough before fundamentals have their corresponding peaks and troughs). Once again, gone are the “we had it all” days.
“And You Were There to Answer When I Called”: Conclusion
Overall, we see this combination of higher yields (or at least yields not being in a clear downtrend anymore) and a potentially lower growth outlook as being a more challenging backdrop for equities, which could suggest further volatility as the process of estimate cuts begins.
But before we leave you with a message about continued volatility, we must call upon our dispassionate technicals to highlight that markets did get oversold on Friday. Thus, even if volatility continues and Friday’s close does not prove to be the ultimate low, when equity markets become oversold in this fashion, we could see longer-term (12-month plus) forward returns start to improve.
Friday’s statistics do not show a full “flush” in markets or as deep of an oversold condition like we saw in April of last year, but these measures, such as the Relative Strength Index and the % of names at 20 day lows, and % of names above their 50 day moving average, all shown below, are elevated/depressed enough to suggest that forward returns could improve.
This is a great time to remind ourselves of the wise words of the great Walter Deemer who wrote: “When The Time Comes to Buy, You Won’t Want To”. Market environments like this can stir up emotions like fear and panic, but it is technical tools like this that can empower us to make rational decisions even in the face of elevated uncertainty.
S&P 500 With Daily Relative Strength Index
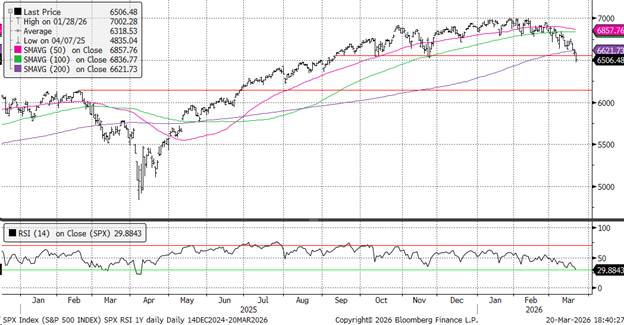
Source: Bloomberg, NewEdge Wealth, as of 3-20-26
S&P 500 With % of Names at 20 Day Lows
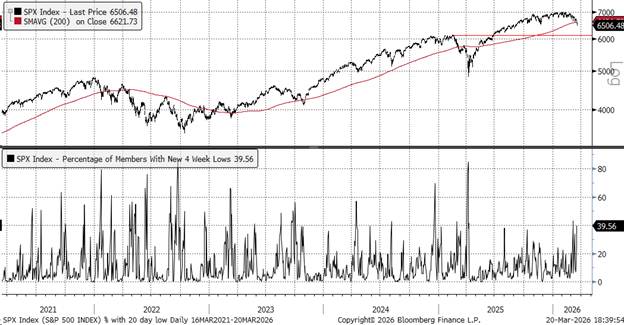
Source: Bloomberg, NewEdge Wealth, as of 3-20-26
S&P 500 With % of Names Above Their 50 Day Moving Average

Source: Bloomberg, NewEdge Wealth, as of 3-20-26
IMPORTANT DISCLOSURES
The views and opinions included in these materials belong to their author and do not necessarily reflect the views and opinions of NewEdge Capital Group, LLC.
This information is general in nature and has been prepared solely for informational and educational purposes and does not constitute an offer or a recommendation to buy or sell any particular security or to adopt any specific investment strategy.
NewEdge and its affiliates do not render advice on legal, tax and/or tax accounting matters. You should consult your personal tax and/or legal advisor to learn about any potential tax or other implications that may result from acting on a particular recommendation.
The trademarks and service marks contained herein are the property of their respective owners. Unless otherwise specifically indicated, all information with respect to any third party not affiliated with NewEdge has been provided by, and is the sole responsibility of, such third party and has not been independently verified by NewEdge, its affiliates or any other independent third party. No representation is given with respect to its accuracy or completeness, and such information and opinions may change without notice.
Investing involves risk, including possible loss of principal. Past performance is no guarantee of future results.
Any forward-looking statements or forecasts are based on assumptions and actual results are expected to vary from any such statements or forecasts. No assurance can be given that investment objectives or target returns will be achieved. Future returns may be higher or lower than the estimates presented herein.
An investment cannot be made directly in an index. Indices are unmanaged and have no fees or expenses. You can obtain information about many indices online at a variety of sources including: https://www.sec.gov/answers/indices.htm.
All data is subject to change without notice.
© 2026 NewEdge Capital Group, LLC

