


You inched yourself across the great divide
While we drove aimlessly along the Twin State line
-“The Great Divide”, Noah Kahan
We are not sure what has been more greatly anticipated about April: the end to a very long first quarter of trading and news flow, or the release of Noah Kahan’s upcoming fourth studio album, The Great Divide.
As we look at the charts and data in preparation for our 2Q26 Outlook next week, The Great Divide is a great way to describe some of the sharp divergences and departures we have seen over the last three months.
These great divides come in many varieties such as the gap between sentiment in physical oil markets and paper trading of futures, or the stability in long-run inflation expectations as near term inflation jumps, or resilient economic data despite tumultuous headlines, or the resilience of earnings estimates in the face of uncertainty, or the cratering of Mag 7 cash generation as earnings soar. Some of these great divides are encouragingly positive, while others are distinctly negative.
In this week’s Weekly, we will briefly look at each of these great divides, illustrated by some fascinating charts.
“How Unfair it Was to Stare Ahead Like Everything Was Fine”: Oil Markets
One of the greatest divides in markets over the last month has been how concerned oil market experts have been about the war in Iran and its degree on disruption/destruction to longer-term oil prices/infrastructure compared to the relative calm in oil futures markets.
The chart below shows how oil traders are still taking a sanguine outlook about how quickly the war can be resolved and how quickly oil flows can return to more normalized levels. As you can see, futures markets are expecting oil prices to fall meaningfully by September, with a return to the high end of the 2022-2024 range at $79 by December.
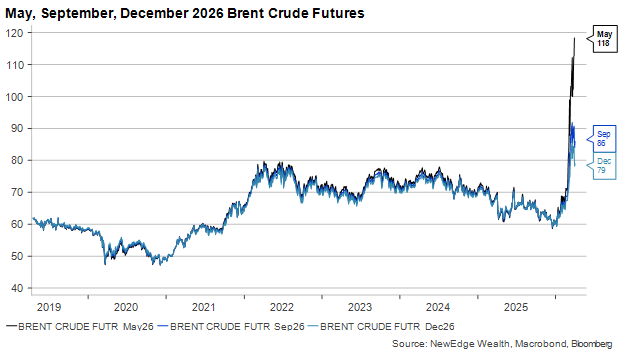
As of 4-2-26
As oil traders “stare ahead like everything is fine” (encouraging White House members to take solace in these benign expectations), the physical reality for raw crude and refined products appears to be far more concerning (such as Bloomberg’s Dylan Griffiths’ piece on energy infrastructure damage, this assessment of damage from the IEA, fuel shortages already biting in Australia, growing risk of jet fuel shortages, and energy rationing in Asia).
If the war continues, this great divide between paper optimism and physical fear will be closed, as paper markets will be forced to reprice to a more disrupted and destructed reality.
“But the World is Scared of Hesitating Things”: Long Run Inflation Expectations
For all the failures and frustrations, the Fed has had bringing inflation down over the past five years, they haven’t lost their credibility in the eyes of investors. Even with energy prices shooting higher and core PCE inflation already north of 3%, the bond market still believes the Fed will achieve its price stability mandate in the long run (we have been joking, “find someone to believe in you like the bond market believes in the Fed’s ability to achieve its inflation target”).
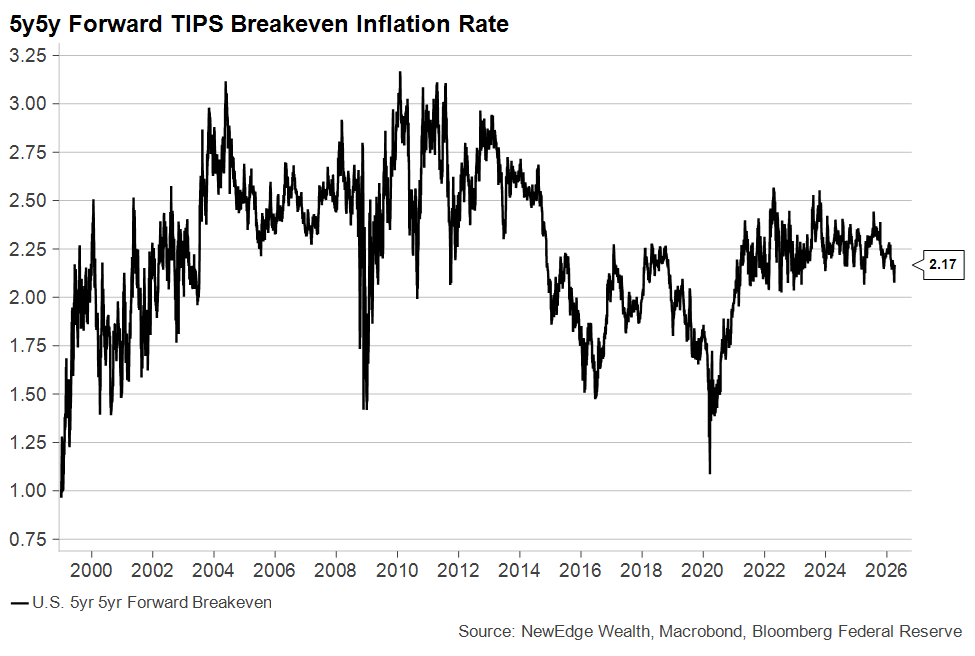
As of 4-2-26
The chart above shows how long-term inflation expectations are not only lower today than their average over the past 25 years, but how they have also been far more stable in the 2020s than they were in the prior decades. This is despite 5 years of inflation running above the Fed’s 2% target and unprecedented verbal and legal threats to the Fed’s independence (arguably if the bond market was truly concerned that a captured Fed would cut rates too much and stoke pernicious and persistent inflation, it is unlikely we would see market-based long-run inflation expectations remain so contained).
The chart below shows this great divide between short-term and long-term inflation expectations.
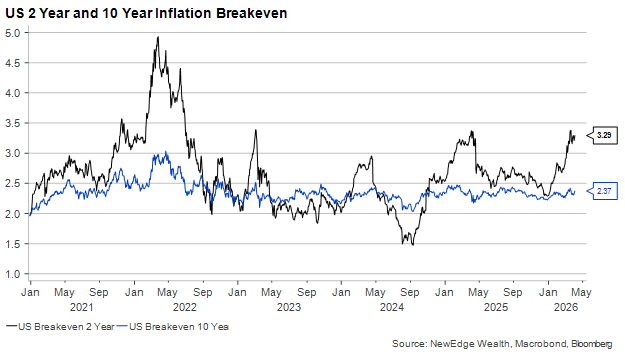
As of 4-2-26
“So I Tried to Read the Thoughts That You’d Worked Overtime to Stop”: Resilient Data, Even Sentiment
This is a positive great divide. For all the concern about demand destruction resulting from soaring energy prices, recent data updates have shown a degree of resilience that is impressive, though with a notable lag and questionable quality in areas.
The chart below shows the Bloomberg Economic Surprise Index (a measure of how much data is surprising expectations to the upside or downside), which has jumped higher in recent weeks thanks to data surprising to the upside (such as this Friday’s Nonfarm Payrolls showing 178k jobs added versus the 65k expected).
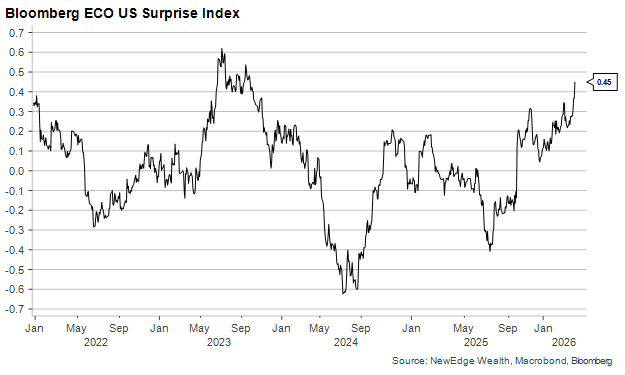
As of 4-2-26
Of course, some of this reflects data from before the war started and before energy prices jumped, but even recent and high-frequency data shows resilience.
The chart below shows how Conference Board Consumer Confidence actually ticked slightly higher in March, arguably off a low, sour base (consumers are clearly working overtime to stop negative thoughts about the economy).
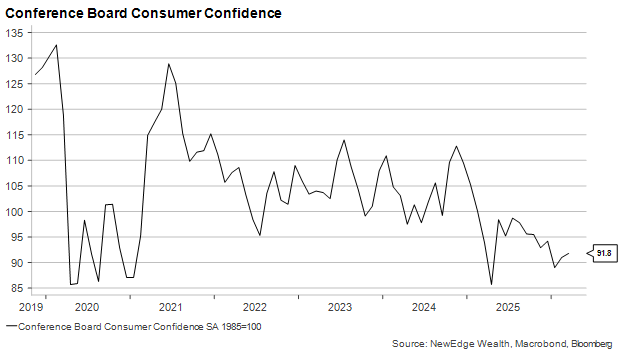
As of 4-2-26
The next chart shows how the Dallas Fed Weekly Economic Activity Index has remained resilient.
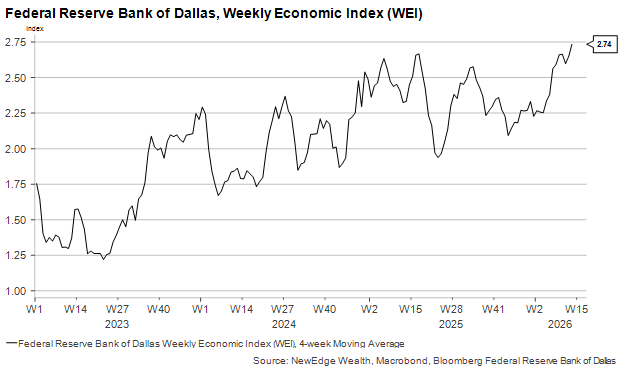
As of 4-2-26
Lastly, March 2026 payrolls showed the strongest gains in Manufacturing jobs since 2023. True, it was “only” 15K but the rate of decline in manufacturing payrolls had already begun to slow, something we could continue to see based on the last three strong months for the employment component of the ISM Manufacturing survey. The presence of the tariffs (and the doubts about when refunds may be arriving) is a persistent headwind to the sector, but *someone* has to be working in all the factories the U.S. has been building since 2022.
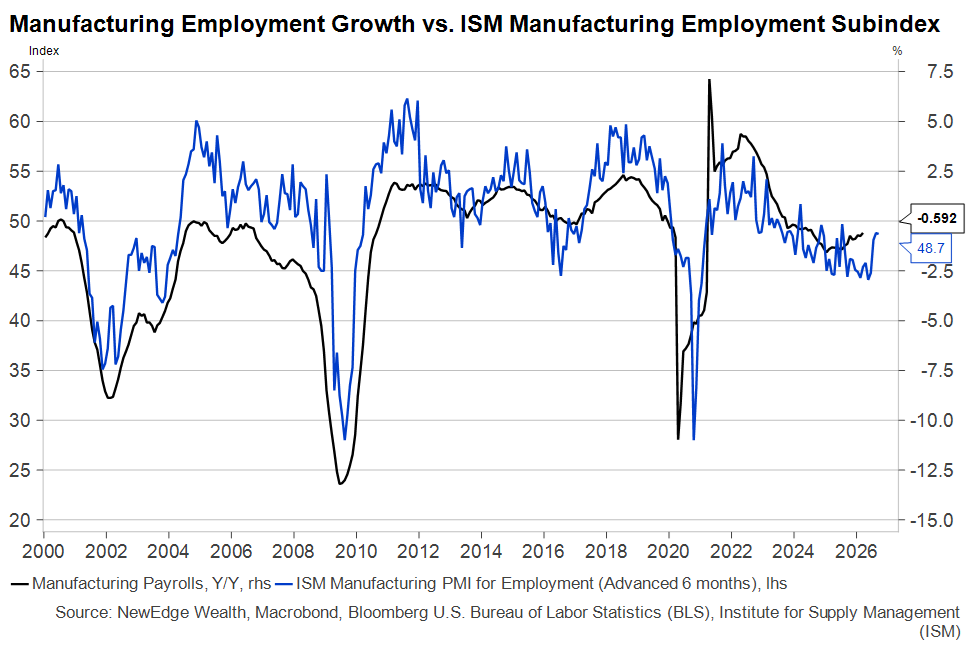
As of 4-2-26
“Did You Wish That I Could Know That You’d Fade to Some Place I Wasn’t Brave Enough to Go?”: EPS Estimates
Unlike Noah Kahan’s lack of bravery confession, analysts have been very brave in raising their forecasts for earnings despite all the uncertainty about the war and energy prices.
The chart below shows this incredible jump in EPS estimates for the S&P 500 in 2026 and 2027 over the last month.
S&P 500 Price and EPS Forecast 2025-2027
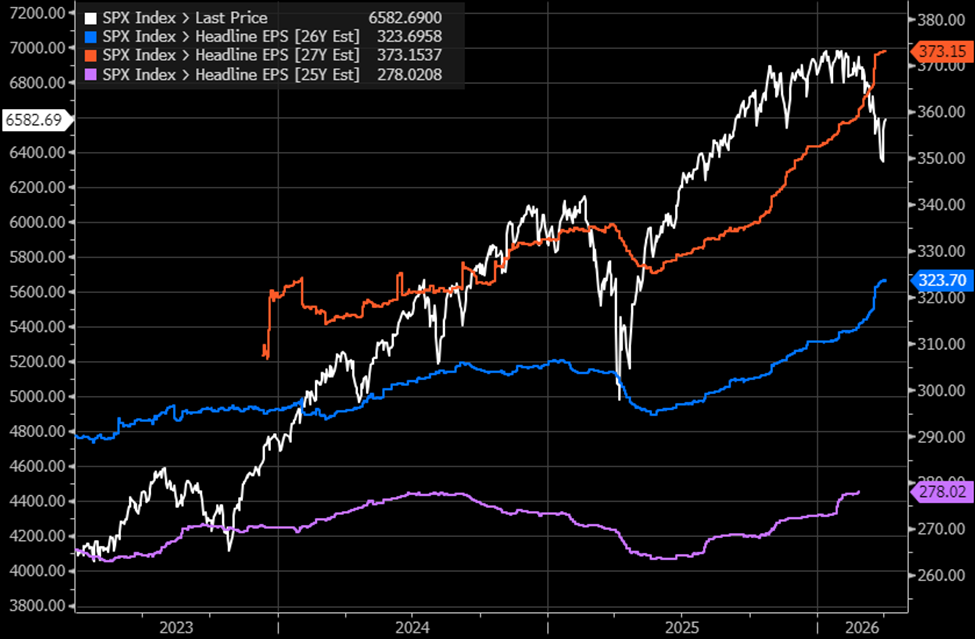
Source: Bloomberg, NewEdge Wealth, as of 4-2-26
Of course, a lot of this is due to semi-conductor EPS estimates soaring higher, as seen in the first chart below, but the second chart shows that even equal weight S&P 500 earnings have jumped higher as well. This contrasts with the tariff supply shock in 2025, where analysts were quick to cut forecasts.
SOX Semiconductor Index Price and EPS Forecast 2025-2027
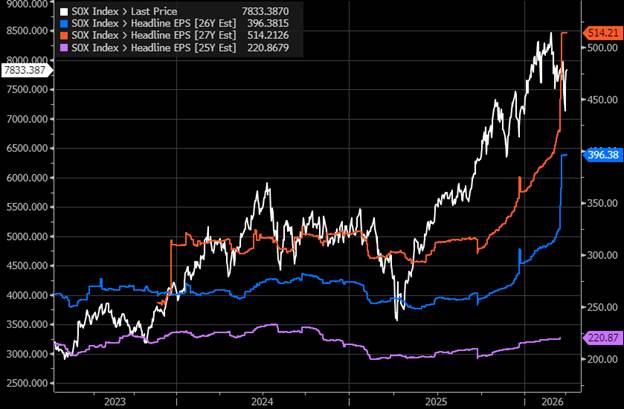
Source: Bloomberg, NewEdge Wealth, as of 4-2-26
Equal Weight S&P 500 Price and EPS Forecast 2025-2027
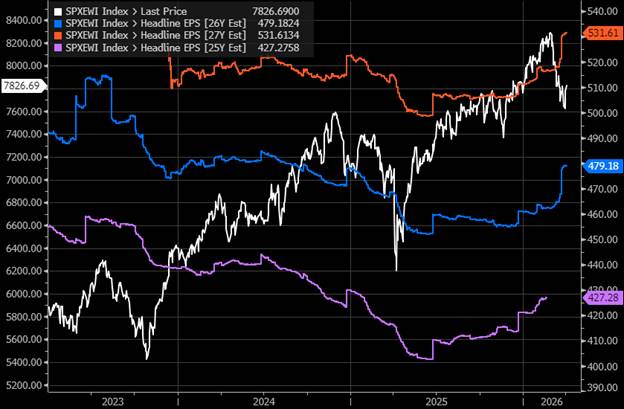
Source: Bloomberg, NewEdge Wealth, as of 4-2-26
The 1Q26 earnings season kicks off in just a week and a half and given the path of economic data through the quarter, we do not expect to see a distinct deterioration in 1Q26 results (current consensus expects 12% growth YoY for the quarter).
The bigger question is looking at the remainder of 2026 and determining if the very lofty growth estimates (2Q26 at 17.6%, 3Q26 at 19%, and 4Q26 at 18%) are achievable, mostly if the war sustains, energy prices remain elevated, and economic growth potentially slows.
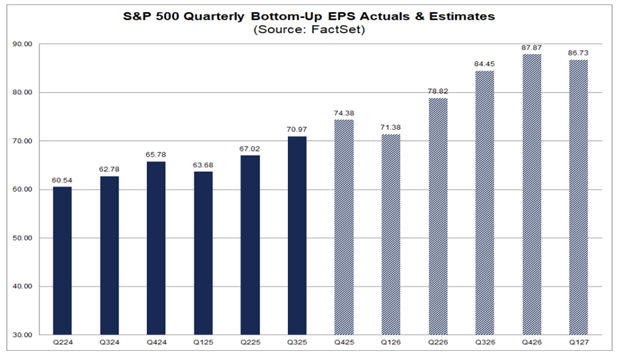
Source: FactSet, as of 4/2/26
“But I’ve Never Seen You Take a Turn That Wide”: EPS vs. FCF for the Magnificent 7
A key shift in market leadership in 2026 has been the passing of the baton from the Magnificent 7 (and indices with large Mag 7 weights like the Nasdaq 100 and the Russell 1000 Growth) to other indices that have much lower weights to these behemoth companies (like the Russell 1000 Value, Equal Weight S&P 500, and non-US indices).
All the downside in the Mag 7 index YTD has been driven by valuation multiple compression (the PE ratio for the Mag 7 dropped 22% in the first quarter), as EPS for this cohort has remained solid.
Magnificent 7 12-Month Forward Earnings and PE Multiple
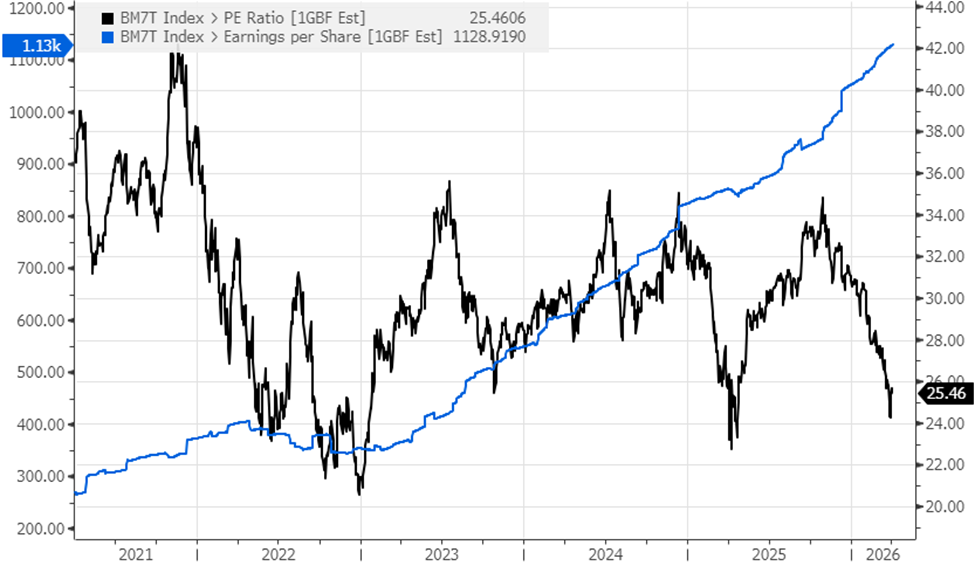
Source: Bloomberg, NewEdge Wealth, as of 4-2-26
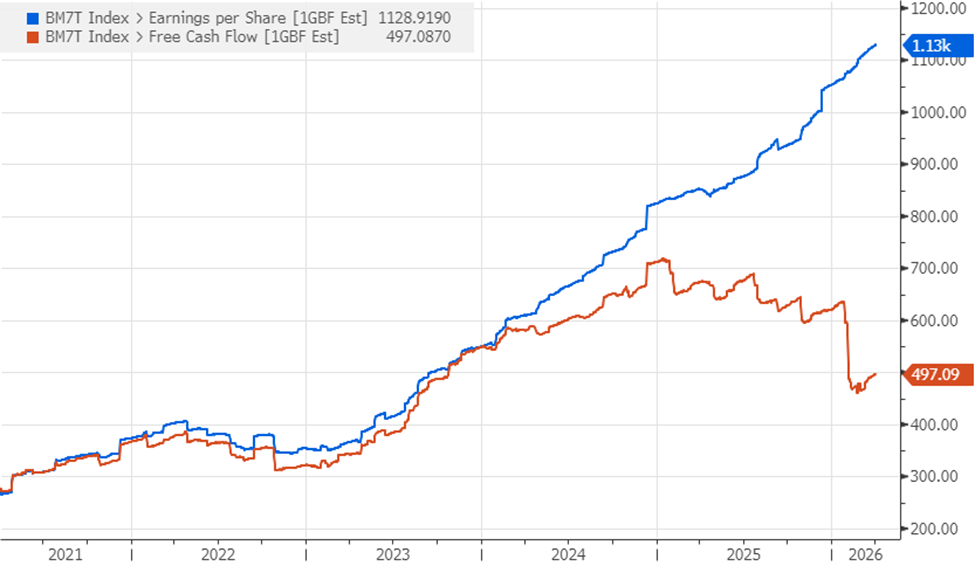
But the EPS vs. PE great divide is not what is interesting about the Mag 7. Instead, it is the EPS vs. Free Cash Flow (FCF) great divide that is fascinating.
The chart below shows how reported earnings soared for the Mag 7 over the last two years, but how Free Cash Flow has fallen! This is due to the unprecedented capex binge many of these companies have pursued in order to compete in the AI arms race (for the accounting-curious, capex is recognized in Free Cash Flow calculations in the year that it is spent, while it can be amortized over many years in the earnings calculation; also note that this FCF number could be flattered by accounting decisions as well, so it likely appears even better than reality).
This deterioration in cash generation and this departure from asset light, near-monopoly business models, are likely some of the reasons why we have seen such a sharp drop in the valuations for these Magnificent 7 names.
Magnificent 7 12-Month Forward Earnings and Free Cash Flow
Source: Bloomberg, NewEdge Wealth, as of 4-2-26
“How Hard it Was to Keep it All Inside”: Conclusion
Analysts, traders, and forecasters have been working hard to “keep it all inside” when it comes to pricing in or contemplating potential negative impacts from the war and the energy supply shock. These participants who expect robust economic and earnings growth are likely encouraged by recent resilient data, but we think that we need to remain vigilant as consensus is clearly expecting a quick resolution in the war, a return to normalized energy prices, and little impact to economic or earnings growth from the supply shock.
We hope that you can join us next week for our 2Q26 Outlook, where we will explore these topics in greater detail!
IMPORTANT DISCLOSURES
The views and opinions included in these materials belong to their author and do not necessarily reflect the views and opinions of NewEdge Capital Group, LLC.
This information is general in nature and has been prepared solely for informational and educational purposes and does not constitute an offer or a recommendation to buy or sell any particular security or to adopt any specific investment strategy.
NewEdge and its affiliates do not render advice on legal, tax and/or tax accounting matters. You should consult your personal tax and/or legal advisor to learn about any potential tax or other implications that may result from acting on a particular recommendation.
The trademarks and service marks contained herein are the property of their respective owners. Unless otherwise specifically indicated, all information with respect to any third party not affiliated with NewEdge has been provided by, and is the sole responsibility of, such third party and has not been independently verified by NewEdge, its affiliates or any other independent third party. No representation is given with respect to its accuracy or completeness, and such information and opinions may change without notice.
Investing involves risk, including possible loss of principal. Past performance is no guarantee of future results.
Any forward-looking statements or forecasts are based on assumptions and actual results are expected to vary from any such statements or forecasts. No assurance can be given that investment objectives or target returns will be achieved. Future returns may be higher or lower than the estimates presented herein.
An investment cannot be made directly in an index. Indices are unmanaged and have no fees or expenses. You can obtain information about many indices online at a variety of sources including: https://www.sec.gov/answers/indices.htm.
All data is subject to change without notice.
© 2026 NewEdge Capital Group, LLC
