

Weekly Summary: December 19 – 23
- Most people are well aware how difficult it is to break “bad habits.” They are typically broken when they begin to interfere with “proper functioning.” The Bank of Japan (BOJ) actually cited a decline in “market functionality” as a reason why it chose to modify its long-held yield curve control policy. It took the extreme changes associated with the pandemic and the Russia-Ukraine war that helped unleash much higher rates of inflation, that essentially “forced” many central banks (CBs) to break their “bad habits” of excessively easy monetary policies.
- The implementation of monetary tightening monetary policies on a global scale have also been “forcing” many companies and investors to change many of their “bad habits” as well. Many companies over-hired and became rather lax on controlling costs as they assumed a continued trend of robust economic growth that would be supported by low interest rates and “excess” liquidity. Many investors assumed that what “worked” for the past decade would continue to be appropriate. Vigilance over investments was no longer necessary. Changed circumstances have caused many of these “bad habits” to be discarded increasingly.
- Investment analysis will now require more scrutiny with a flexible mindset. It is our contention that a more focused and directed selection process could be required. For example, stock selection could be more important than just picking an overall sector. A more careful consideration of constantly evaluating the lags of changes in monetary policy and financial conditions could be required to better evaluate how and when their full economic effect can be felt in general and in regard to particular sectors and companies. On December 18, Goldman Sachs postulated that changes in financial conditions might have a lag time of only two quarters and that a change in monetary policy might even have an almost simultaneous change in financial conditions. There is much continuing debate over these issues. We will remain alert to incoming data and remain committed to our expectations that circumstances might change very abruptly.
- We maintain our belief that inflationary pressures could dissipate more quickly than many CBs and investors anticipate. But at a lower level of inflation – perhaps in the 3.5% to 4% range – inflation could become more “sticky” and become difficult to lower to a 2% rate of inflation. To the extent inflation dissipates quickly, pricing power of many companies could be compromised. To the extent wages continue to be elevated, we expect profit margins to be compressed at many companies. We anticipate that serious cost containment strategies of companies should be rewarded by financial markets.
The Upshot: Our general investment approach remains the same as depicted in last week’s commentary. We maintain our preference for big cap quality stocks with good balance sheets, relatively stable cash flows and stable margins. Volatility across sectors continues to be supportive of a well-diversified global portfolio for long term investors. We will continue to closely monitor China’s “reopening,” which we expect to have many “fits and starts.” Continued U.S. Dollar (USD) weakness, along with China’s “reopening” could provide a “tailwind” for the materials sector, and base metals in particular, such as copper. This combination should be beneficial for most commodities. Chinese leadership appears to be now more committed to growing China’s economy.
Financial markets appear to be concerned increasingly with a slowdown in global economic growth and increased probabilities of recession risks and valuation concerns. BOJ’s modified yield curve control policy appears to have precipitated an increase in global interest rates, including in U.S. Treasuries. The two-to-10-year yield curve has become less inverted this week as yield have risen. USD has remained very stable this week, close to its recent lows.
We continue to recommend that long term investors should try to take advantage of financial market volatility to better position their portfolios. We maintain our year-long conviction to not chase rallies and to buy only on market downturns. A flexible mindset will be a key to navigating financial markets.
“Bad Habits” of Many Central Banks
The Federal Reserve (Fed) and many of the world’s other major CBs are trying to correct simultaneously their “bad habits” of too easy monetary policies of over a decade. We surmise that the Fed is further along in this process of a global CB monetary tightening cycle than many other CBs. Because both the easing and tightening parts of these cycles transpired mostly on a global scale, the effects of these policies most likely were magnified substantially. Too low interest rates and too easy money resulted in many financial markets’ distortions, perhaps leading often to a misallocation of resources. The onset of the pandemic and Russia’s invasion of Ukraine initiated yet another set of distortions. After the Great Financial Crisis (GFC) of 2008-09, most CBs were trying just to come up with strategies to avoid a possible implosion of the world’s financial markets and institutions. But then it was as if many CBs became “intoxicated” with solving even more mild forms of economic distress. Ed Sheeran’s song “Bad Habits” seemed to fit the times: “Every pure intention ends when the good times start … It started under neon lights, and then it all got dark; I only knew how to go too far … My bad habits lead to [many unexpected developments and/or outcomes]; Swearin’ this will be the last, but it probably won’t … yeah, I was lookin’ for a way out, now I can’t escape.” This sounds like the talk of an addict, and we chose to characterize many CB behaviors of easy monetary policies for extended times as addictive.
CB’s Forced to Break “Bad Habits”
The inflationary pressures sparked by the pandemic and exacerbated by the Russia-Ukraine war, finally “forced” CBs to reverse their easy monetary policies. But as we all know, “bad habits” are very tough to break. Is it any wonder that the Fed resisted breaking their easy monetary habit by insisting wrongly and stubbornly that inflation was only “transitory?” Many CBs were even slower to respond. The European Central Bank (ECB) finally adopted last week a much more hawkish and aggressive stance. The BOJ finally relaxed its yield curve control policy (YCC) this week by allowing its 10-year sovereign bond yield to reach as high as 0.5% from its long held limit of 0.25%. BOJ Governor Kuroda was quick to add that this should not be taken as a tightening of monetary policy or a raising of interest rates. But many analysts viewed this as a prelude to a “normalization” of BOJ’s ultra-easy monetary policies as Japan’s inflation rate finally exceeded 2%. Kuroda is scheduled to step down in April 2023.
“Bad Habits” of Many Companies and Investors
Low interest rates and “easy” money also led to many “bad habits” for companies and investors as complacency became rather common. Many acted as if business cycles were a thing of the past. This was particularly true for many “growth” and tech companies that continued to hire, assuming healthy growth rates would continue. Numerous companies, including tech companies, over-hired and many have announced layoffs recently. Many tech companies became almost irresponsible on spending in “long-shot” type projects. Stock-picking became less relevant as easy money tended to “lift all boats.”
Lower Liquidity
In 2022, financial markets became less liquid as volatility accelerated. Quantitative tightening (QT) – the shrinking of the balance sheets of CBs – has lessened liquidity further. The Fed’s balance sheet is currently shrinking at a rate of $95 billion per month. The ECB’s balance sheet is expected to begin shrinking relatively early next year. Lower liquidity should lead to more volatility.
More Focus Recently on Recession Probabilities
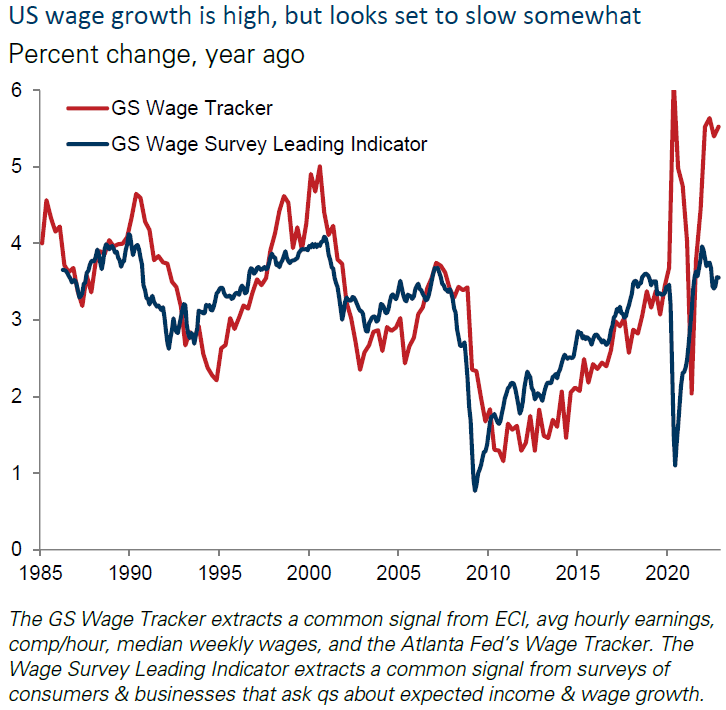
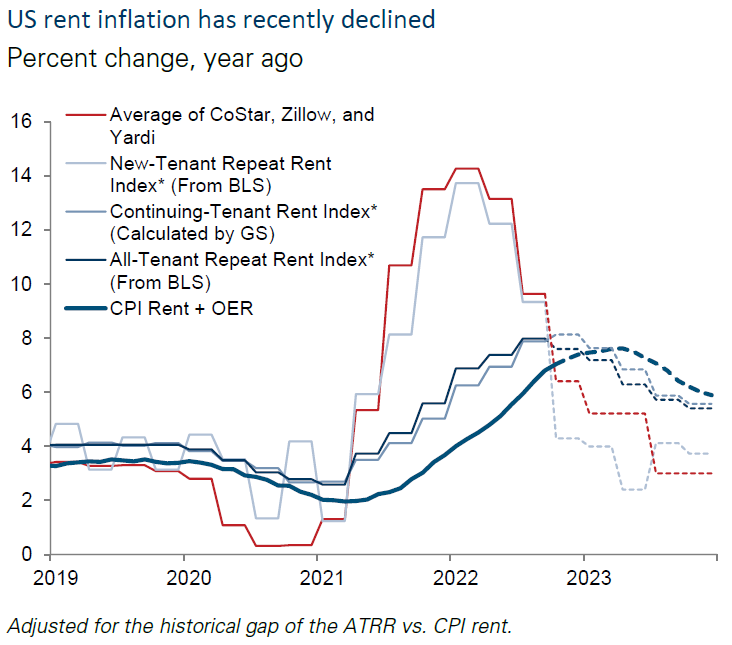
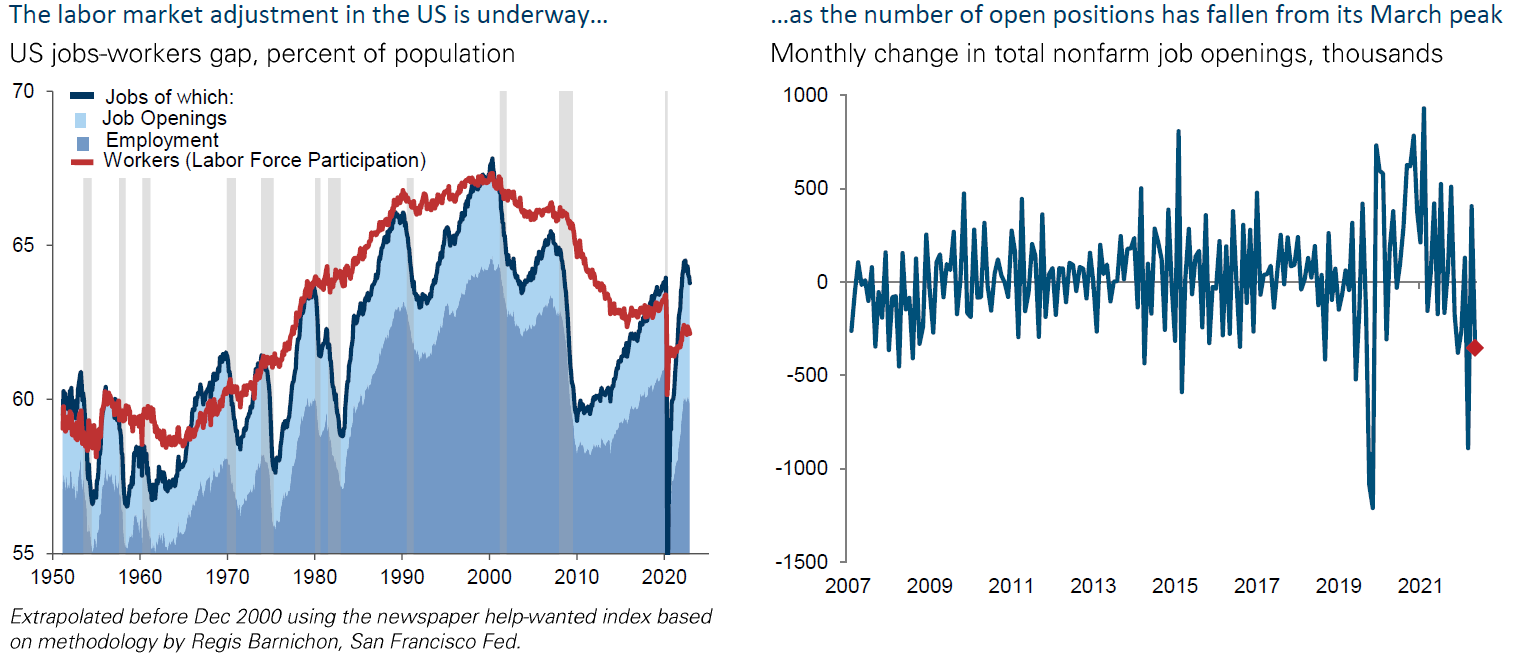
Financial markets seem to have focused recently on increased recession probabilities, including in the U.S. We have highlighted much financial data in many of our recent commentaries that show a slowing economy along with diminishing inflationary pressures. We have also conjectured that U.S. inflation will dissipate more quickly than many investors and analysts anticipate. We still maintain these views but wanted to highlight that at a certain point, perhaps when the Consumer Price Index (CPI) descends to a 3.5%-to-4% range, that inflation could become more “sticky” at approximately those levels. Wages seem to be the most reluctant to descend to a level of increases that is more compatible with a 2% rate of inflation. Fed chair Powell has estimated that a wage growth rate of 3.5% would be more compatible. Many wage growth rates still remain at roughly 5%.
Source: Goldman Sachs, 2022: 3 Themes in Charts (12-15-2022)
Structural Changes Could Precipitate More “Sticky” Inflation at Lower Inflation Levels
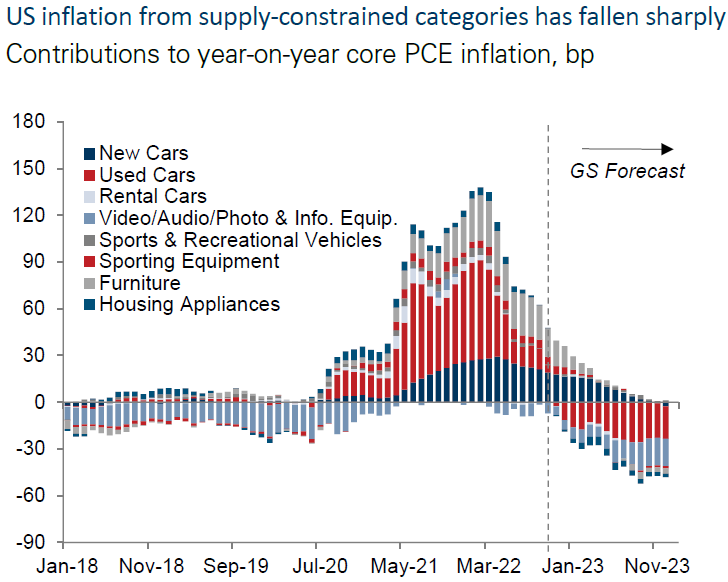
But we believe also that many structural changes have taken place since the onset of the pandemic, which will make it rather difficult to achieve a targeted 2% rate of inflation. Given the numerous supply chain disruptions experienced over the past two years, many companies should consider establishing a more diverse supply chain. Reliability as well as low costs could be considered. Just-in-time inventory strategies could become more lax, and more robust inventories might be maintained. These changes should increase inflationary pressures on a sustainable basis. A stubbornly low labor force participation rate should also lead to a continuing imbalance between labor demand and supply, which will make it harder to reduce wage growth rates. As inflation dissipates, pricing power should dissipate as well, leading to margin compression at many companies, whose earnings would suffer then. “Cost controls” could become the increased focus of many investors as they evaluate companies.
Source: Goldman Sachs, 2022: 3 Themes in Charts (12-15-2022)
U.S. Stock Market Appears Ready to Reward Cost Containment Measures
Two companies were rewarded this week for cost controls efforts as their stock prices rose after they announced their success in controlling costs. NIKE Inc.’s (NKE) stock rose over 12% on their announcement. The NKE management said that they would continue to focus on clearing inventory so that better inventory controls could set the stage for better margins. FedEx Corporation’s (FDX) stock rose more than 3% when they announced better-than-expected cost containment measures even though their revenues were less than expected. FDX management thought that they could cut another $1 billion in costs above what they had forecast in September. The CFO of FDX stated: “Our teams have an unwavering focus on rapidly implementing cost savings to improve profitability.” Both of these stocks continued to rise the next day even as equities staged a general retreat. Serious cost containment strategies looked like they could be “winning” strategies in this uncertain environment. Financial markets appeared willing to reward getting rid of “bad habits.”
Housing Data Released this Week Continued to Show a Deteriorating Market
NAHB Survey
The National Association of Home Builders (NAHB) fell another two points to 31 in December versus an expected level of 34. Other than its pandemic low of April 2020, this was the survey’s lowest level since mid-2012, and was the twelfth consecutive month that showed a decline in this index. This survey is meant to take the “pulse” of the single family housing market.
Source: JP Morgan, US Construction Data Points (12-20-2022)
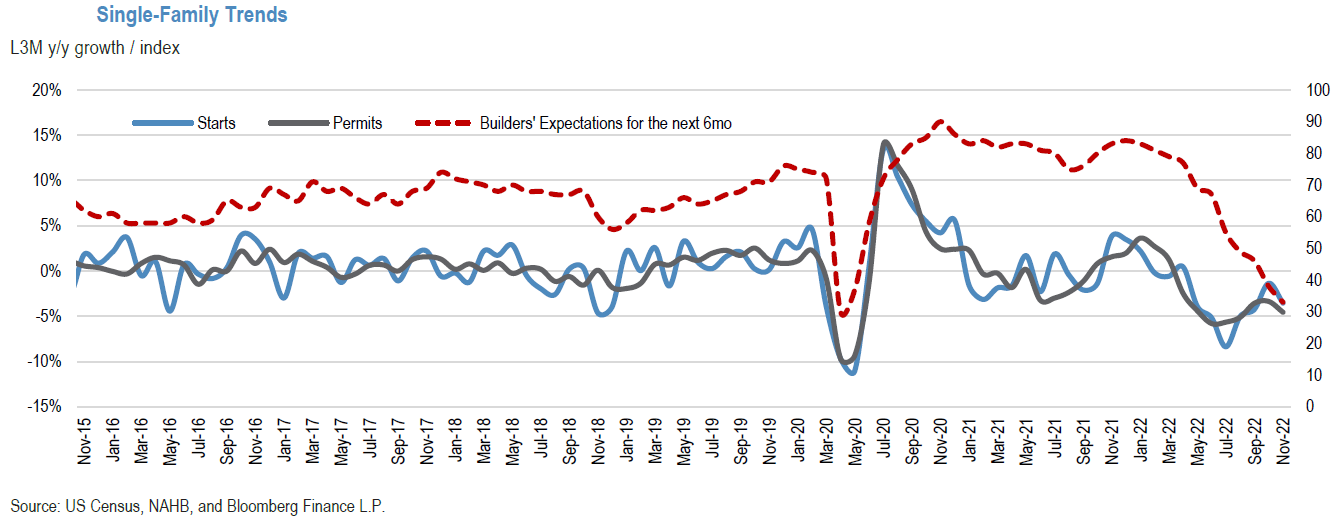
Housing Starts and Permits
November U.S. housing starts were 0.5% lower month-over-month (m/m) versus an expected 1.8% decline. But the more important single family starts declined 4.1% m/m as the more volatile multi-family starts were 4.9% higher. The more forward-looking building permits decreased 11.2% m/m versus an expected decline of 2.1%. Single family permits decreased 7.1% m/m, while multi-family permits were 16.4% lower.
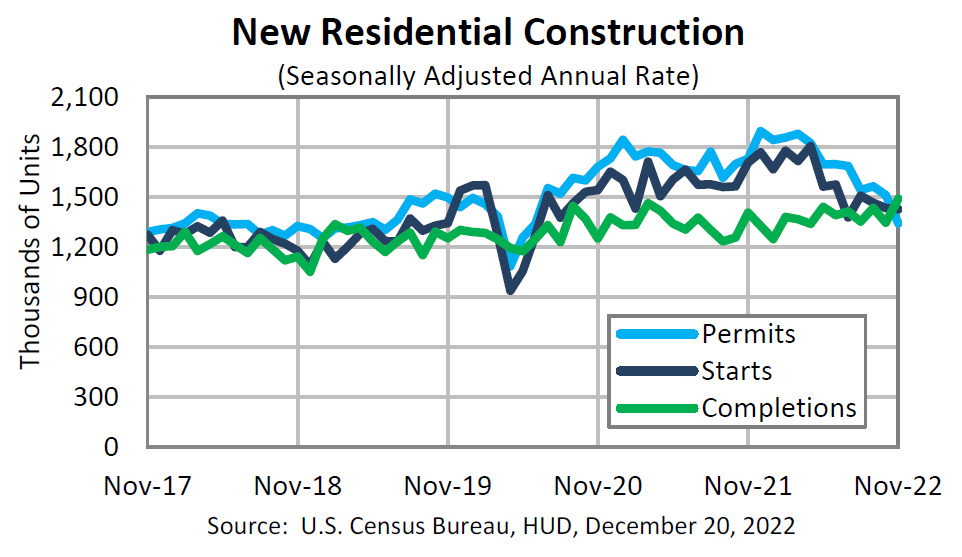
Source: US Census Bureau, Monthly New Residential Construction November 2022 (12-20-2022)
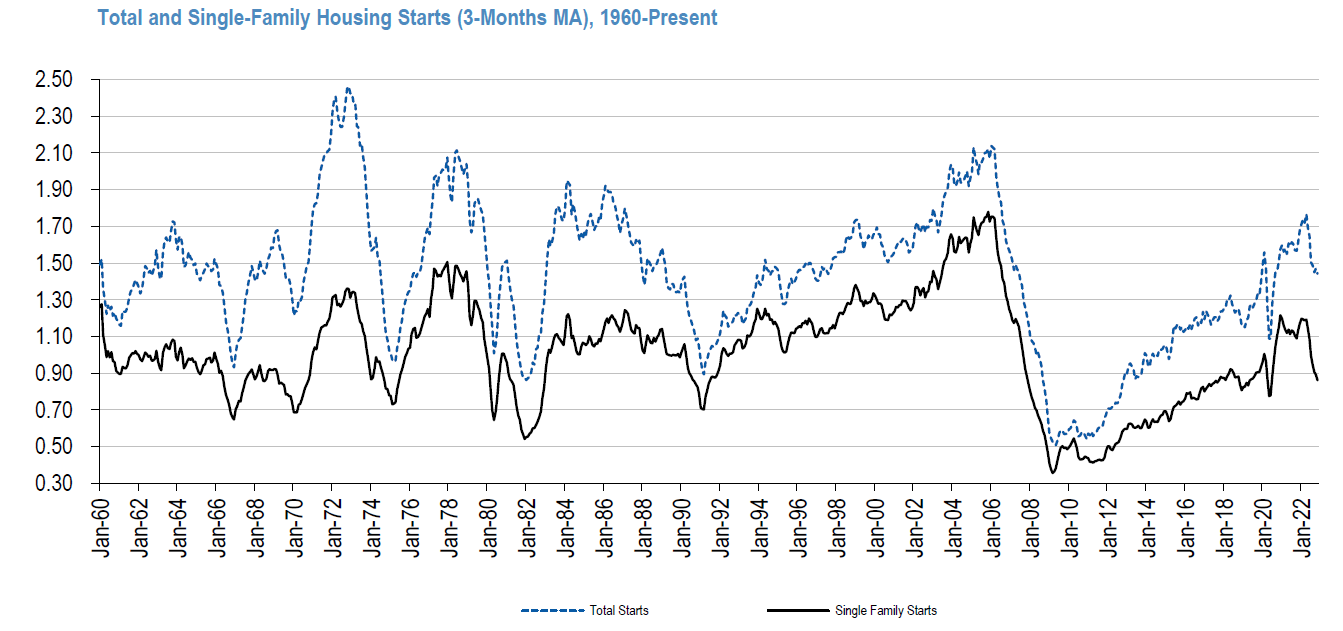
Source: JP Morgan, Homebuilding (12- 20-2022)
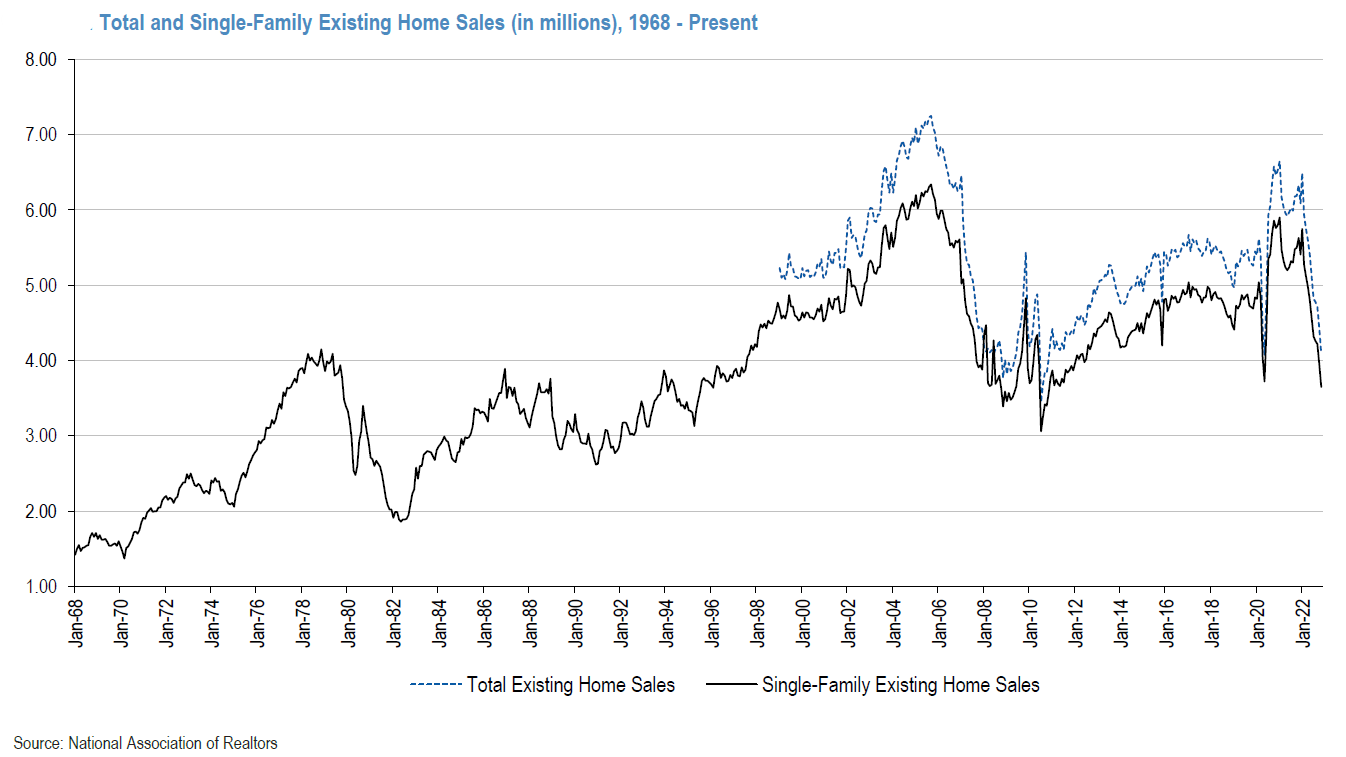
Existing Home Sales
Sales of previously owned homes in the U.S. fell 7.7% m/m in November, versus an expected decrease of 5.2% and were more than 35% lower y/y. Except for one month during the height of pandemic restrictions, this was the slowest pace of home sales since 2010.
Source: JP Morgan, Homebuilding (12- 21-2022)
New Home Sales
U.S. November new home sales were the only real bright spot in the housing market. New home sales unexpectedly rose 5.8% m/m to a seasonally adjusted annual rate of 640,000 compared to an expected annual rate of 600,000. Sales were 15.3% less y/y. October’s rate was revised lower to 605,000 from 632,000 originally reported. Given the many variables affecting the housing market, we hesitate to extrapolate from this seeming outlier data point.
Regional Fed Surveys
The Philadelphia Fed nonmanufacturing survey for December remained weak even as its general activity index turned slightly positive. The new orders and sales/revenue indexes were negative. The full employment index declined to a new low. Prices paid and received fell, but prices received fell much more – possibly indicating profit margin squeezes. New orders were negative for the fifth consecutive month and the sales/revenue index declined 4 points to a negative -0.7%, its first negative reading since August.
The Kansas City manufacturing index declined at a slightly faster pace in December when compared to November’s pace of decline. The index for raw materials prices fell to their lowest level since July 2020. The m/m composite index was -9, versus -6 in November and -7 in October. The employment index fell three points to zero, its worst reading since 2020.
The Conference Board
After two months of declines, the December Conference Board’s Consumer Confidence Index rose to 108.3 versus 101.4 in November and compared to an expected December reading of 101.0. This was its highest level since April. Both the present situations and expectation indexes rose. The expectations index rose from 76.7 in November to 82.4. But since the expectations index was “still lingering” around 80, which is a level associated with a recession, a probability of a recession was still considered likely. The Senior Director of Economic Indicators at the Conference Board provided a good summary: “The Present Situation and Expectations indexes improved due to consumers’ more favorable view regarding the economy and jobs. Inflation expectations retreated in December to their lowest level since September 2021, with recent declines in gasoline prices a major impetus. Vacation intentions improved but plans to purchase homes and big ticket appliances cooled further. The shift in consumers’ preferences from big ticket items to services will continue in 2023, as will headwinds from inflation and interest rate hikes.” The Conference Board’s labor market differential increased as consumers’ perceptions of “jobs plentiful” increased and the perception that jobs were “less hard to get” dropped. The net of these perceptions was an increase of more than four points to 35.8, which is consistent with a tight labor market. The lower-than-expected initial claims for unemployment insurance for the week that ended December 17 confirmed that the U.S. labor market remained “tight.”
The Conference Board’s Leading Economic Index (LEI) declined 1.0% m/m in November to 113.5 versus an expected decrease of 0.5%, and following a 0.9% decrease in October. The LEI has declined now 3.7% over the last six months, compared to a contraction of only 0.8% for the prior six months. The Senior Director of Economics at The Conference Board stated that “only stock prices contributed positively to U.S. LEI in November. Labor market, manufacturing, and housing indicators all weakened – reflecting serious headwinds to economic growth … Despite the current resilience of the labor market and consumer confidence improving in December … we project a U.S. recession is likely to start around the beginning of 2023 and last through mid-year.”
University of Michigan Consumer Sentiment – Final Results for December
December’s overall consumer sentiment was revised higher from December’s preliminary reading of 59.1 to 59.7. Nevertheless, it remains 15% below one year ago levels. Expectations were revised higher to 59.9 from 58.4. The current conditions subindex was revised lower from 60.2 to 59.4. One year inflation expectations were revised lower to 4.4% from 4.6%. This was the lowest reading in eighteen months. The five-year inflation outlook was revised lower to 2.9% from 3.0%. However, consumers continued to show “substantial uncertainty” with respect to future prices. The one-year outlook for business conditions “surged” 29% and the long-term outlook improved 9%. Even after these increases, both measures remained “well below” 2021 readings.
Real Q3 GDP Revised Higher – Again
The U.S. Bureau of Economic Analysis (BEA) disclosed its third and final estimate of Q3 real GDP. It was revised higher once again from 2.9% in the second estimate to a final 3.2% annualized rate. Much of this latest increase was attributable to the upwardly revised estimate of real consumer spending from 1.7% to 2.3%. The price index for gross domestic purchases increased 4.8% in Q3, 0.1% higher from the prior estimate. The personal consumption expenditures price index (PCE Price index) retained its 4.3% increase. The PCE price index is the Fed’s preferred measure of inflation.
Reliability of U.S. Economic Statistics Could be Subject to Substantial Revisions
As we have highlighted repeatedly in several of our prior commentaries, many economic statistics have been distorted or subject to substantial revisions. This is particularly the case for seasonal adjustments that resulted from drastic and abrupt economic changes due to the pandemic and the Russia-Ukraine war. The recently-disclosed early benchmark revisions of state payroll employment on a nationwide basis for Q2 by the Philadelphia Fed show a possible shortfall of roughly one million fewer jobs than has been officially reported by the Bureau of Labor Statistics (BLS). The BLS will officially revise Q2 employment figures in February 2023. But the final employment revisions for all of 2022, won’t be officially released until February 2024, although preliminary estimates should be released during the summer of 2023. In this context, we have highlighted discrepancies between the BLS official employment reports and the household surveys of employment, which have recently showed many fewer increases in nonfarm payrolls. According to a J.P. Morgan (JPM) December 16 report, the BLS accounted for almost two million more jobs added for the six months through November when compared to the household survey. However, the household survey shows almost one million jobs added during this six-month period when adjusted to be “conceptually equivalent to the establishment survey.”
Some of China’s “Bad Habits”
China has not been immune from “bad habits.” It is well known that China has bolstered its economic growth rates for many years through the leverage and growth of its property sector. It began to rein in this type of growth pre-pandemic and was making an effort to de-leverage, using such terms as “houses are for living” and not investing. We chose to characterize excessive debt as a “bad habit.” We characterize lack of transparency and authoritarian rule as other bad habits. Such traits helped lead China to adopt a “zero-COVID-19” policy. This policy came with a great economic cost to China in 2022. After very rare public protests, mostly against such policies that resulted in many “lockdowns” and restrictions, China decided to abruptly mostly end many of its most restrictive policies, which essentially ended “zero-COVID” that was favored by China’s president Xi Jinping. Along with more relaxed restrictions, some of China’s medical representatives were indicating that the latest COVID strains were no more virulent than the flu. On December 7, Chinese authorities removed many virus testing requirements and health code checks for domestic travel. Although most of China’s population is vaccinated, the elderly, especially those over 80 years old are not vaccinated “adequately.” It is also well known that many of China’s vaccines are not as effective as those of many developed countries. On December 23, Bloomberg News reported that according to the minutes of an internal meeting of China’s National Health Commission held Wednesday, “as many as 248 million people, or nearly 18% of the population, likely contracted the virus in the first 20 days of December.” China’s top health authority estimated that as many as 37 million people in China may have been infected with coronavirus on a single day this week. The previous daily record of about 4 million was set in January 2022. But China continued to report a miniscule death toll due to coronavirus. As of Wednesday, China’s overall death toll due to coronavirus was barely over 5,000. This is due to China’s newly announced definition of a COVID-10 related death. According to the latest guidelines from China’s National Health Commission, “only those whose death is caused by pneumonia and respiratory failure after contracting the virus are classified as Covid deaths.” On Wednesday, the World Health Organization’s emergencies chief characterized this definition as “quite narrow.” Anecdotally, the death toll appears much higher. Some studies project a death toll that could exceed over 1 million coronavirus related deaths in China. As we have stated previously, this could lead to many “fits and starts” in China’s “reopening.”
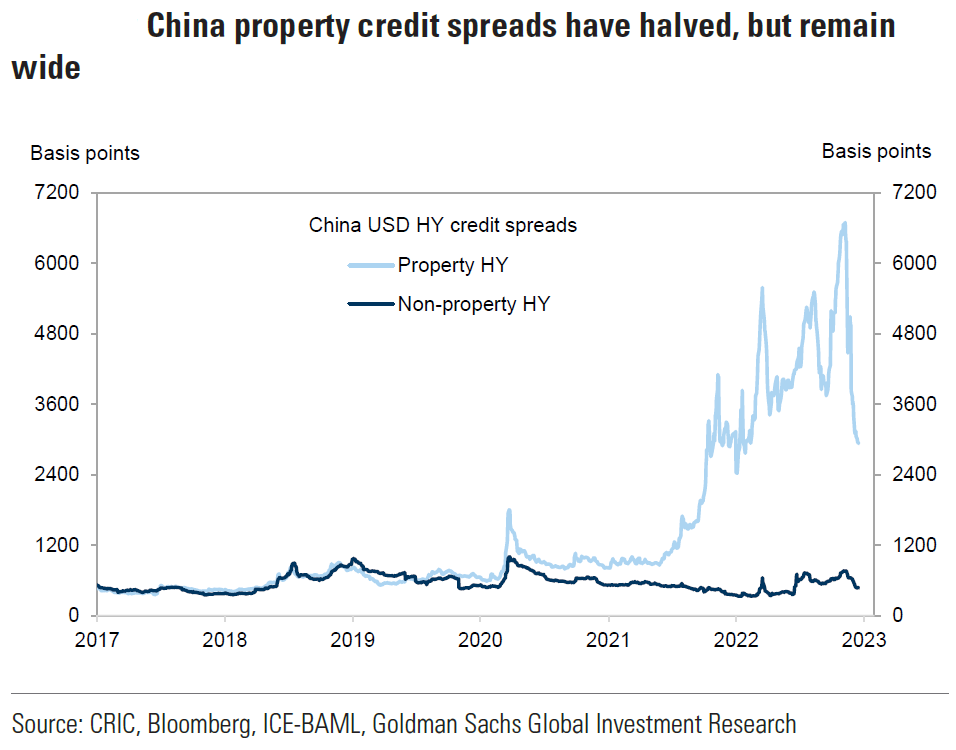
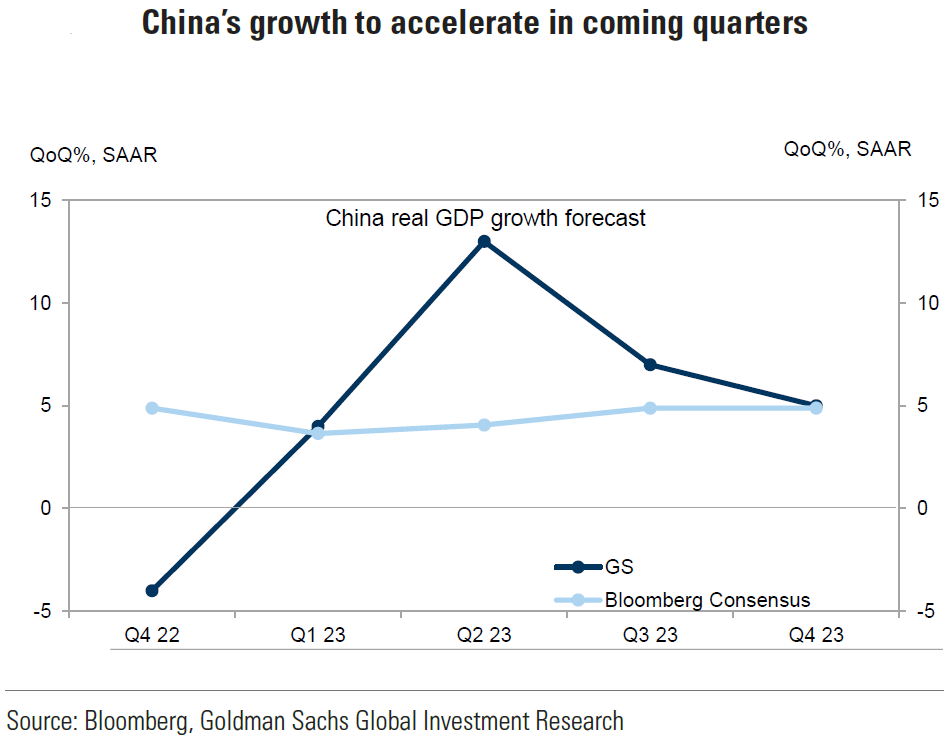
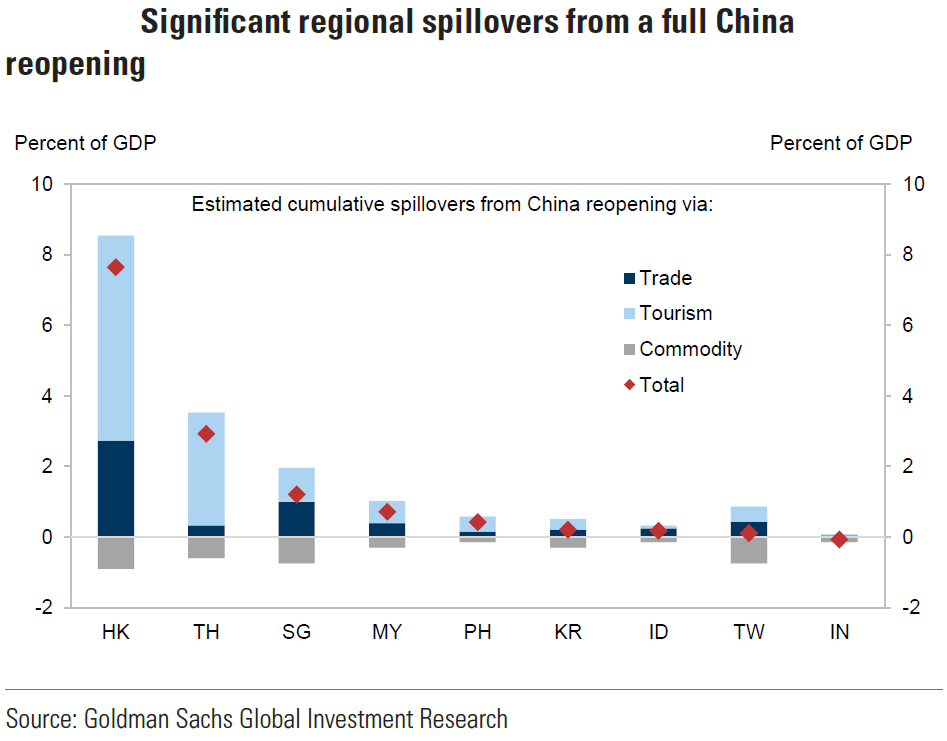
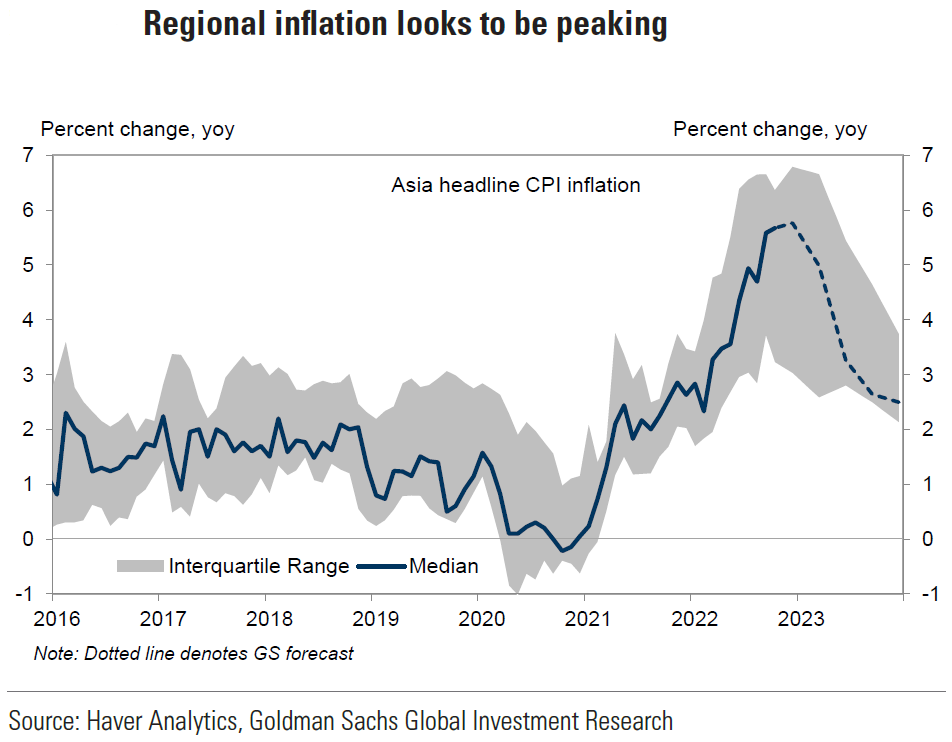
Source: Goldman Sachs, Asia Views: China’s policymakers refocus on growth (12-20-2022)
PCE Inflation
The Fed’s preferred measure of inflation, PCE inflation, was released on Friday for the month of November. All figures were roughly as expected. Headline PCE price index rose 0.1% m/m and 5.5% y/y and versus 6.1% y/y in October. Prices for goods decreased 0.4% and services prices increased by 0.4%. The core PCE price index, excluding food and energy rose 0.2% m/m and 4.7% y/y, which was a four-month low. October’s core PCE reading was revised higher to 0.3% m/m. Personal income rose 0.4% m/m in November versus 0.7% in October and above expectations of an increase of 0.3%. The biggest surprise was the less than expected increase of personal consumption expenditures of 0.1% m/m versus an expected 0.2% increase. Many analysts have speculated that October’s strong increase in expenditures “pulled forward” some holiday shopping. Confirming recent trends, expenditures for goods fell as services expenditures increased.
Durable Goods
U.S. November new orders for durable goods dropped by a greater than expected 2.1% m/m versus an expected 0.6% decline and a downwardly revised 0.7% m/m increase in October. This was the sharpest monthly decline since April 2020. Excluding transportation equipment, core durable goods orders were 0.2% higher m/m versus 0.1% in October and 3.4% higher y/y. Orders for transportation equipment fell 6.3% m/m in November versus an increase 0f 1.9% in October.
Bottom Line
For the time being, we are maintaining our basic investment approach as expressed in last week’s commentary. We continue to prefer high quality big cap stocks that offer good balance sheets, as well as relatively stable cash flows and profit margins. We expect volatility across virtually all financial markets.
Financial markets appear to be concerned increasingly with a slowdown in global economic growth and increased probabilities of recession risks and valuation concerns. BOJ’s modified yield curve control policy appears to have precipitated an increase in global interest rates, including U.S. Treasury yields. The two-to-10year yield curve has become less inverted this week as yields have risen. USD has remained very stable this week, close to its recent lows.
Definitions
Financial Conditions – Financial conditions can be defined as the current state of financial variables that influence economic behavior and (thereby) the future state of the economy. In theory, such financial variables may include anything that characterizes the supply or demand of financial instruments relevant for economic activity.
Quantitative Tightening (QT) – Quantitative tightening refers to monetary policies that contract, or reduce, the Federal Reserve System’s balance sheet.
Pricing Power – Pricing power is an economic term that describes the effect of a change in a firm’s product price on the quantity demanded of that product.
China Reopening – A “reopening” in China means an easing of their zero-covid policy which includes a relaxation of travel rules and domestic travel.
Headline Consumer Price Index (Headline CPI) – Headline inflation is the raw inflation figure reported through the Consumer Price Index (CPI) that is released monthly by the Bureau of Labor Statistics (BLS). The CPI calculates the cost to purchase a fixed basket of goods to determine how much inflation is occurring in the broad economy. The CPI uses a base year and indexes the current year’s prices, according to the base year’s values.
Core Consumer Price Index (Core CPI) – Core inflation removes the CPI components that can exhibit large amounts of volatility from month to month, which can cause unwanted distortion to the headline figure. The most commonly removed factors are those relating to the costs of food and energy. Food prices can be affected by factors outside of those attributed to the economy, such as environmental shifts that cause issues in the growth of crops. Energy costs, such as oil production, can be affected by forces outside of traditional supply and demand, such as political dissent.
Personal Consumption Expenditures Index (PCE) – This is a measure of the prices that people living in the United States, or those buying on their behalf, pay for goods and services. The PCE price index is known for capturing inflation (or deflation) across a wide range of consumer expenses and reflecting changes in consumer behavior. It is produced by the Bureau of Economic Analysis (BEA).
Real GDP – Real gross domestic product (GDP) is an inflation-adjusted measure that reflects the value of all goods and services produced by an economy in a given year. Real GDP is expressed in base-year prices. It is often referred to as constant-price GDP, inflation-corrected GDP, or constant dollar GDP. Put simply, real GDP measures the total economic output of a country and is adjusted for changes in price.
Household Employment Survey – The household survey (CPS) is designed to measure the labor force status of the civilian noninstitutional population with demographic detail. The national unemployment rate is the best-known statistic produced from the household survey.
The NAHB/Wells Fargo Housing Market Index (HMI) – The NAHB/Wells Fargo Housing Market Index is a monthly sentiment survey of members of the National Association of Home Builders. The index measures sentiment among builders of U.S. single-family homes and is a widely watched gauge of the U.S. housing sector.
Philadelphia Nonmanufacturing Business Outlook Survey – The Nonmanufacturing Business Outlook Survey is a monthly survey of nonmanufacturers in the Third Federal Reserve District. Participants indicate the direction of change in overall business activity and in the various measures of activity at their firms, including new orders, sales or revenues, employment, prices, and capital expenditures.
Kansas City Fed Manufacturing Index – The Kansas City Fed index offers a monthly assessment of change in the region’s manufacturing sector. Positive readings indicate monthly growth and negative readings monthly contraction.
Durable Goods – Durable goods derive their name from the fact that they last in value for a relatively long time. An individual’s wealth is preserved by spending a high proportion of their income on durable, investment, or capital goods, because the goods retain their economic value for longer periods of time.
Housing starts – Housing starts are a measure of new residential construction and are considered a key economic indicator.
Housing Permits – Housing permits are a type of authorization that must be granted by a government or other regulatory body before the construction of a new or existing home can legally occur.
Existing home sales – Existing home sales transaction data measure and report sales and prices of existing single-family homes, condos, and co-ops for the United States, and is broken down by region: West, Midwest, South, and Northeast.
Leading Economic Indicators Conference Board – The components of The Conference Board Leading Economic Index for the U.S. include:
- Average weekly hours in manufacturing – The average hours worked per week by production workers in manufacturing industries tend to lead the business cycle because employers usually adjust work hours before increasing or decreasing their workforce.
- Average weekly initial claims for unemployment insurance – The number of new claims filed for unemployment insurance are typically more sensitive than either total employment or unemployment to overall business conditions, and this series tends to lead the business cycle.
- Manufacturers’ new orders for consumer goods and materials – These goods are primarily used by consumers. The inflation-adjusted value of new orders leads actual production because new orders directly affect the level of both unfilled orders and inventories that firms monitor when making production decisions.
- ISM Index of New Orders – This index reflects the levels of new orders from customers. As a diffusion index, its value reflects the number of participants reporting increased orders during the previous month compared to the number reporting decreased orders, and this series tends to lead the business cycle.
- Manufacturers’ new orders for nondefense capital goods excluding aircraft orders – This index, combing with orders from aircraft (in inflation-adjusted dollars) are the producers’ counterpart to consumer goods and materials.
- Building permits for new private housing units – The number of residential building permits issued is an indicator of construction activity, which typically leads most other types of economic production.
- S&P 500 Index of Stock Prices – The Standard & Poor’s 500 stock index reflects the price movements of a broad selection of common stocks traded on the New York Stock Exchange.
- Leading Credit Index – This index is consisted of six financial indicators: 2-years Swap Spread (real time), LIBOR 3 month less 3 month Treasury-Bill yield spread (real time), Debit balances at margin account at broker dealer (monthly), AAII Investors Sentiment Bullish (%) less Bearish (%) (weekly), and Senior Loan Officers C&I loan survey
- Interest rate spread (10-year Treasury bonds less federal funds rate) – The spread or difference between long and short rates is often called the yield curve.
- Average consumer expectations for business condition – This index reflects changes in consumer attitudes concerning future economic conditions.
IMPORTANT DISCLOSURES
The views and opinions included in these materials belong to their author and do not necessarily reflect the views and opinions of NewEdge Capital Group, LLC.
This information is general in nature and has been prepared solely for informational and educational purposes and does not constitute an offer or a recommendation to buy or sell any particular security or to adopt any specific investment strategy.
NewEdge and its affiliates do not render advice on legal, tax and/or tax accounting matters. You should consult your personal tax and/or legal advisor to learn about any potential tax or other implications that may result from acting on a particular recommendation.
The trademarks and service marks contained herein are the property of their respective owners. Unless otherwise specifically indicated, all information with respect to any third party not affiliated with NewEdge has been provided by, and is the sole responsibility of, such third party and has not been independently verified by NewEdge, its affiliates or any other independent third party. No representation is given with respect to its accuracy or completeness, and such information and opinions may change without notice.
Investing involves risk, including possible loss of principal. Past performance is no guarantee of future results.
Any forward-looking statements or forecasts are based on assumptions and actual results are expected to vary from any such statements or forecasts. No assurance can be given that investment objectives or target returns will be achieved. Future returns may be higher or lower than the estimates presented herein.
An investment cannot be made directly in an index. Indices are unmanaged and have no fees or expenses. You can obtain information about many indices online at a variety of sources including: https://www.sec.gov/fast-answers/answersindiceshtm.html or http://www.nasdaq.com/reference/index-descriptions.aspx.
All data is subject to change without notice.
© 2024 NewEdge Capital Group, LLC


